
Top Related Projects

dplyr: A grammar of data manipulation

Flexible and powerful data analysis / manipulation library for Python, providing labeled data structures similar to R data.frame objects, statistical functions, and much more

Apache Spark - A unified analytics engine for large-scale data processing

A Python package for manipulating 2-dimensional tabular data structures

DuckDB is an analytical in-process SQL database management system

In-memory tabular data in Julia
Quick Overview
data.table is a high-performance data manipulation package for R. It provides an enhanced version of data.frames with syntax and feature enhancements for ease of use, convenience, and programming speed. data.table is particularly efficient for large datasets and offers fast aggregation of large data, fast ordered joins, and fast add/modify/delete of columns by group.
Pros
- Extremely fast performance, especially for large datasets
- Concise and expressive syntax for data manipulation
- Memory efficient, allowing for handling of large data in limited RAM
- Compatibility with base R and other popular packages like dplyr
Cons
- Steeper learning curve compared to base R or dplyr
- Syntax can be less intuitive for beginners
- Some functions and features are unique to data.table, requiring specific knowledge
- Limited built-in plotting capabilities compared to other data manipulation packages
Code Examples
- Basic data manipulation:
library(data.table)
dt <- data.table(x = 1:5, y = letters[1:5])
dt[x > 2]
dt[, .(sum_x = sum(x), mean_y = mean(y))]
- Fast grouping and aggregation:
dt <- data.table(grp = rep(c("A", "B"), each = 5), val = rnorm(10))
dt[, .(mean_val = mean(val)), by = grp]
- Efficient joins:
dt1 <- data.table(id = 1:5, x = letters[1:5])
dt2 <- data.table(id = c(2, 4, 6), y = LETTERS[1:3])
dt1[dt2, on = "id"]
- Adding/updating columns by reference:
dt <- data.table(x = 1:5, y = letters[1:5])
dt[, z := x^2]
dt[, `:=`(a = x + 1, b = toupper(y))]
Getting Started
To get started with data.table, install and load the package:
install.packages("data.table")
library(data.table)

# Create a data.table
dt <- data.table(x = 1:5, y = letters[1:5])

# Basic operations
dt[x > 2]
dt[, .(sum_x = sum(x)), by = y]

# Read a large CSV file efficiently
fread("large_file.csv")
For more information, refer to the official documentation and vignettes available on CRAN and the package's GitHub repository.
Competitor Comparisons
dplyr: A grammar of data manipulation
Pros of dplyr
- More intuitive syntax for beginners
- Seamless integration with other tidyverse packages
- Consistent verb-based functions for data manipulation
Cons of dplyr
- Generally slower performance, especially for large datasets
- Higher memory usage compared to data.table
- Less flexibility for advanced operations
Code Comparison
dplyr:
library(dplyr)
result <- mtcars %>%
  group_by(cyl) %>%
  summarize(avg_mpg = mean(mpg))
data.table:
library(data.table)
dt <- as.data.table(mtcars)
result <- dt[, .(avg_mpg = mean(mpg)), by = cyl]
Both dplyr and data.table are powerful R packages for data manipulation. dplyr offers a more user-friendly approach with its consistent syntax and integration with the tidyverse ecosystem. However, data.table excels in performance and memory efficiency, making it more suitable for large datasets and complex operations. The choice between the two often depends on the specific requirements of the project, the size of the data, and the user's familiarity with each package's syntax.
Flexible and powerful data analysis / manipulation library for Python, providing labeled data structures similar to R data.frame objects, statistical functions, and much more
Pros of pandas
- More extensive documentation and larger community support
- Broader functionality, including time series analysis and plotting
- Seamless integration with other Python scientific libraries
Cons of pandas
- Generally slower performance for large datasets
- Higher memory usage, especially for operations on large DataFrames
- Steeper learning curve for some advanced operations
Code Comparison
pandas:
import pandas as pd

df = pd.read_csv('data.csv')
result = df.groupby('category')['value'].sum().reset_index()
data.table:
library(data.table)

dt <- fread('data.csv')
result <- dt[, .(sum_value = sum(value)), by = category]
Both libraries offer efficient data manipulation, but data.table typically provides faster performance for large datasets and has a more concise syntax. pandas excels in its integration with the Python ecosystem and offers a wider range of built-in functions. The choice between them often depends on specific project requirements, performance needs, and the user's familiarity with R or Python.
Apache Spark - A unified analytics engine for large-scale data processing
Pros of Spark
- Distributed computing capabilities for big data processing
- Supports multiple programming languages (Scala, Java, Python, R)
- Offers a wide range of built-in machine learning algorithms
Cons of Spark
- Steeper learning curve and more complex setup
- Higher memory requirements and potential overhead for smaller datasets
- Slower performance for in-memory operations on single-node systems
Code Comparison
data.table (R):
library(data.table)
dt <- fread("large_file.csv")
result <- dt[, .(mean_value = mean(value)), by = group]
Spark (PySpark):
from pyspark.sql import SparkSession

spark = SparkSession.builder.appName("Example").getOrCreate()
df = spark.read.csv("large_file.csv", header=True, inferSchema=True)
result = df.groupBy("group").agg({"value": "mean"})
Both libraries offer efficient data manipulation, but data.table excels in single-node performance and ease of use for smaller datasets, while Spark shines in distributed computing environments and big data processing. data.table is R-specific, whereas Spark supports multiple languages and provides a more comprehensive ecosystem for large-scale data processing and machine learning tasks.
A Python package for manipulating 2-dimensional tabular data structures
Pros of datatable
- Written in C++, potentially offering better performance for certain operations
- Designed with multi-threaded processing in mind from the ground up
- Aims to provide a more intuitive API for data manipulation tasks
Cons of datatable
- Less mature and stable compared to data.table
- Smaller community and ecosystem of extensions/plugins
- Limited documentation and learning resources available
Code Comparison
data.table:
library(data.table)
dt <- data.table(x = 1:5, y = letters[1:5])
dt[x > 2, .(sum_x = sum(x), y)]
datatable:
import datatable as dt
df = dt.Frame({"x": range(1, 6), "y": list("abcde")})
df[f.x > 2, {"sum_x": dt.sum(f.x), "y": f.y}]
Both libraries offer concise syntax for data manipulation, but datatable uses a more Python-centric approach. While data.table is deeply integrated into the R ecosystem, datatable aims to provide similar functionality in Python with a focus on performance and ease of use. However, data.table's maturity and extensive documentation give it an edge in terms of stability and community support.
DuckDB is an analytical in-process SQL database management system
Pros of DuckDB
- Supports SQL queries, making it more familiar for users with SQL background
- Designed for analytical workloads, potentially faster for complex aggregations
- Supports multiple programming languages, not limited to R
Cons of DuckDB
- Less memory-efficient for in-memory operations compared to data.table
- Steeper learning curve for users without SQL experience
- Fewer specialized functions for data manipulation compared to data.table
Code Comparison
data.table:
library(data.table)
dt <- fread("large_file.csv")
result <- dt[, .(mean_value = mean(value)), by = group]
DuckDB:
CREATE TABLE data AS SELECT * FROM read_csv_auto('large_file.csv');
SELECT group, AVG(value) AS mean_value
FROM data
GROUP BY group;
Both data.table and DuckDB are powerful tools for data manipulation and analysis, but they cater to different use cases and user preferences. data.table excels in memory-efficient operations and provides a wide range of specialized functions for data manipulation in R. DuckDB, on the other hand, offers SQL support and is designed for analytical workloads across multiple programming languages. The choice between the two depends on the specific requirements of the project and the user's familiarity with R or SQL.
In-memory tabular data in Julia
Pros of DataFrames.jl
- Leverages Julia's speed and type system for efficient data manipulation
- Seamless integration with Julia's ecosystem and scientific computing libraries
- More flexible and extensible due to Julia's multiple dispatch feature
Cons of DataFrames.jl
- Smaller community and fewer resources compared to data.table's R ecosystem
- Less mature and potentially less stable than the well-established data.table
- May have a steeper learning curve for those not familiar with Julia
Code Comparison
DataFrames.jl:
using DataFrames
df = DataFrame(A = 1:4, B = ["M", "F", "F", "M"])
gdf = groupby(df, :B)
combine(gdf, :A => mean)
data.table:
library(data.table)
dt <- data.table(A = 1:4, B = c("M", "F", "F", "M"))
dt[, .(mean_A = mean(A)), by = B]
Both examples demonstrate grouping and aggregation, showcasing the similar functionality but different syntax between the two libraries. DataFrames.jl uses a more verbose, function-based approach, while data.table employs a concise, specialized syntax.
Convert  designs to code with AI

Introducing Visual Copilot: A new AI model to turn Figma designs to high quality code using your components.
Try Visual CopilotREADME
data.table 

![]()


data.table provides a high-performance version of base R's data.frame with syntax and feature enhancements for ease of use, convenience and programming speed.
Why data.table?
- concise syntax: fast to type, fast to read
- fast speed
- memory efficient
- careful API lifecycle management
- community
- feature rich
Features
- fast and friendly delimited file reader:
?fread, see also convenience features for small data - fast and feature rich delimited file writer:
?fwrite - low-level parallelism: many common operations are internally parallelized to use multiple CPU threads
- fast and scalable aggregations; e.g. 100GB in RAM (see benchmarks on up to two billion rows)
- fast and feature rich joins: ordered joins (e.g. rolling forwards, backwards, nearest and limited staleness), overlapping range joins (similar to
IRanges::findOverlaps), non-equi joins (i.e. joins using operators>, >=, <, <=), aggregate on join (by=.EACHI), update on join - fast add/update/delete columns by reference by group using no copies at all
- fast and feature rich reshaping data:
?dcast(pivot/wider/spread) and?melt(unpivot/longer/gather) - any R function from any R package can be used in queries not just the subset of functions made available by a database backend, also columns of type
listare supported - has no dependencies at all other than base R itself, for simpler production/maintenance
- the R dependency is as old as possible for as long as possible, dated April 2014, and we continuously test against that version; e.g. v1.11.0 released on 5 May 2018 bumped the dependency up from 5 year old R 3.0.0 to 4 year old R 3.1.0
Installation
install.packages("data.table")

# latest development version (only if newer available)
data.table::update_dev_pkg()

# latest development version (force install)
install.packages("data.table", repos="https://rdatatable.gitlab.io/data.table")
See the Installation wiki for more details.
Usage
Use data.table subset [ operator the same way you would use data.frame one, but...
- no need to prefix each column with
DT$(likesubset()andwith()but built-in) - any R expression using any package is allowed in
jargument, not just list of columns - extra argument
byto computejexpression by group
library(data.table)
DT = as.data.table(iris)

# FROM[WHERE, SELECT, GROUP BY]
# DT  [i,     j,      by]

DT[Petal.Width > 1.0, mean(Petal.Length), by = Species]
#      Species       V1
#1: versicolor 4.362791
#2:  virginica 5.552000
Getting started
- Introduction to data.table vignette
- Getting started wiki page
- Examples produced by
example(data.table)
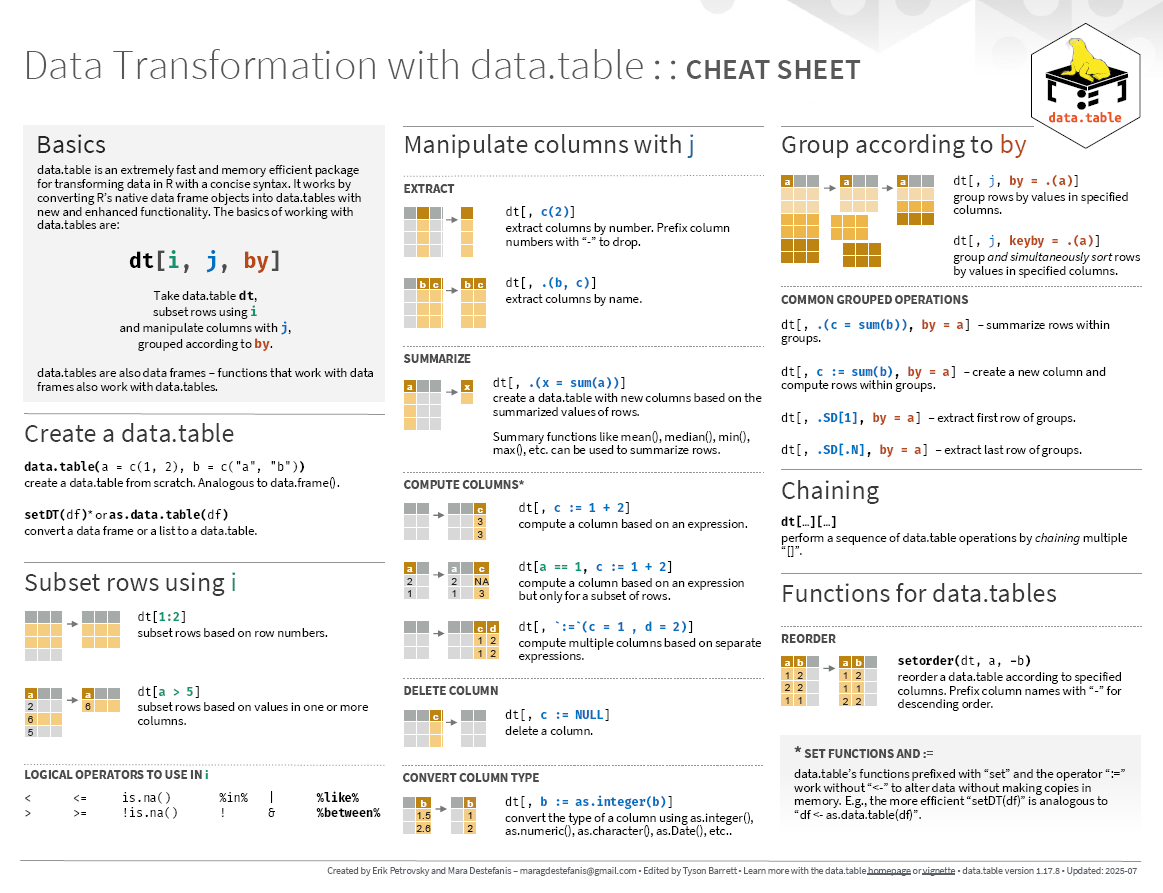
Cheatsheets
Community
data.table is widely used by the R community. It is being directly used by hundreds of CRAN and Bioconductor packages, and indirectly by thousands. It is one of the top most starred R packages on GitHub, and was highly rated by the Depsy project. If you need help, the data.table community is active on StackOverflow.
A list of packages that significantly support, extend, or make use of data.table can be found in the Seal of Approval document.
Stay up-to-date
- click the Watch button at the top and right of GitHub project page
- read NEWS file
- follow #rdatatable and the r_data_table account on X/Twitter
- follow #rdatatable and the r_data_table account on fosstodon
- follow the data.table community page on LinkedIn
- watch recent Presentations
- read recent Articles
- read posts on The Raft
Contributing
Guidelines for filing issues / pull requests: Contribution Guidelines.
Top Related Projects
dplyr: A grammar of data manipulation
Flexible and powerful data analysis / manipulation library for Python, providing labeled data structures similar to R data.frame objects, statistical functions, and much more
Apache Spark - A unified analytics engine for large-scale data processing
A Python package for manipulating 2-dimensional tabular data structures
DuckDB is an analytical in-process SQL database management system
In-memory tabular data in Julia
Convert designs to code with AI
Introducing Visual Copilot: A new AI model to turn Figma designs to high quality code using your components.
Try Visual Copilot