 butterfly
🦋Butterfly,A JavaScript/React/Vue2 Diagramming library which concentrate on flow layout field. (基于JavaScript/React/Vue2的流程图组件)
Top Related Projects
🚀 JavaScript diagramming library that uses SVG and HTML for rendering.
mxGraph is a fully client side JavaScript diagramming library
Visual connectivity for webapps
a super simple, no-nonsense diagramming library written in react that just works
Directed graph layout for JavaScript
Graph theory (network) library for visualisation and analysis
Quick Overview
Butterfly is a JavaScript/React-based diagramming library that focuses on flow and topology charts. It provides a highly customizable and interactive canvas for creating node-based diagrams, with features like edge bundling, minimap, and group nodes.
Pros
- Highly customizable with a rich set of options for nodes, edges, and canvas
- Supports both Canvas and SVG rendering for optimal performance
- Includes advanced features like edge bundling and group nodes
- Provides a React wrapper for easy integration with React applications
Cons
- Documentation is primarily in Chinese, which may be challenging for non-Chinese speakers
- Learning curve can be steep due to the extensive API and configuration options
- Limited built-in layouts compared to some other diagramming libraries
- Relatively smaller community compared to more established diagramming libraries
Code Examples
Creating a basic canvas:
import { Canvas } from 'butterfly-dag';

const canvas = new Canvas({
  root: document.getElementById('canvas'),
  width: 1000,
  height: 500
});
Adding nodes and edges:
const node1 = {
  id: 'node1',
  top: 100,
  left: 100,
  Class: Node,
  label: 'Node 1'
};

const node2 = {
  id: 'node2',
  top: 200,
  left: 200,
  Class: Node,
  label: 'Node 2'
};

const edge = {
  source: 'node1',
  target: 'node2',
  type: 'endpoint',
  arrow: true,
  label: 'Connection'
};

canvas.add(node1);
canvas.add(node2);
canvas.addEdge(edge);
Using the React wrapper:
import { Canvas } from 'butterfly-react';

function DiagramComponent() {
  return (
    <Canvas
      className="my-canvas"
      nodes={nodes}
      edges={edges}
      onLoaded={(canvas) => {
        console.log('Canvas loaded:', canvas);
      }}
    />
  );
}
Getting Started
-
Install the library:
npm install butterfly-dag -
Create a container element in your HTML:
<div id="canvas"></div> -
Initialize the canvas in your JavaScript:
import { Canvas } from 'butterfly-dag'; const canvas = new Canvas({ root: document.getElementById('canvas'), width: 1000, height: 500 }); // Add nodes and edges as needed canvas.draw(); -
Customize nodes, edges, and canvas properties as required using the Butterfly API.
Competitor Comparisons
🚀 JavaScript diagramming library that uses SVG and HTML for rendering.
Pros of X6
- More comprehensive documentation and examples
- Wider range of graph types and customization options
- Active development with frequent updates
Cons of X6
- Steeper learning curve due to more complex API
- Larger bundle size, which may impact performance
Code Comparison
X6:
import { Graph } from '@antv/x6';

const graph = new Graph({
  container: document.getElementById('container'),
  width: 800,
  height: 600,
});

graph.addNode({
  x: 100,
  y: 100,
  width: 80,
  height: 40,
  label: 'Hello',
});
Butterfly:
import { Canvas } from 'butterfly-dag';

const canvas = new Canvas({
  root: document.getElementById('container'),
  width: 800,
  height: 600,
});

canvas.addNode({
  id: 'node1',
  top: 100,
  left: 100,
  Class: Node,
  label: 'Hello',
});
Both libraries offer similar functionality for creating graph-based visualizations, but X6 provides more advanced features and customization options. Butterfly, on the other hand, has a simpler API and may be easier to get started with for basic use cases. The choice between the two depends on the specific requirements of your project and the level of complexity you need in your graph visualizations.
mxGraph is a fully client side JavaScript diagramming library
Pros of mxgraph
- More mature and widely adopted, with a larger community and extensive documentation
- Supports a broader range of diagram types and use cases
- Offers both client-side and server-side rendering options
Cons of mxgraph
- Steeper learning curve due to its comprehensive feature set
- Larger file size and potentially higher performance overhead
- Less modern API design compared to newer libraries
Code Comparison
mxgraph:
var graph = new mxGraph(container);
var parent = graph.getDefaultParent();
graph.getModel().beginUpdate();
try {
  var v1 = graph.insertVertex(parent, null, 'Hello,', 20, 20, 80, 30);
  var v2 = graph.insertVertex(parent, null, 'World!', 200, 150, 80, 30);
  var e1 = graph.insertEdge(parent, null, '', v1, v2);
} finally {
  graph.getModel().endUpdate();
}
Butterfly:
const canvas = new Canvas({
  root: document.getElementById('root'),
  disLinkable: true,
  linkable: true
});
canvas.draw({
  nodes: [{id: 'node1', x: 20, y: 20, label: 'Hello,'}, {id: 'node2', x: 200, y: 150, label: 'World!'}],
  edges: [{source: 'node1', target: 'node2'}]
});
Both libraries provide powerful diagramming capabilities, but mxgraph offers more flexibility and features at the cost of complexity, while Butterfly focuses on simplicity and ease of use for basic diagrams.
Visual connectivity for webapps
Pros of jsPlumb
- More mature and established project with a larger community and extensive documentation
- Supports multiple rendering modes (SVG, Canvas, VML) for better cross-browser compatibility
- Offers a commercial version with additional features and support
Cons of jsPlumb
- Steeper learning curve due to its extensive API and configuration options
- Less focus on performance optimization for large-scale diagrams
- Limited built-in layout algorithms compared to Butterfly
Code Comparison
jsPlumb:
jsPlumb.ready(function() {
  var instance = jsPlumb.getInstance();
  instance.connect({
    source: "element1",
    target: "element2",
    anchor: ["Top", "Bottom"]
  });
});
Butterfly:
const canvas = new Canvas({
  root: document.getElementById('root')
});
canvas.draw({
  nodes: [{ id: 'node1' }, { id: 'node2' }],
  edges: [{ source: 'node1', target: 'node2' }]
});
Both libraries allow for creating connections between elements, but jsPlumb uses a more imperative approach, while Butterfly employs a declarative style with a single draw method. jsPlumb offers more granular control over individual connections, whereas Butterfly focuses on rendering entire diagrams with a simpler API.
a super simple, no-nonsense diagramming library written in react that just works
Pros of react-diagrams
- More focused on React integration, making it easier to use in React-based projects
- Offers a more customizable and extensible architecture
- Has a larger and more active community, resulting in more frequent updates and better support
Cons of react-diagrams
- Steeper learning curve due to its more complex architecture
- Less out-of-the-box functionality compared to Butterfly
- May require more setup and configuration for basic use cases
Code Comparison
Butterfly:
import { Canvas } from 'butterfly-dag';

const canvas = new Canvas({
  root: document.getElementById('root'),
  disLinkable: true,
  linkable: true
});
react-diagrams:
import createEngine, { DiagramModel } from '@projectstorm/react-diagrams';

const engine = createEngine();
const model = new DiagramModel();
engine.setModel(model);
Both libraries provide ways to create and manage diagrams, but react-diagrams is more tightly integrated with React components and state management. Butterfly offers a more straightforward API for basic diagram creation, while react-diagrams provides greater flexibility and customization options at the cost of increased complexity.
Directed graph layout for JavaScript
Pros of dagre
- Lightweight and focused on graph layout algorithms
- Well-established with a longer history and more widespread adoption
- Easier integration with other JavaScript libraries
Cons of dagre
- Limited built-in UI components and interactions
- Less comprehensive documentation and examples
- Fewer out-of-the-box features for complex diagram scenarios
Code Comparison
dagre:
var g = new dagre.graphlib.Graph();
g.setNode("kspacey", { label: "Kevin Spacey", width: 144, height: 100 });
g.setNode("swilliams", { label: "Saul Williams", width: 160, height: 100 });
g.setEdge("kspacey", "swilliams");
Butterfly:
const canvas = new Canvas({
  root: document.getElementById('root'),
  disLinkable: true,
  linkable: true,
  draggable: true,
  zoomable: true,
  moveable: true,
  theme: {
    edge: {
      type: 'Straight',
    }
  }
});
Key Differences
- Butterfly offers a more comprehensive solution with built-in UI components and interactions
- dagre focuses primarily on graph layout algorithms, while Butterfly provides a full-featured diagramming toolkit
- Butterfly has better support for complex diagram scenarios and customization options
- dagre is more suitable for developers who need fine-grained control over graph layouts in their applications
Graph theory (network) library for visualisation and analysis
Pros of Cytoscape.js
- More mature and widely adopted project with a larger community
- Extensive documentation and examples
- Supports a wider range of graph visualization types and layouts
Cons of Cytoscape.js
- Steeper learning curve for beginners
- Less focus on specific business-oriented diagrams
- Requires more custom code for advanced interactions
Code Comparison
Butterfly:
const canvas = new Canvas({
  root: document.getElementById('root'),
  disLinkable: true,
  linkable: true
});

canvas.draw({
  nodes: [...],
  edges: [...]
});
Cytoscape.js:
const cy = cytoscape({
  container: document.getElementById('cy'),
  elements: {
    nodes: [...],
    edges: [...]
  },
  style: [...],
  layout: {...}
});
Both libraries allow for creating graph visualizations, but Butterfly focuses more on drag-and-drop interactions and business diagrams, while Cytoscape.js offers more flexibility for various graph types and scientific visualizations. Butterfly provides a simpler API for basic use cases, while Cytoscape.js offers more advanced features and customization options at the cost of increased complexity.
Convert  designs to code with AI

Introducing Visual Copilot: A new AI model to turn Figma designs to high quality code using your components.
Try Visual CopilotREADME
ä¸ä¸ªåºäºJSçæ°æ®é©±å¨çèç¹å¼ç¼æç»ä»¶åº
English | ç®ä½ä¸æ
⨠ç¹æ§
- 丰å¯DEMOï¼å¼ç®±å³ç¨
- å ¨æ¹ä½ç®¡çç»å¸ï¼å¼åè åªéè¦æ´ä¸æ³¨å®å¶åçéæ±
- å©ç¨DOM/REACT/VUEæ¥å®å¶å ç´ ï¼çµæ´»æ§ï¼å¯å¡æ§ï¼æå±æ§ä¼ç§

ðDEMO
æ¬å°DEMO
git clone git@github.com:alibaba/butterfly.git
npm install
cd example
npm install
npm start
线ä¸DEMO
ð¦ å®è£
npm install butterfly-dag
ð¨ å¿«éä¸æ
å¼å ¥æ¹å¼
// å®å
¨çï¼å
é¨å
å«jqueryålodash
import {Canvas, Group, Node, Edge} from 'butterfly-dag';
import 'butterfly-dag/dist/index.css';
// å¦ææ¨å¼ç¨ç项ç®ä½¿ç¨äºjqueryålodashï¼ä¸ºäºç¼©å°é¡¹ç®çä½ç§¯ï¼æ们建议ï¼
import {Canvas, Group, Node, Edge} from 'butterfly-dag/pack/index.js';
import 'butterfly-dag/pack/index.css';
çæç»å¸
import {Canvas} from 'butterfly-dag';
let canvas = new Canvas({
root: dom, //canvasçæ ¹èç¹(å¿
ä¼ )
zoomable: true, //å¯ç¼©æ¾(å¯ä¼ )
moveable: true, //å¯å¹³ç§»(å¯ä¼ )
draggable: true, //èç¹å¯æå¨(å¯ä¼ )
});
canvas.draw({
groups: [], //åç»ä¿¡æ¯
nodes: [], //èç¹ä¿¡æ¯
edges: [] // è¿çº¿ä¿¡æ¯
})
ð APIææ¡£
- !!! 3.xçAPIææ¡£ï¼è¯·ç§»æ¥å°è¿é;
- ç»å¸(Canvas)
- èç¹ç»(Group)
- èç¹(Node)
- 线(Edge)
- éç¹(Endpoint)
- 缩ç¥å¾(Minimap)
- æ示 & èå(tooltips & menu)
- å¸å±(Layout)
- æ件
- React & Vueæ¯æ
- React butterflyç»ä»¶æ¯æ [ä¸ç»´æ¤ï¼æ¨èç¨åçå°è´è¶]
- Vue2 butterflyç»ä»¶æ¯æ
ð¨ä¼ç§æ¡ä¾

â¨ï¸åç´ä¸å¡Reactæå±ç»ä»¶
- æ°æ®/å段æ å°ç»ä»¶: éç¨äºåæ°æ®å段æ å°ï¼è¡¨å段æ å°ï¼è¡¨æ ¼è¿çº¿çä¸å¡

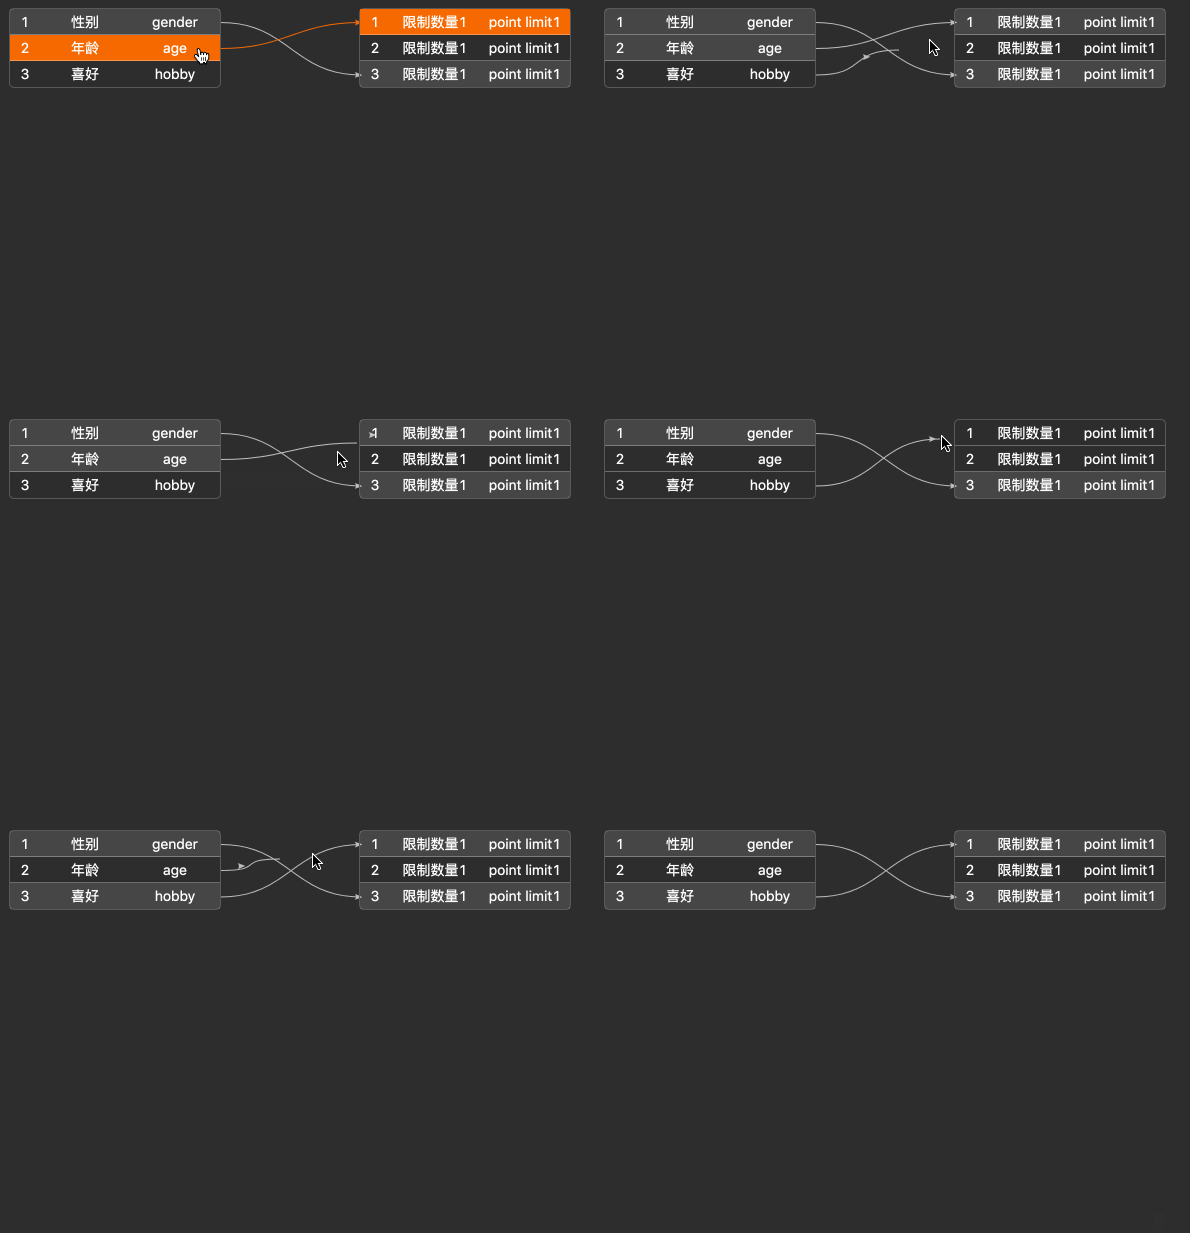
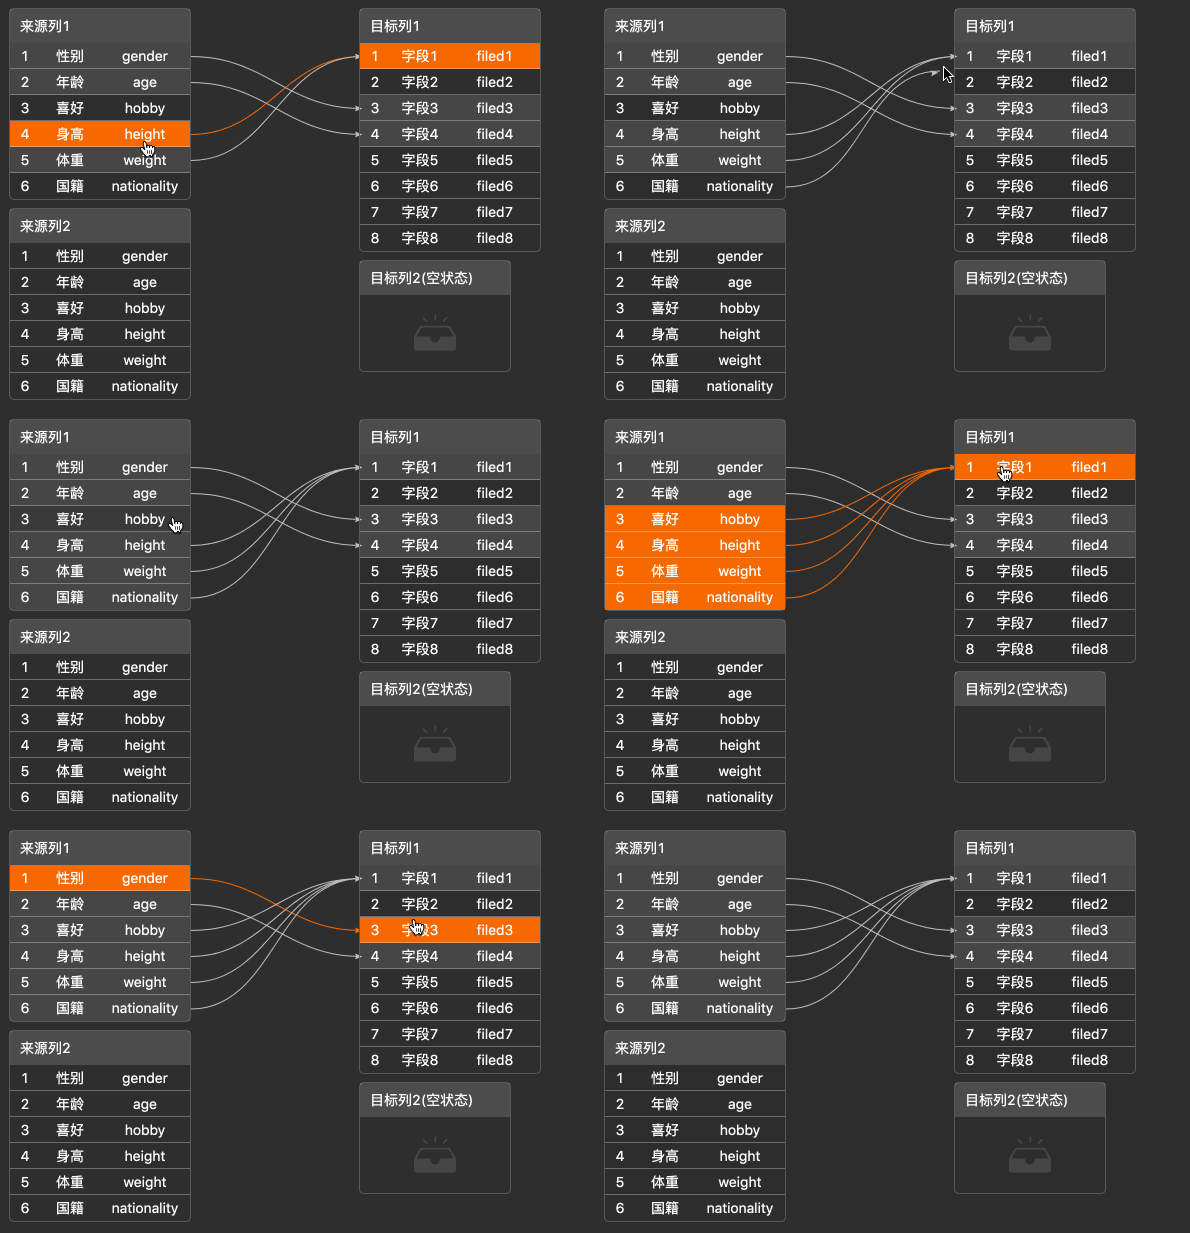
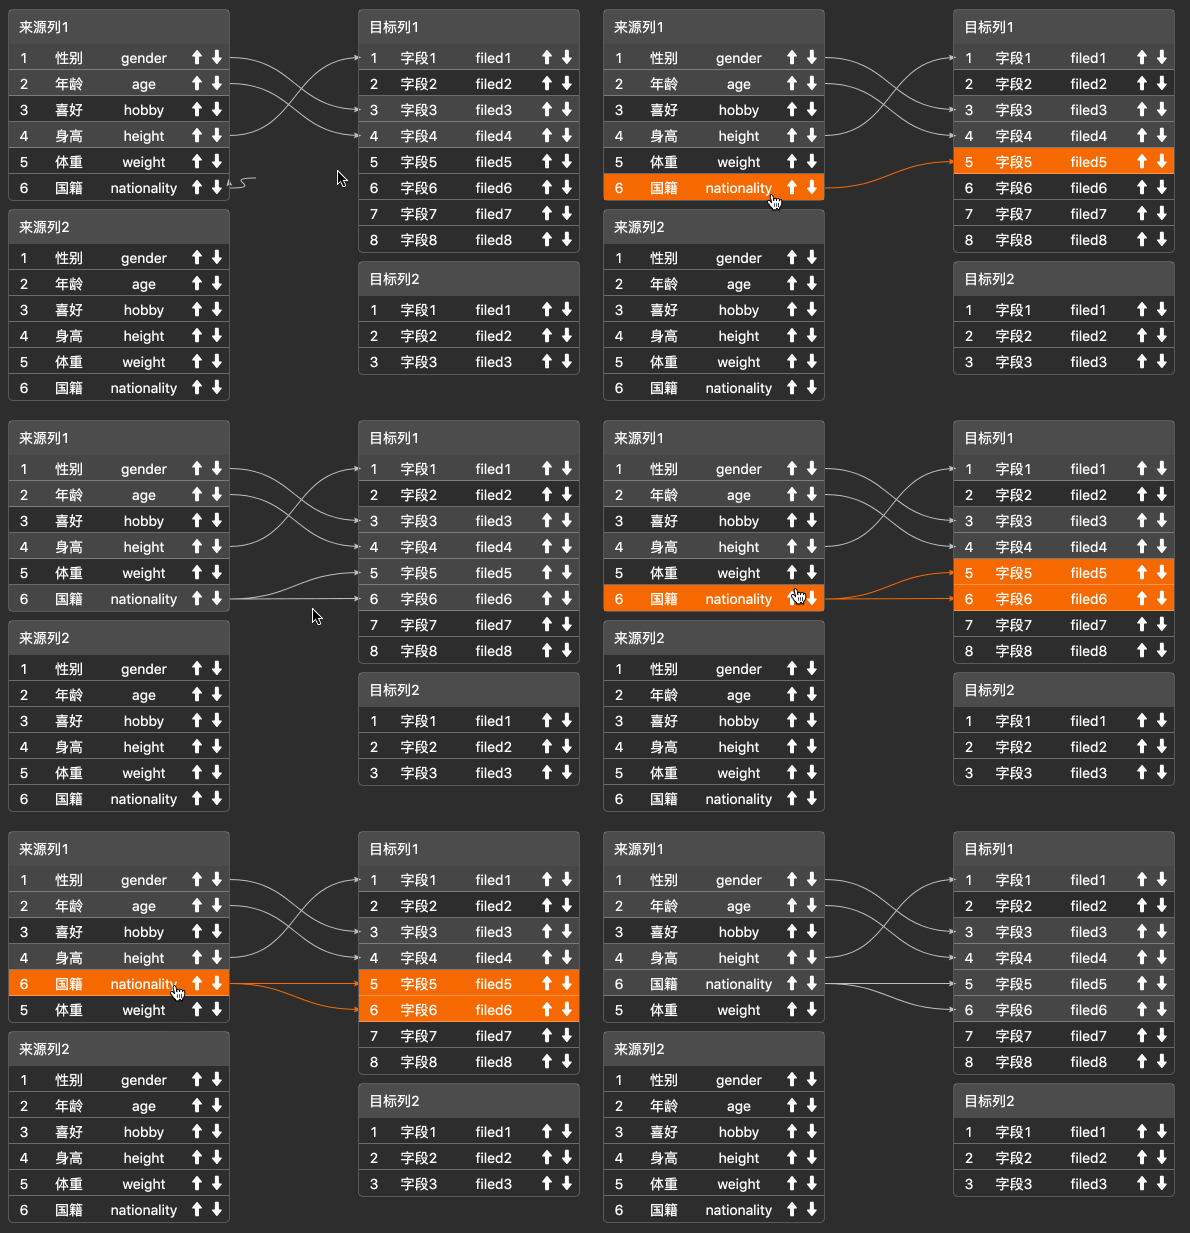
-
表å段è¡ç¼/ä¸å¡è¡ç¼: éç¨äºè¡¨çº§è¡ç¼,表å段级è¡ç¼,ä¸å¡é¾è·¯è¡ç¼çä¸å¡
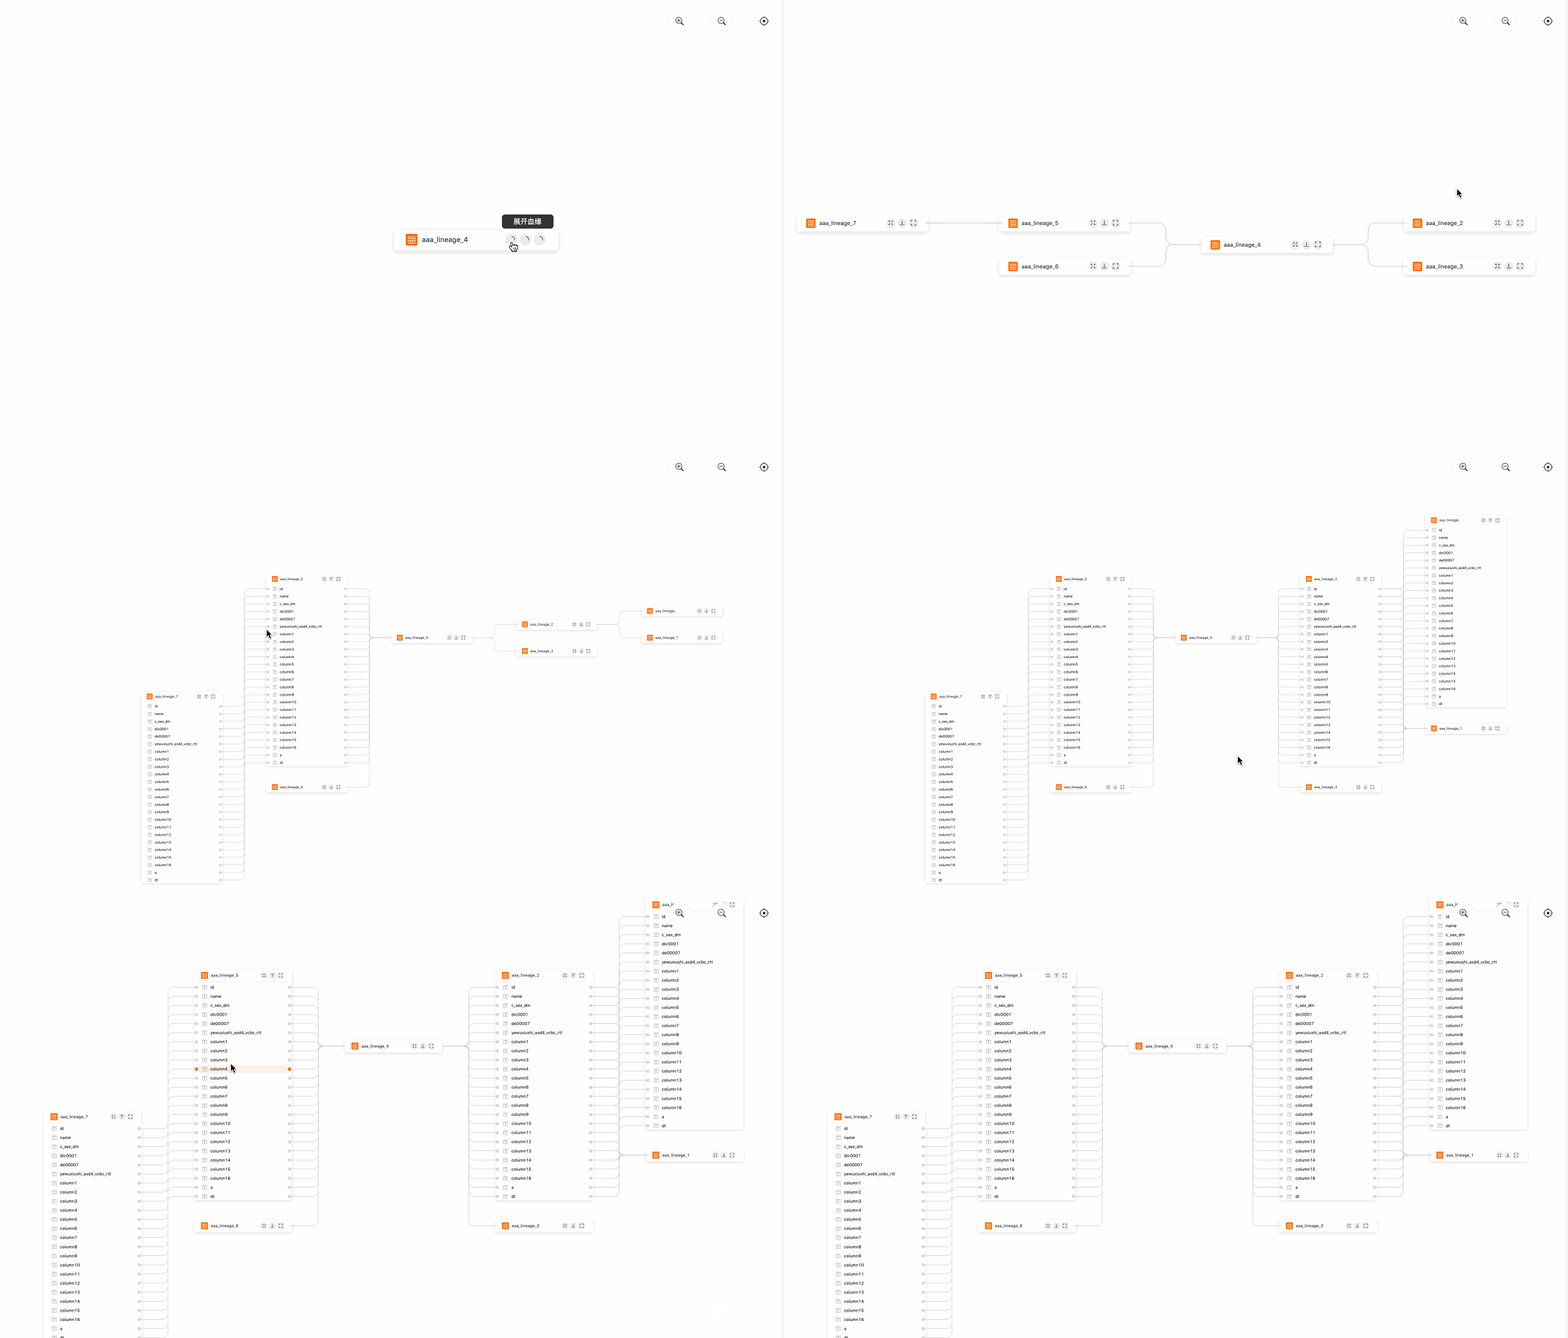
-
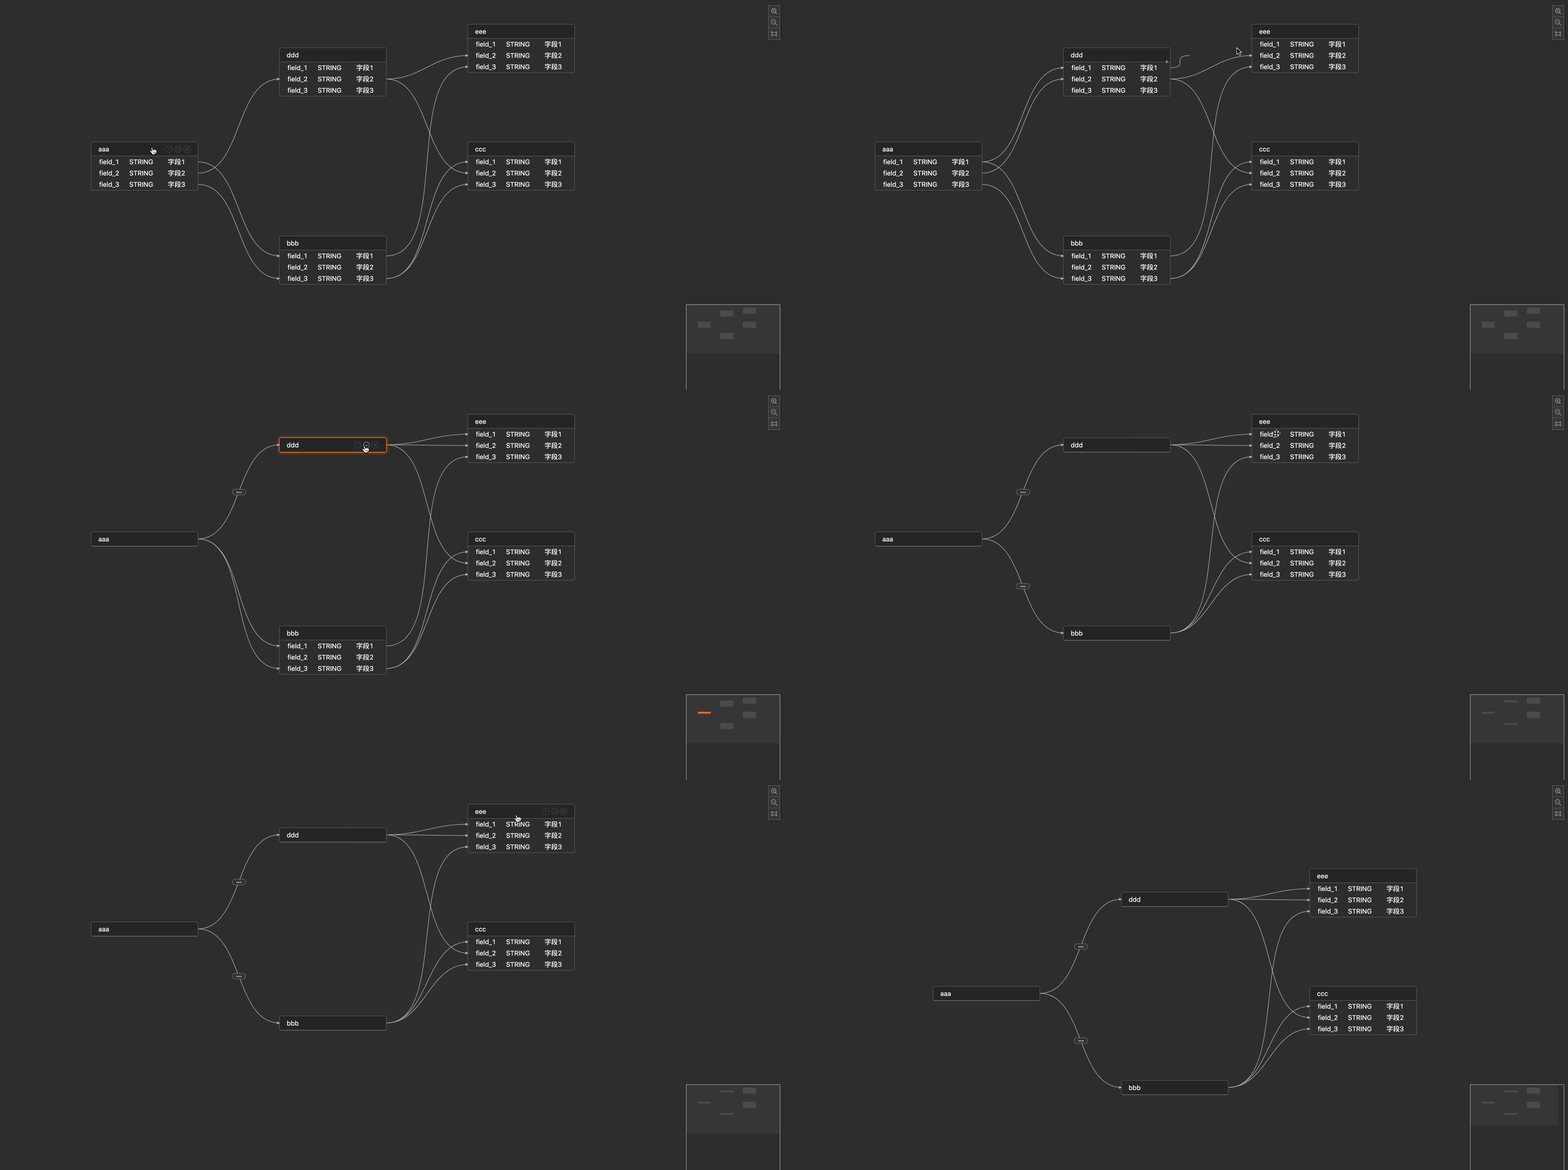
å¯è§å建模å¾: éç¨äºUMLï¼æ°æ®åºå»ºæ¨¡ï¼æ°æ®ä»åºå»ºè®¾çä¸å¡
-
è°åº¦ç¼æå¾(doing)
-
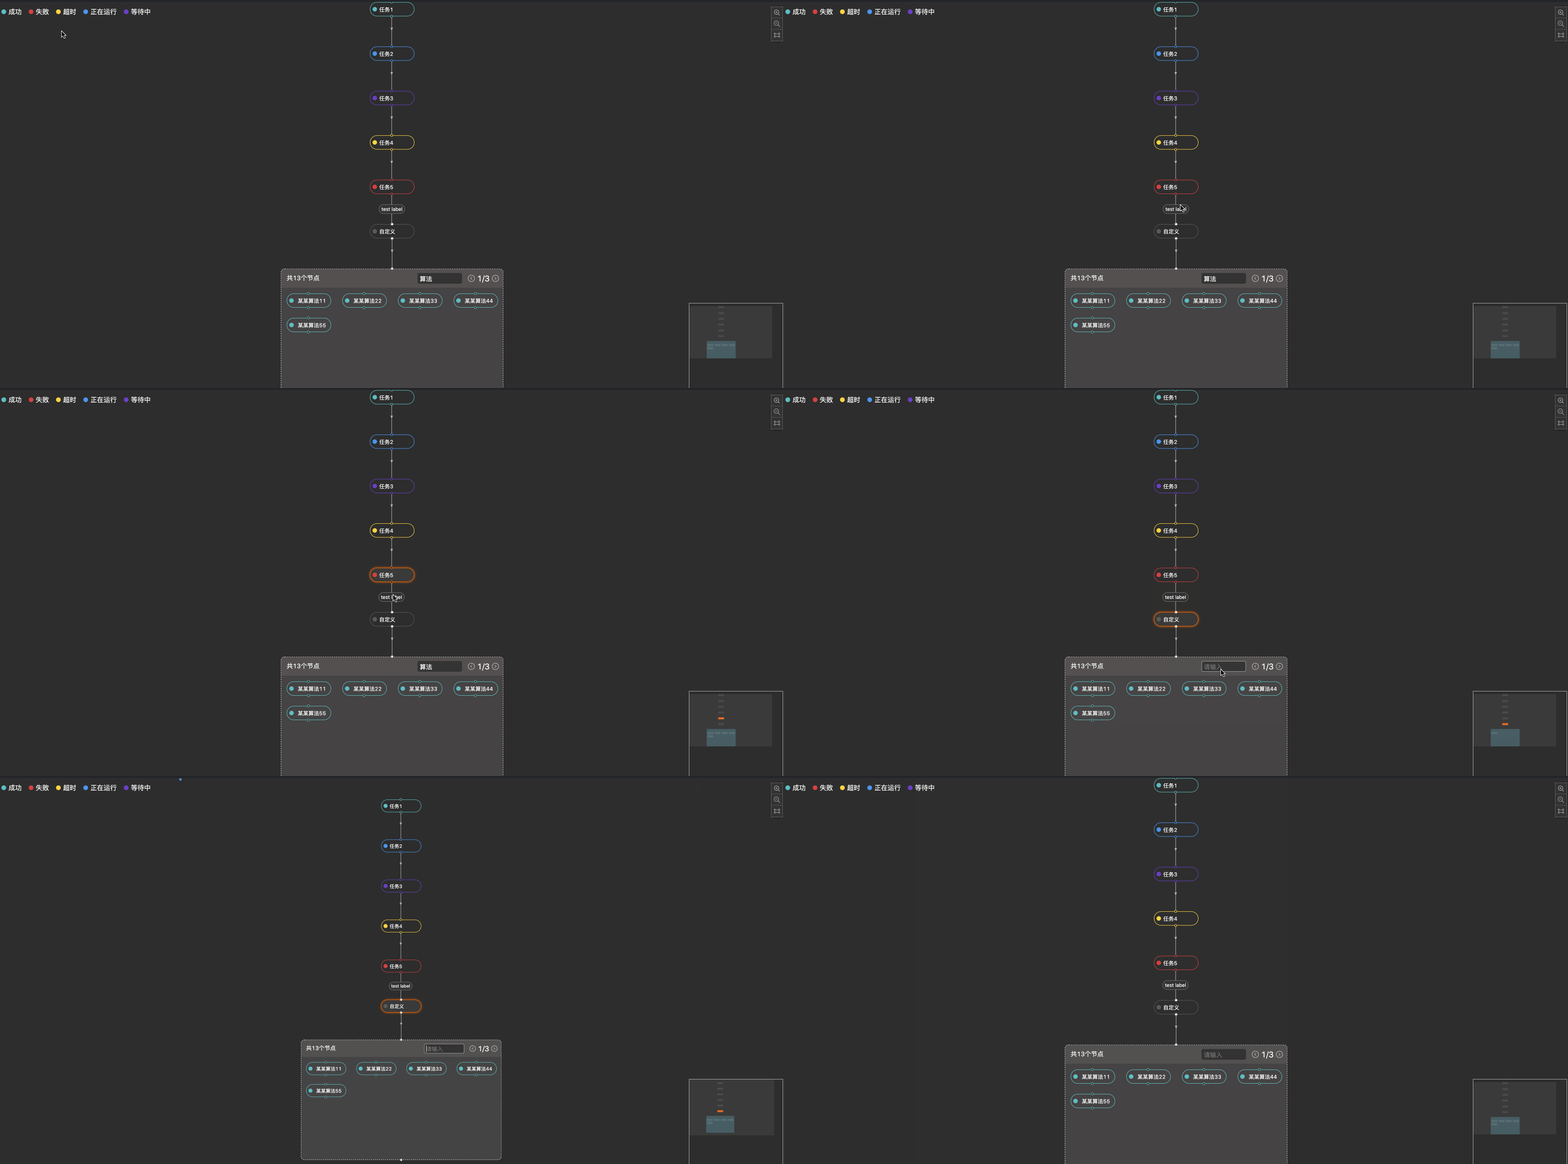
çæ§å¾: éç¨äºä»»å¡æµï¼æ°æ®æµçä¸å¡çç¶æå±ç¤º
-
Butterfly-Editor(doing)
ð¤å¦ä½è´¡ç®
æ们欢è¿ææçè´¡ç®è ï¼å¨æ为贡ç®è ä¹åï¼è¯·å é 读贡ç®æåã
å¦ææ¨å·²ç»äºè§£ï¼å¿«æ¥IssusæPull requestsæ为贡ç®è å§ï¼è®©æ们åå°è´è¶ä¸èµ·æé¿ï¼ä¸èµ·åå¾æ´å¥½ãæ´æ£ï¼
Top Related Projects
🚀 JavaScript diagramming library that uses SVG and HTML for rendering.
mxGraph is a fully client side JavaScript diagramming library
Visual connectivity for webapps
a super simple, no-nonsense diagramming library written in react that just works
Directed graph layout for JavaScript
Graph theory (network) library for visualisation and analysis
Convert  designs to code with AI

Introducing Visual Copilot: A new AI model to turn Figma designs to high quality code using your components.
Try Visual Copilot


