
Top Related Projects

A visual graph editor based on G6 and React

Graph theory (network) library for visualisation and analysis

Directed graph layout for JavaScript

:dizzy: Display dynamic, automatically organised, customizable network views.
⚠️ This project is not maintained anymore! Please go to https://github.com/visjs

Force-directed graph layout using velocity Verlet integration.
Quick Overview
G6 is a graph visualization engine for JavaScript, providing developers with powerful tools to create interactive and customizable graph visualizations. It offers a wide range of graph types, layouts, and interactions, making it suitable for various applications such as data analysis, network visualization, and knowledge graphs.
Pros
- Extensive graph visualization capabilities with support for various graph types and layouts
- High performance and efficient rendering, even for large-scale graphs
- Rich set of built-in interactions and customization options
- Active development and community support
Cons
- Steep learning curve for advanced features and customizations
- Documentation can be inconsistent or outdated in some areas
- Limited built-in support for certain specialized graph types
Code Examples
- Creating a basic graph:
import G6 from '@antv/g6';

const data = {
  nodes: [
    { id: 'node1', label: 'Node 1' },
    { id: 'node2', label: 'Node 2' },
  ],
  edges: [
    { source: 'node1', target: 'node2' },
  ],
};

const graph = new G6.Graph({
  container: 'mountNode',
  width: 800,
  height: 600,
});

graph.data(data);
graph.render();
- Applying a custom layout:
import G6 from '@antv/g6';

const graph = new G6.Graph({
  container: 'mountNode',
  width: 800,
  height: 600,
  layout: {
    type: 'force',
    preventOverlap: true,
    nodeStrength: -30,
    edgeStrength: 0.1,
  },
});
- Adding custom node shapes:
import G6 from '@antv/g6';

G6.registerNode('custom-node', {
  draw(cfg, group) {
    const shape = group.addShape('rect', {
      attrs: {
        x: -30,
        y: -15,
        width: 60,
        height: 30,
        radius: 5,
        fill: '#1890FF',
        stroke: '#0050B3',
      },
    });
    return shape;
  },
});

const graph = new G6.Graph({
  // ... other configurations
  defaultNode: {
    type: 'custom-node',
  },
});
Getting Started
To get started with G6, follow these steps:
-
Install G6 using npm:
npm install @antv/g6 -
Import G6 in your project:
import G6 from '@antv/g6'; -
Create a container element in your HTML:
<div id="mountNode"></div> -
Initialize a graph instance and render your data:
const graph = new G6.Graph({
  container: 'mountNode',
  width: 800,
  height: 600,
});

const data = {
  nodes: [
    { id: 'node1', label: 'Node 1' },
    { id: 'node2', label: 'Node 2' },
  ],
  edges: [
    { source: 'node1', target: 'node2' },
  ],
};

graph.data(data);
graph.render();
This will create a basic graph visualization. From here, you can explore more advanced features and customizations provided by G6.
Competitor Comparisons
A visual graph editor based on G6 and React
Pros of GGEditor
- Provides a higher-level abstraction for graph editing, with built-in support for flow charts and mind maps
- Offers a more comprehensive set of editing tools and interactions out of the box
- Integrates well with React, making it easier to use in React-based applications
Cons of GGEditor
- Less flexible and customizable compared to G6's lower-level API
- Smaller community and fewer updates, potentially leading to less support and fewer features
- More opinionated design, which may not suit all use cases
Code Comparison
G6 (lower-level graph rendering):
const graph = new G6.Graph({
  container: 'mountNode',
  width: 800,
  height: 600,
});
graph.data(data);
graph.render();
GGEditor (higher-level graph editing):
<GGEditor>
  <Flow data={data} />
  <EditableLabel />
  <ContextMenu />
  <Toolbar />
</GGEditor>
G6 provides a more flexible, lower-level API for graph rendering and manipulation, while GGEditor offers a higher-level, more opinionated approach with built-in editing components. G6 is better suited for custom graph visualizations, while GGEditor is more appropriate for quickly implementing editable diagrams with predefined functionality.
Graph theory (network) library for visualisation and analysis
Pros of Cytoscape.js
- More extensive documentation and examples
- Larger community and ecosystem of plugins
- Better support for complex graph analysis algorithms
Cons of Cytoscape.js
- Steeper learning curve for beginners
- Less focus on performance optimization for large-scale graphs
- More complex API for basic graph operations
Code Comparison
G6 example:
const graph = new G6.Graph({
  container: 'mountNode',
  width: 800,
  height: 600,
});
graph.data(data);
graph.render();
Cytoscape.js example:
const cy = cytoscape({
  container: document.getElementById('cy'),
  elements: data,
  style: [ /* ... */ ],
  layout: { name: 'grid' }
});
Both libraries offer similar basic functionality for creating and rendering graphs. G6 provides a more straightforward API for simple use cases, while Cytoscape.js offers more flexibility and options out of the box. G6 focuses on performance and customization for large-scale graphs, whereas Cytoscape.js excels in providing a comprehensive set of graph analysis tools and algorithms.
Directed graph layout for JavaScript
Pros of dagre
- Specialized in directed graph layout algorithms
- Lightweight and focused on graph layout computation
- Easier integration with other visualization libraries
Cons of dagre
- Limited built-in rendering capabilities
- Less comprehensive documentation and examples
- Smaller community and fewer updates
Code Comparison
dagre:
var g = new dagre.graphlib.Graph();
g.setNode("a", { label: "A" });
g.setNode("b", { label: "B" });
g.setEdge("a", "b");
dagre.layout(g);
G6:
const graph = new G6.Graph({
  container: 'mountNode',
  width: 800,
  height: 600,
});
graph.data({
  nodes: [{ id: 'a', label: 'A' }, { id: 'b', label: 'B' }],
  edges: [{ source: 'a', target: 'b' }],
});
graph.render();
Summary
dagre is a specialized library for directed graph layout algorithms, offering lightweight and focused functionality. It's easier to integrate with other visualization libraries but lacks built-in rendering capabilities. G6, on the other hand, provides a more comprehensive graph visualization solution with built-in rendering and a wider range of features. G6 has better documentation and a larger community, making it more suitable for complex graph visualization projects. dagre might be preferred for simpler layout computations or when used in conjunction with other rendering libraries.
:dizzy: Display dynamic, automatically organised, customizable network views.
Pros of vis-network
- More mature and established project with a larger community
- Extensive documentation and examples
- Supports a wider range of graph visualization types
Cons of vis-network
- Heavier library size compared to G6
- Less focus on performance optimization for large datasets
- Limited customization options for advanced visualizations
Code Comparison
vis-network:
var nodes = new vis.DataSet([
  { id: 1, label: 'Node 1' },
  { id: 2, label: 'Node 2' }
]);
var edges = new vis.DataSet([
  { from: 1, to: 2 }
]);
var network = new vis.Network(container, { nodes, edges }, options);
G6:
const data = {
  nodes: [
    { id: 'node1', label: 'Node 1' },
    { id: 'node2', label: 'Node 2' }
  ],
  edges: [{ source: 'node1', target: 'node2' }]
};
const graph = new G6.Graph({
  container: 'mountNode',
  width: 800,
  height: 600
});
graph.data(data);
graph.render();
Both libraries offer similar functionality for creating basic network graphs, but G6 provides a more concise API and focuses on performance optimization. vis-network offers more built-in options and graph types out of the box, while G6 emphasizes customization and extensibility for complex visualizations.
⚠️ This project is not maintained anymore! Please go to https://github.com/visjs
Pros of vis
- More mature and established project with a longer history
- Broader scope, including timeline and graph visualization
- Larger community and more extensive documentation
Cons of vis
- Less frequent updates and slower development cycle
- Heavier library size, which may impact performance
- Less focus on graph-specific features and optimizations
Code Comparison
G6 example:
const graph = new G6.Graph({
  container: 'mountNode',
  width: 800,
  height: 600,
});
graph.data(data);
graph.render();
vis example:
const container = document.getElementById('mynetwork');
const data = {
  nodes: nodes,
  edges: edges
};
const network = new vis.Network(container, data, options);
Both libraries offer straightforward ways to create and render graphs, with G6 focusing more on graph-specific functionality and vis providing a broader range of visualization options. G6's API is more tailored for graph operations, while vis offers a more general-purpose approach to network visualization.
G6 excels in performance and graph-specific features, making it ideal for large-scale graph visualizations. vis, on the other hand, provides a wider range of visualization types, making it suitable for projects that require diverse visualization options beyond just graphs.
Force-directed graph layout using velocity Verlet integration.
Pros of d3-force
- More flexible and customizable for force-directed layouts
- Part of the larger D3 ecosystem, integrating well with other D3 modules
- Lightweight and focused specifically on force simulations
Cons of d3-force
- Steeper learning curve, especially for those new to D3
- Requires more manual setup and configuration for complex visualizations
- Less out-of-the-box functionality for graph visualization compared to G6
Code Comparison
d3-force:
const simulation = d3.forceSimulation(nodes)
  .force("link", d3.forceLink(links).id(d => d.id))
  .force("charge", d3.forceManyBody())
  .force("center", d3.forceCenter(width / 2, height / 2));
G6:
const graph = new G6.Graph({
  container: 'mountNode',
  width: 800,
  height: 600,
  layout: { type: 'force' }
});
graph.data(data);
graph.render();
Summary
d3-force offers more flexibility and integration with the D3 ecosystem but requires more setup. G6 provides a more comprehensive graph visualization solution with easier initial setup but may be less customizable for specific force-directed layouts.
Convert  designs to code with AI

Introducing Visual Copilot: A new AI model to turn Figma designs to high quality code using your components.
Try Visual CopilotREADME
![]() English | ç®ä½ä¸æ
English | ç®ä½ä¸æ
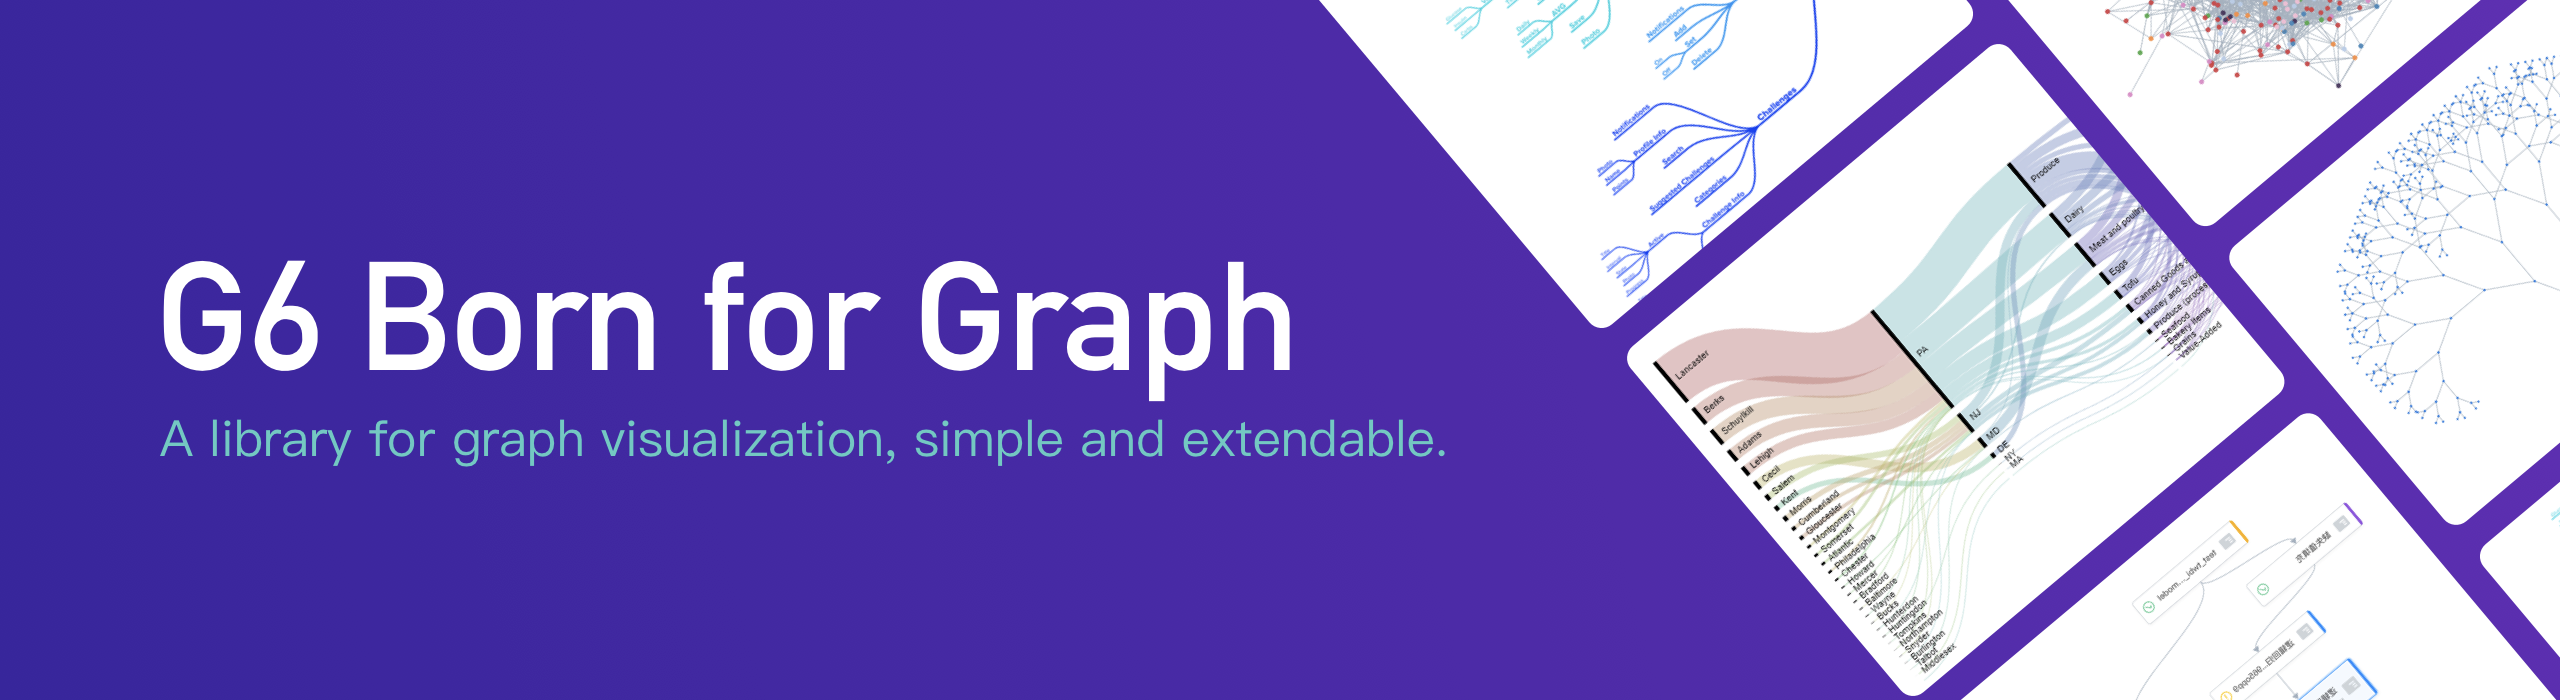
G6: A Graph Visualization Framework in TypeScript

![]()
![]()

![]()

Introduction ⢠Examples ⢠Quick Start ⢠API
G6 is a graph visualization engine. It provides basic capabilities for graph visualization and analysis such as drawing, layout, analysis, interaction, animation, themes, and plugins. With G6, users can quickly build their own graph visualization and analysis applications, making relational data simple, transparent, and meaningful.


⨠Features
G6, as a professional graph visualization engine, boasts the following features:
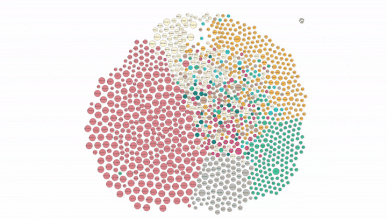
- Rich Elements: It comes with a variety of built-in node, edge, and Combo UI elements with extensive style configurations, supports data callbacks, and has a flexible mechanism for extending custom elements.
- Controllable Interactions: It includes more than 10 built-in interaction behaviors and offers a rich array of events, facilitating the expansion of custom interactive behaviors.
- High-Performance Layout: The engine features more than 10 common graph layouts, some of which leverage GPU and Rust parallel computing for enhanced performance, and it supports custom layout development.
- Convenient Plugins: Optimized built-in plugin functionality and performance, with flexible extensibility, making it easier to implement customized business capabilities.
- Multiple Theme and Palettes: Provides two sets of built-in themes, light and dark, that integrate over 20 popular community color palettes based on the AntV new color scheme.
- Multi-Environment Rendering: Harnessing the power of G, it supports rendering in Canvas, SVG, and WebGL, as well as server-side rendering with Node.js; it also offers plugin packages that provide powerful 3D rendering and spatial interactions based on WebGL.
- React Ecosystem: By utilizing the React front-end ecosystem, it supports React nodes, significantly enriching the presentational styles of G6 nodes.
ð¨ Getting Started
G6 is usually installed via a package manager such as npm or Yarn.
$ npm install @antv/g6
The Graph object then can be imported from G6.
<div id="container"></div>
import { Graph } from '@antv/g6';
// Get the Data.
const data = {
nodes: [
/* your nodes data */
],
edges: [
/* your edges data */
],
};
// Create the Graph instance.
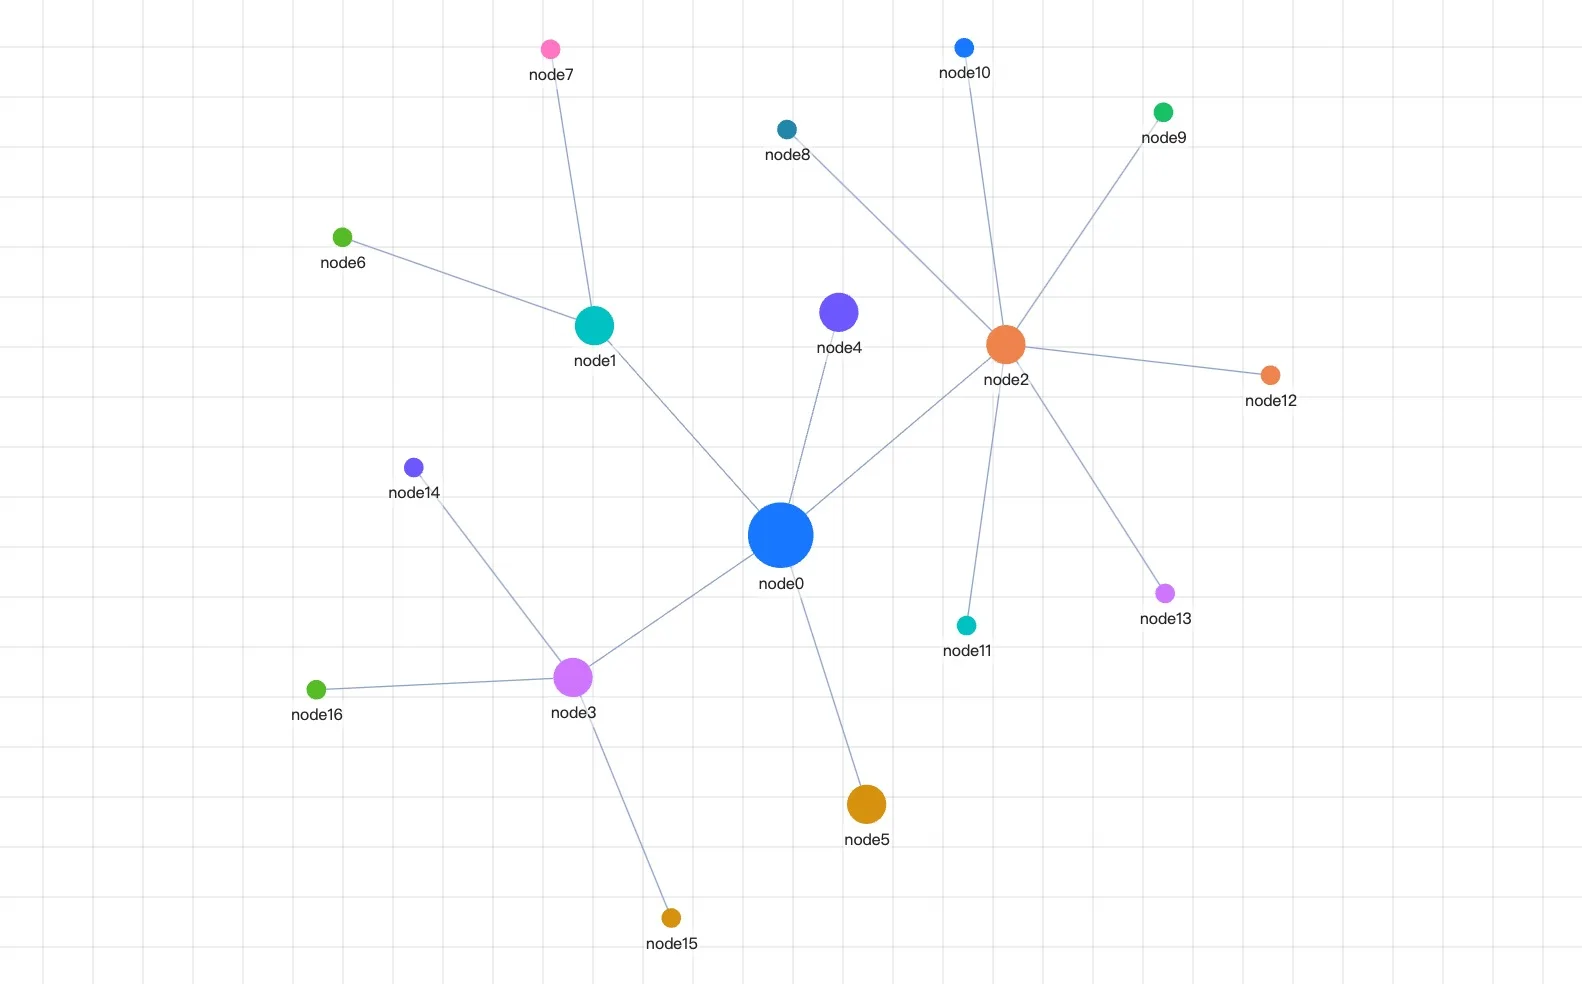
const graph = new Graph({
container: 'container',
data,
node: {
palette: {
type: 'group',
field: 'cluster',
},
},
layout: {
type: 'force',
},
behaviors: ['drag-canvas', 'drag-node'],
});
// Render the Graph.
graph.render();
All goes well, you can get the following lovely graph!
ð Ecosystem
- Ant Design Charts: A React chart library based on G2, G6, X6, L7.
- Graphin: A simple React wrapper based on G6, as well as an SDK for developing graph visualization applications.
For more ecosystem open-source projects, contributions are welcome. Please feel free to submit a PR for inclusion.
ð® Contributing
This project exists thanks to all the people who contribute.
And thank you to all our backers! ð
- Issue Reporting: If you encounter any issues with G6 during use, please feel free to submit an issue, along with the minimal sample code that can reproduce the problem.
- Contribution Guide: Information on how to get involved in the development and contribution to G6.
- Ideas Discussion: Discuss your ideas on GitHub Discussions or in the DingTalk group.

ð License
MIT.
Top Related Projects
A visual graph editor based on G6 and React
Graph theory (network) library for visualisation and analysis
Directed graph layout for JavaScript
:dizzy: Display dynamic, automatically organised, customizable network views.
⚠️ This project is not maintained anymore! Please go to https://github.com/visjs
Force-directed graph layout using velocity Verlet integration.
Convert designs to code with AI
Introducing Visual Copilot: A new AI model to turn Figma designs to high quality code using your components.
Try Visual Copilot