
Top Related Projects

AWS Service registry for resilient mid-tier load balancing and failover.

GitHub Action that uploads coverage to Codecov :open_umbrella:

The Prometheus monitoring system and time series database.

The open and composable observability and data visualization platform. Visualize metrics, logs, and traces from multiple sources like Prometheus, Loki, Elasticsearch, InfluxDB, Postgres and many more.

Your window into the Elastic Stack
Quick Overview
Spring Boot Admin is an open-source project that provides a web UI for managing and monitoring Spring Boot applications. It allows developers to monitor and manage multiple Spring Boot applications from a central dashboard, offering features like health checks, metrics visualization, and log file access.
Pros
- Centralized management of multiple Spring Boot applications
- Rich set of features for monitoring application health and performance
- Easy integration with Spring Boot applications
- Customizable UI and extensible architecture
Cons
- Requires additional setup and configuration
- May introduce security concerns if not properly secured
- Can add overhead to application performance
- Limited support for non-Spring Boot applications
Code Examples
- Adding Spring Boot Admin Client to your application:
@SpringBootApplication
@EnableAdminServer
public class AdminServerApplication {
    public static void main(String[] args) {
        SpringApplication.run(AdminServerApplication.class, args);
    }
}
- Configuring Spring Boot Admin Client in application.properties:
spring.boot.admin.client.url=http://localhost:8080
management.endpoints.web.exposure.include=*
- Customizing the Spring Boot Admin Server:
@Configuration
public class AdminServerConfig {
    @Bean
    public AdminServerProperties adminServerProperties() {
        return new AdminServerProperties();
    }

    @Bean
    public CustomNotifier customNotifier(AdminServerProperties adminServerProperties) {
        return new CustomNotifier(adminServerProperties);
    }
}
Getting Started
To get started with Spring Boot Admin, follow these steps:
-
Add the Spring Boot Admin Server dependency to your project:
<dependency> <groupId>de.codecentric</groupId> <artifactId>spring-boot-admin-starter-server</artifactId> <version>2.7.0</version> </dependency> -
Enable the Admin Server in your main application class:
@SpringBootApplication @EnableAdminServer public class AdminServerApplication { public static void main(String[] args) { SpringApplication.run(AdminServerApplication.class, args); } } -
Configure your Spring Boot applications as clients by adding the client dependency and configuring the server URL in
application.properties:spring.boot.admin.client.url=http://localhost:8080 management.endpoints.web.exposure.include=* -
Start your Admin Server and client applications, then access the Admin UI at
http://localhost:8080.
Competitor Comparisons
AWS Service registry for resilient mid-tier load balancing and failover.
Pros of Eureka
- More mature and battle-tested in large-scale production environments
- Provides advanced service discovery and load balancing features
- Supports multiple data centers and regions for high availability
Cons of Eureka
- Steeper learning curve and more complex setup
- Requires additional components like Ribbon for load balancing
- Less focus on UI and monitoring capabilities
Code Comparison
Spring Boot Admin:
@EnableAdminServer
@SpringBootApplication
public class SpringBootAdminApplication {
    public static void main(String[] args) {
        SpringApplication.run(SpringBootAdminApplication.class, args);
    }
}
Eureka:
@EnableEurekaServer
@SpringBootApplication
public class EurekaServerApplication {
    public static void main(String[] args) {
        SpringApplication.run(EurekaServerApplication.class, args);
    }
}
Key Differences
- Spring Boot Admin focuses on monitoring and management of Spring Boot applications
- Eureka primarily handles service discovery and registration
- Spring Boot Admin offers a rich UI for visualizing application health and metrics
- Eureka provides more robust service discovery features for microservices architectures
- Spring Boot Admin is easier to set up and use for basic monitoring needs
- Eureka is better suited for complex, distributed systems with multiple services
GitHub Action that uploads coverage to Codecov :open_umbrella:
Pros of codecov-action
- Focused on code coverage reporting and analysis
- Lightweight and easy to integrate into CI/CD pipelines
- Supports multiple programming languages and test frameworks
Cons of codecov-action
- Limited to code coverage functionality
- Requires external service (Codecov) for full feature set
- Less comprehensive monitoring capabilities for Spring Boot applications
Code Comparison
spring-boot-admin:
@Configuration
public class SecuritySecureConfig extends WebSecurityConfigurerAdapter {
    @Override
    protected void configure(HttpSecurity http) throws Exception {
        http.authorizeRequests()
            .anyRequest().authenticated()
            .and()
            .httpBasic();
    }
}
codecov-action:
- name: Upload coverage to Codecov
  uses: codecov/codecov-action@v3
  with:
    token: ${{ secrets.CODECOV_TOKEN }}
    files: ./coverage1.xml,./coverage2.xml
    flags: unittests
    name: codecov-umbrella
Summary
spring-boot-admin is a comprehensive monitoring and management solution for Spring Boot applications, offering a rich UI and extensive features. codecov-action, on the other hand, is a specialized GitHub Action focused on code coverage reporting and integration with Codecov. While spring-boot-admin provides broader application insights, codecov-action excels in its specific domain of code coverage analysis across various programming languages and CI/CD environments.
The Prometheus monitoring system and time series database.
Pros of Prometheus
- More comprehensive monitoring solution with a powerful query language (PromQL)
- Better scalability for large-scale distributed systems
- Extensive ecosystem with many exporters and integrations
Cons of Prometheus
- Steeper learning curve and more complex setup
- Requires additional components for alerting and visualization (e.g., Alertmanager, Grafana)
- Less focused on Spring Boot-specific features and metrics
Code Comparison
Spring Boot Admin:
@EnableAdminServer
@SpringBootApplication
public class SpringBootAdminApplication {
    public static void main(String[] args) {
        SpringApplication.run(SpringBootAdminApplication.class, args);
    }
}
Prometheus:
global:
  scrape_interval: 15s

scrape_configs:
  - job_name: 'spring-boot'
    metrics_path: '/actuator/prometheus'
    static_configs:
      - targets: ['localhost:8080']
Spring Boot Admin is specifically designed for Spring Boot applications, offering a user-friendly UI for monitoring and managing Spring Boot apps. It's easier to set up and provides out-of-the-box support for Spring Boot actuators.
Prometheus, on the other hand, is a more general-purpose monitoring system that can handle various types of applications and services. It offers more advanced features for querying and analyzing metrics but requires additional setup and configuration.
The open and composable observability and data visualization platform. Visualize metrics, logs, and traces from multiple sources like Prometheus, Loki, Elasticsearch, InfluxDB, Postgres and many more.
Pros of Grafana
- More versatile, supporting a wide range of data sources beyond just Spring Boot applications
- Offers advanced visualization options and customizable dashboards
- Has a larger community and ecosystem, with extensive plugin support
Cons of Grafana
- Steeper learning curve due to its broader scope and feature set
- Requires more setup and configuration for Spring Boot-specific monitoring
Code Comparison
Spring Boot Admin:
@EnableAdminServer
@SpringBootApplication
public class SpringBootAdminApplication {
    public static void main(String[] args) {
        SpringApplication.run(SpringBootAdminApplication.class, args);
    }
}
Grafana:
[server]
http_addr = 0.0.0.0
http_port = 3000

[security]
admin_user = admin
admin_password = admin
Spring Boot Admin is specifically designed for monitoring Spring Boot applications, offering a simpler setup and out-of-the-box functionality for Spring Boot metrics. It provides a clean, focused interface for Spring Boot application management.
Grafana, on the other hand, is a more general-purpose monitoring and visualization platform. It offers greater flexibility in terms of data sources and visualization options but requires more configuration for Spring Boot-specific monitoring.
The code examples show the simplicity of setting up Spring Boot Admin compared to the more detailed configuration options available in Grafana. Spring Boot Admin leverages Spring Boot's auto-configuration, while Grafana offers fine-grained control over various aspects of the monitoring setup.
Your window into the Elastic Stack
Pros of Kibana
- More comprehensive data visualization and analytics capabilities
- Supports a wider range of data sources and integrations
- Offers advanced features like machine learning and anomaly detection
Cons of Kibana
- Steeper learning curve and more complex setup
- Requires Elasticsearch as a backend, which can be resource-intensive
- May be overkill for simple application monitoring needs
Code Comparison
Spring Boot Admin:
@EnableAdminServer
@SpringBootApplication
public class SpringBootAdminApplication {
    public static void main(String[] args) {
        SpringApplication.run(SpringBootAdminApplication.class, args);
    }
}
Kibana:
server.name: kibana
server.host: "0"
elasticsearch.hosts: [ "http://elasticsearch:9200" ]
xpack.monitoring.ui.container.elasticsearch.enabled: true
Spring Boot Admin is a lightweight solution specifically designed for monitoring Spring Boot applications. It offers easy setup and integration with Spring Boot projects, making it ideal for developers already working within the Spring ecosystem.
Kibana, on the other hand, is a more powerful and versatile data visualization platform. It excels in handling large-scale data analytics and provides advanced features for log analysis, metrics monitoring, and security information and event management (SIEM).
While Spring Boot Admin is focused on application-level monitoring, Kibana offers a broader scope of functionality that extends beyond just application monitoring, making it suitable for complex data analysis and visualization needs across various domains.
Convert  designs to code with AI

Introducing Visual Copilot: A new AI model to turn Figma designs to high quality code using your components.
Try Visual CopilotREADME
Spring Boot Admin by codecentric
![]()
![]()
![]()
![]()

This community project provides an admin interface for Spring Boot ® web applications that expose actuator endpoints.
Monitoring Python applications is available using Pyctuator.
Compatibility Matrix
In the Spring Boot Admin Server App, the Spring Boot Admin's version matches the major and minor versions of Spring Boot.
| Spring Boot Version | Spring Boot Admin |
|---|---|
| 2.7 | 2.7.Y |
| 3.0 | 3.0.Y |
| ... | ... |
| 3.3 | 3.3.Y |
Nevertheless, it is possible to monitor any version of a Spring Boot service independently of the underlying Spring Boot version in the service. Hence, it is possible to run Spring Boot Admin Server version 2.6 and monitor a service that is running on Spring Boot 2.3 using Spring Boot Admin Client version 2.3.
Getting Started
A quick guide to get started can be found in our docs.
There are introductory talks available on YouTube:
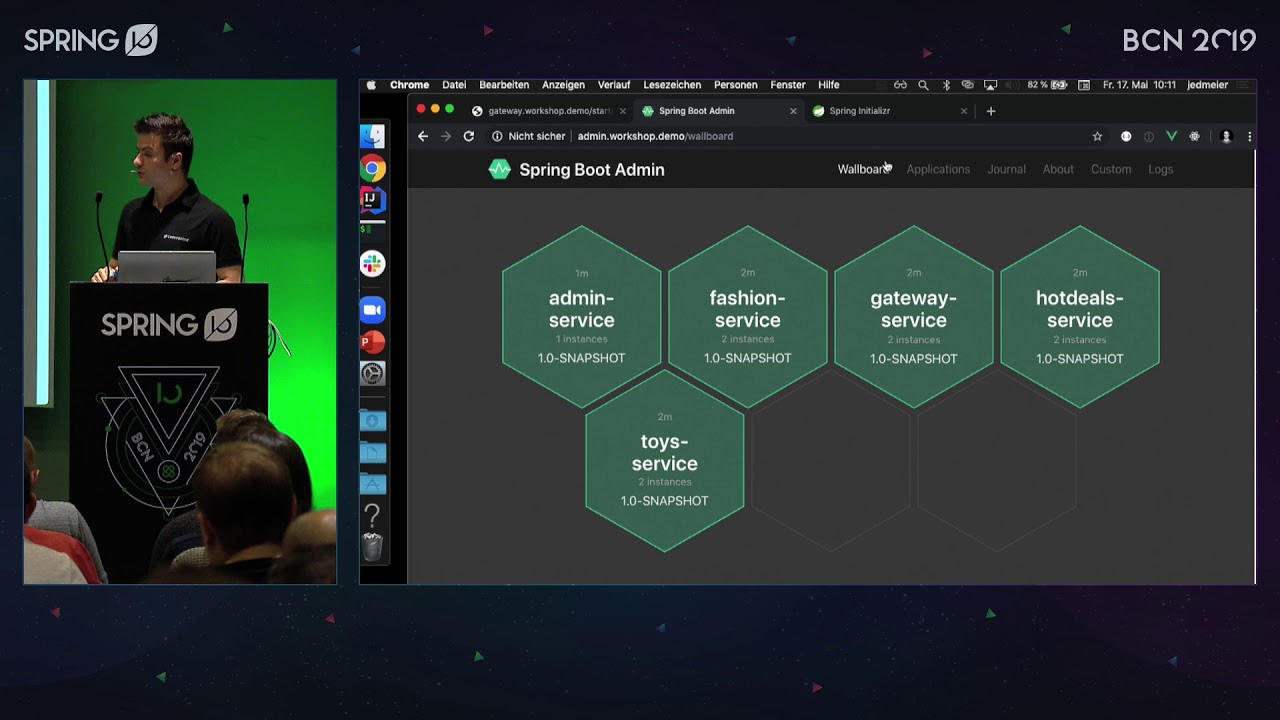
Cloud Native Spring Boot® Admin by Johannes Edmeier @ Spring I/O 2019
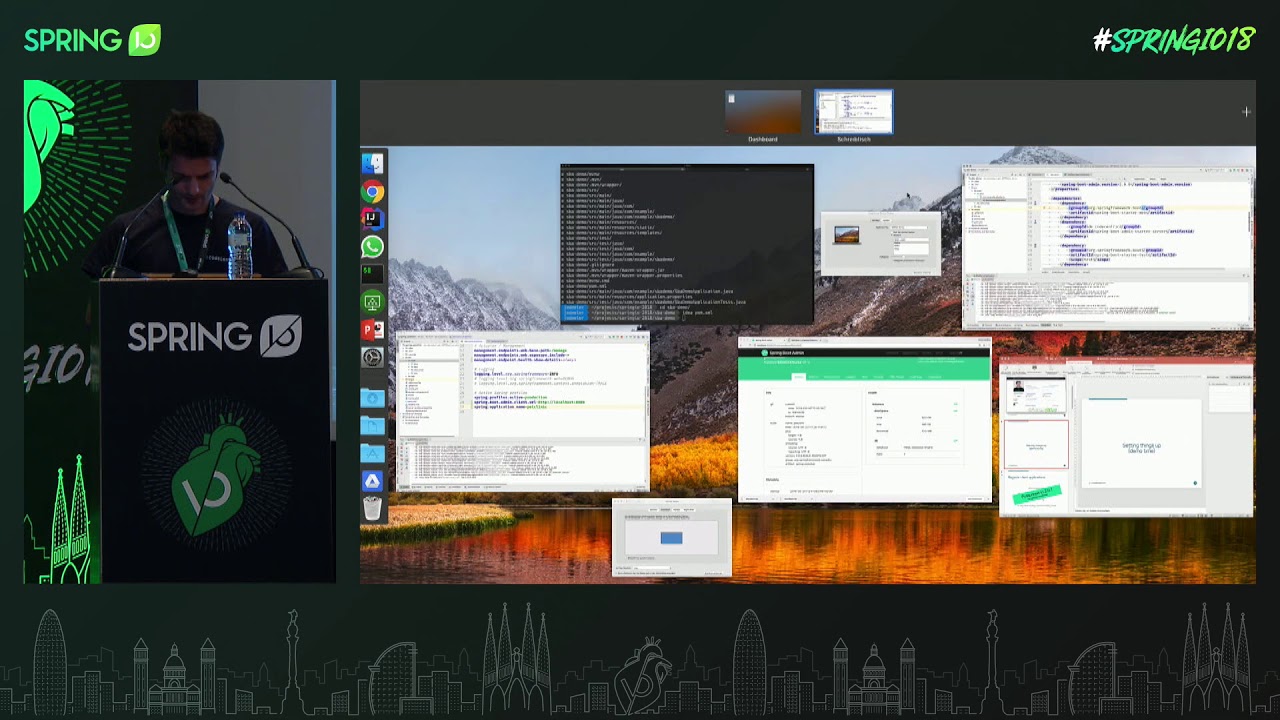
Monitoring Spring Boot® Applications with Spring Boot Admin @ Spring I/O 2018
Spring Boot® Admin - Monitoring and Configuring Spring Boot Applications at Runtime
Getting Help
Having trouble with codecentric's Spring Boot Admin? Weâd like to help!
-
Check the reference documentation.
-
Ask a question on stackoverflow.com - we monitor questions tagged with
spring-boot-admin. -
Ask for help in our spring-boot-admin Gitter chat
-
Report bugs at http://github.com/codecentric/spring-boot-admin/issues.
Reference Guide
Translated versions
The following reference guides have been translated by users of Spring Boot Admin and are not part of the official bundle. The maintainers of Spring Boot Admin will not update and maintain the guides mentioned below.
Version 2.6.6 (Chinese translated by @qq253498229)
Trademarks and licenses
The source code of codecentric's Spring Boot Admin is licensed under Apache License 2.0
Spring, Spring Boot and Spring Cloud are trademarks of Pivotal Software, Inc. in the U.S. and other countries.
Snapshot builds
You can access snapshot builds from the github snapshot repository by adding the following to your repositories:
<repository>
	<id>sba-snapshot</id>
	<name>Spring Boot Admin Snapshots</name>
	<url>https://maven.pkg.github.com/codecentric/spring-boot-admin</url>
	<snapshots>
		<enabled>true</enabled>
	</snapshots>
	<releases>
		<enabled>false</enabled>
	</releases>
</repository>
Contributing
See CONTRIBUTING.md file.
Top Related Projects
AWS Service registry for resilient mid-tier load balancing and failover.
GitHub Action that uploads coverage to Codecov :open_umbrella:
The Prometheus monitoring system and time series database.
The open and composable observability and data visualization platform. Visualize metrics, logs, and traces from multiple sources like Prometheus, Loki, Elasticsearch, InfluxDB, Postgres and many more.
Your window into the Elastic Stack
Convert designs to code with AI
Introducing Visual Copilot: A new AI model to turn Figma designs to high quality code using your components.
Try Visual Copilot