
Top Related Projects

GEF (GDB Enhanced Features) - a modern experience for GDB with advanced debugging capabilities for exploit devs & reverse engineers on Linux

Exploit Development and Reverse Engineering with GDB & LLDB Made Easy

PEDA - Python Exploit Development Assistance for GDB

Browser-based frontend to gdb (gnu debugger). Add breakpoints, view the stack, visualize data structures, and more in C, C++, Go, Rust, and Fortran. Run gdbgui from the terminal and a new tab will open in your browser.

A hacky debugger UI for hackers
Quick Overview
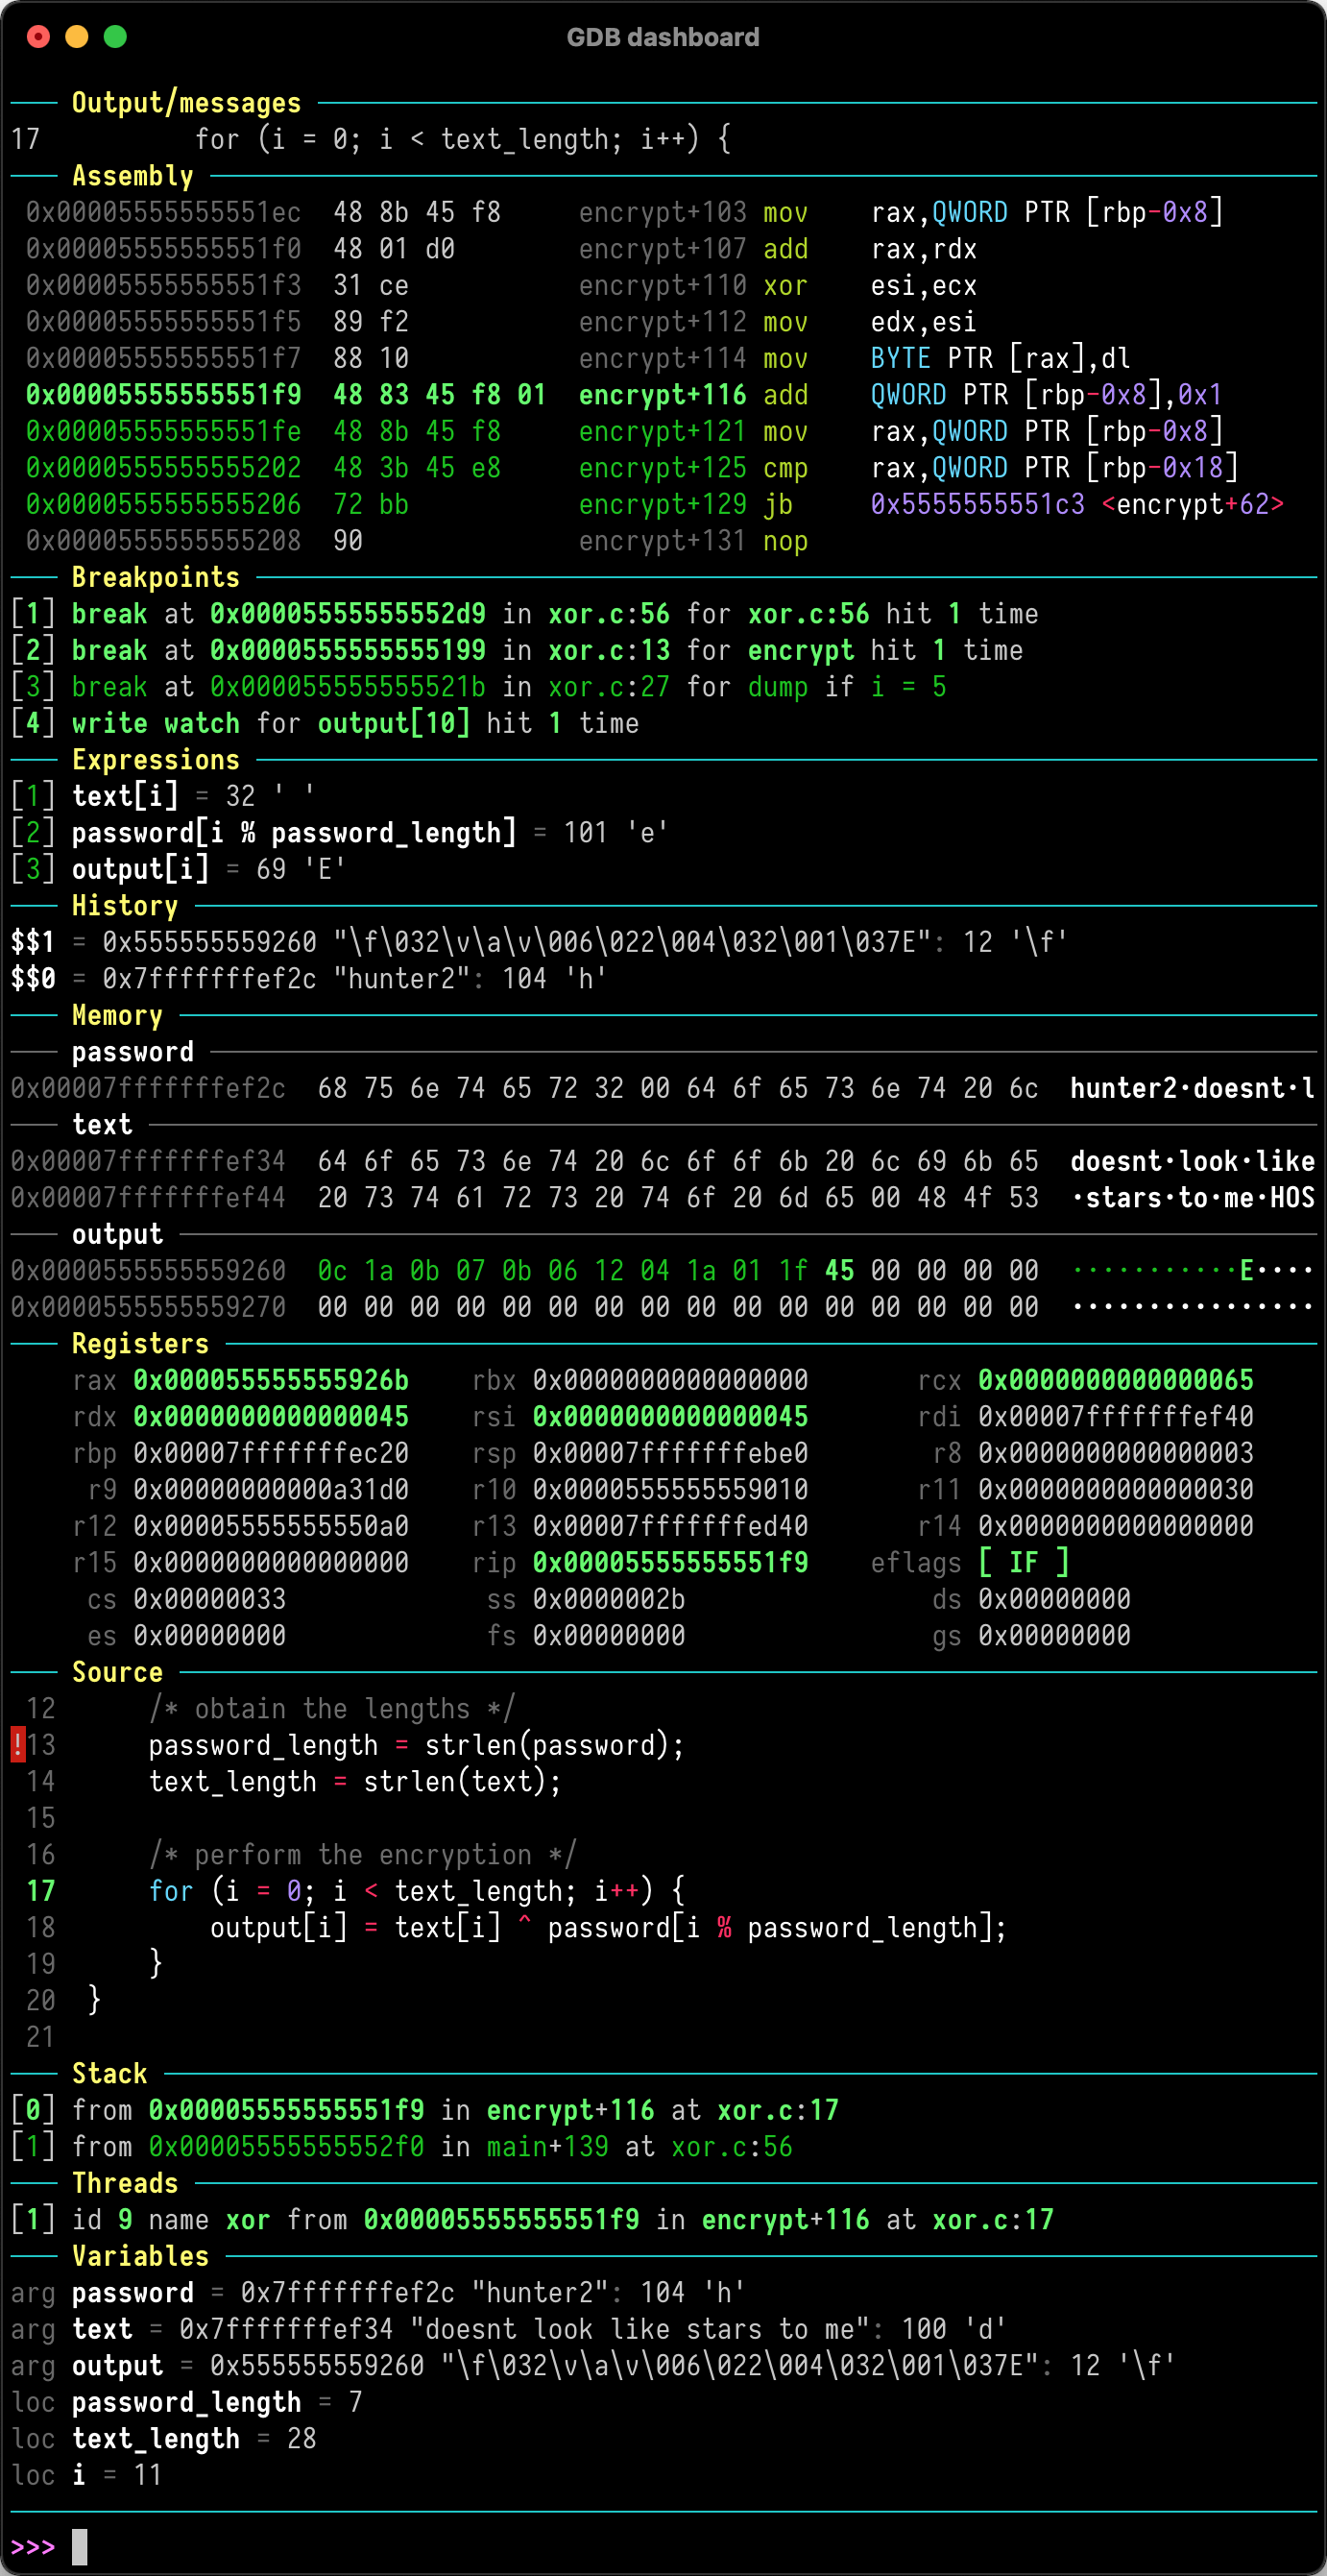
GDB Dashboard is a modular visual interface for GDB, the GNU Debugger. It enhances the debugging experience by providing a customizable, multi-window view of various aspects of the program being debugged, including source code, assembly, registers, and more. The dashboard is implemented as a Python script that runs within GDB.
Pros
- Improves the visual debugging experience with a customizable, multi-window interface
- Provides real-time updates of program state during debugging sessions
- Supports a wide range of architectures and integrates seamlessly with existing GDB commands
- Highly configurable with user-defined layouts and modules
Cons
- Requires Python support in GDB, which may not be available in all environments
- Can be overwhelming for users new to GDB or debugging in general
- May have performance impact on slower systems when displaying large amounts of information
- Limited to command-line environments, not suitable for users who prefer GUI debuggers
Getting Started
To install and use GDB Dashboard:
-
Download the
gdb-dashboardscript:wget -P ~ https://git.io/.gdbinit -
Start GDB with your program:
gdb ./your_program -
The dashboard will automatically appear when you start debugging. Use standard GDB commands to control execution and inspect program state.
-
Customize the dashboard by editing the
.gdbinitfile in your home directory. You can enable/disable modules, change their order, and adjust various settings.
Competitor Comparisons
GEF (GDB Enhanced Features) - a modern experience for GDB with advanced debugging capabilities for exploit devs & reverse engineers on Linux
Pros of GEF
- More feature-rich with advanced capabilities like heap analysis and ROP gadget search
- Supports multiple architectures (x86, ARM, MIPS, PowerPC)
- Actively maintained with frequent updates and a large community
Cons of GEF
- Steeper learning curve due to its extensive feature set
- Can be slower to load and execute commands compared to gdb-dashboard
- May be overwhelming for users who prefer a simpler interface
Code Comparison
GEF:
gef config context.layout "regs stack code args source memory"
gef config context.show_registers_raw False
gef config context.nb_lines_stack 8
gdb-dashboard:
dashboard -layout registers assembly stack
dashboard registers -style column
dashboard assembly -style opcodes
Both projects aim to enhance GDB's interface, but GEF offers a more comprehensive set of features at the cost of complexity, while gdb-dashboard provides a simpler, more streamlined experience. GEF is better suited for advanced users and complex debugging scenarios, whereas gdb-dashboard may be preferable for those seeking a straightforward, visually appealing GDB frontend.
Exploit Development and Reverse Engineering with GDB & LLDB Made Easy
Pros of pwndbg
- More comprehensive feature set for exploit development and reverse engineering
- Active community with frequent updates and contributions
- Integrated with other popular tools like ROPgadget and checksec
Cons of pwndbg
- Steeper learning curve due to more complex functionality
- Heavier resource usage, which may impact performance on older systems
- Can be overwhelming for users who only need basic debugging features
Code Comparison
pwndbg:
pwndbg> telescope 0x7fffffffe000 10
00:0000│ 0x7fffffffe000 —▸ 0x7fffffffe330 —▸ 0x7fffffffe668 ◂— 0x0
01:0008│ 0x7fffffffe008 —▸ 0x7ffff7de7000 (_rtld_global) ◂— 0x0
02:0010│ 0x7fffffffe010 ◂— 0x0
03:0018│ 0x7fffffffe018 —▸ 0x7fffffffe338 —▸ 0x7fffffffe679 ◂— '/home/user/example'
04:0020│ 0x7fffffffe020 —▸ 0x7fffffffe348 —▸ 0x7fffffffe68e ◂— 'SHELL=/bin/bash'
gdb-dashboard:
─── Stack ───────────────────────────────────────────────────────────────────────
[0x7fffffffe000 + 0] → 0x7fffffffe330 → 0x7fffffffe668 → 0x0
[0x7fffffffe008 + 8] → 0x7ffff7de7000 (_rtld_global) → 0x0
[0x7fffffffe010 + 16] → 0x0
[0x7fffffffe018 + 24] → 0x7fffffffe338 → 0x7fffffffe679 → "/home/user/example"
[0x7fffffffe020 + 32] → 0x7fffffffe348 → 0x7fffffffe68e → "SHELL=/bin/bash"
Both tools provide enhanced visualization of memory contents, but pwndbg offers more detailed information and symbols.
PEDA - Python Exploit Development Assistance for GDB
Pros of PEDA
- More feature-rich with advanced functionalities like pattern creation and searching
- Includes colorized and context-aware command output for better readability
- Offers automated exploits and ROP gadget finding capabilities
Cons of PEDA
- Can be overwhelming for beginners due to its extensive feature set
- May have a steeper learning curve compared to GDB-Dashboard
- Occasionally slower performance, especially with larger binaries
Code Comparison
PEDA command example:
gdb-peda$ checksec
CANARY    : disabled
FORTIFY   : disabled
NX        : ENABLED
PIE       : disabled
RELRO     : Partial
GDB-Dashboard command example:
dashboard -output /dev/pts/1
dashboard memory watch $sp 32
dashboard assembly -style height 20
Both tools enhance GDB's functionality, but PEDA focuses on exploit development features, while GDB-Dashboard emphasizes a clean, customizable interface. PEDA is more suited for advanced users and security researchers, whereas GDB-Dashboard provides a more streamlined experience for general debugging tasks.
Browser-based frontend to gdb (gnu debugger). Add breakpoints, view the stack, visualize data structures, and more in C, C++, Go, Rust, and Fortran. Run gdbgui from the terminal and a new tab will open in your browser.
Pros of gdbgui
- Provides a modern, user-friendly web-based interface for GDB
- Supports remote debugging and can be run on a server
- Offers visual breakpoints and variable exploration
Cons of gdbgui
- Requires additional setup and dependencies
- May have a steeper learning curve for users familiar with traditional GDB
- Performance can be slower compared to terminal-based alternatives
Code Comparison
gdb-dashboard configuration (.gdbinit):
dashboard -layout source variables
dashboard source -style height 25
dashboard variables -style compact True
gdbgui usage:
from gdbgui import launch_gdb
launch_gdb(gdb_command='gdb ./my_program')
Both tools enhance the GDB debugging experience, but gdb-dashboard focuses on improving the terminal interface, while gdbgui provides a graphical web-based solution. gdb-dashboard is lighter and faster, integrating seamlessly with existing GDB workflows. gdbgui offers more visual features and remote debugging capabilities at the cost of additional complexity and setup.
A hacky debugger UI for hackers
Pros of Voltron
- More extensible and customizable with a plugin system
- Supports multiple debuggers (GDB, LLDB, WinDbg, VDB)
- Offers a client-server architecture for remote debugging
Cons of Voltron
- Steeper learning curve due to more complex setup and configuration
- Requires additional dependencies and installation steps
- May be overkill for simpler debugging tasks
Code Comparison
Voltron configuration example:
from voltron.plugin import api

class MyView(api.TerminalView):
    def render(self):
        return self.proc.get_registers()
GDB Dashboard configuration example:
dashboard -layout registers stack assembly source variables
dashboard -style syntax_highlighting 'monokai'
dashboard -output /dev/pts/0
Summary
Voltron offers more advanced features and flexibility, making it suitable for complex debugging scenarios and multi-debugger environments. GDB Dashboard, on the other hand, provides a simpler, more straightforward approach that's easier to set up and use for basic GDB debugging tasks. The choice between the two depends on the user's specific needs, debugging environment, and desired level of customization.
Convert  designs to code with AI

Introducing Visual Copilot: A new AI model to turn Figma designs to high quality code using your components.
Try Visual CopilotREADME
GDB dashboard
GDB dashboard is a standalone .gdbinit file written using the Python API that enables a modular interface showing relevant information about the program being debugged. Its main goal is to reduce the number of GDB commands needed to inspect the status of current program thus allowing the developer to primarily focus on the control flow.
Quickstart
Just place .gdbinit in your home directory, for example with:
wget -P ~ https://github.com/cyrus-and/gdb-dashboard/raw/master/.gdbinit
Optionally install Pygments to enable syntax highlighting:
pip install pygments
Then debug as usual, the dashboard will appear automatically every time the inferior program stops.
Keep in mind that no GDB command has been redefined, instead all the features are available via the main dashboard command (see help dashboard).
Head to the wiki to learn how to perform the most important tasks.
Top Related Projects
GEF (GDB Enhanced Features) - a modern experience for GDB with advanced debugging capabilities for exploit devs & reverse engineers on Linux
Exploit Development and Reverse Engineering with GDB & LLDB Made Easy
PEDA - Python Exploit Development Assistance for GDB
Browser-based frontend to gdb (gnu debugger). Add breakpoints, view the stack, visualize data structures, and more in C, C++, Go, Rust, and Fortran. Run gdbgui from the terminal and a new tab will open in your browser.
A hacky debugger UI for hackers
Convert designs to code with AI
Introducing Visual Copilot: A new AI model to turn Figma designs to high quality code using your components.
Try Visual Copilot