
Top Related Projects

:dizzy: Display dynamic, automatically organised, customizable network views.

⚠️ This project is not maintained anymore! Please go to https://github.com/visjs

Directed graph layout for JavaScript

Beautiful Graphs

Force-directed graph rendered on HTML5 canvas
Quick Overview
Cytoscape.js is an open-source JavaScript library for visualizing and analyzing complex networks and graphs. It provides a powerful and flexible platform for creating interactive and customizable network visualizations for a wide range of applications, including biology, social networks, and data analysis.
Pros
- Extensive Functionality: Cytoscape.js offers a wide range of features and tools for network visualization, including support for various graph layouts, node and edge styling, and interactive user controls.
- Customizability: The library is highly customizable, allowing developers to create unique and tailored visualizations to suit their specific needs.
- Cross-platform Compatibility: Cytoscape.js is a JavaScript-based library, making it compatible with a variety of platforms and environments, including web browsers, mobile devices, and server-side applications.
- Active Community: The Cytoscape.js project has a large and active community of developers and contributors, providing ongoing support, bug fixes, and feature enhancements.
Cons
- Steep Learning Curve: Cytoscape.js has a relatively steep learning curve, especially for developers who are new to network visualization or complex data structures.
- Performance Limitations: While Cytoscape.js is generally performant, it may struggle with rendering extremely large or complex networks, particularly on lower-powered devices.
- Dependency on External Libraries: Cytoscape.js relies on several external libraries, such as jQuery and Popper.js, which can add to the overall project complexity and potential for compatibility issues.
- Limited Mobile Support: While Cytoscape.js is compatible with mobile devices, the library's performance and user experience on mobile platforms may not be as polished as on desktop environments.
Code Examples
Here are a few examples of how to use Cytoscape.js:
- Creating a Basic Network Visualization:
// Create a new Cytoscape instance
const cy = cytoscape({
  container: document.getElementById('cy'),
  elements: [
    { data: { id: 'a' } },
    { data: { id: 'b' } },
    { data: { source: 'a', target: 'b' } }
  ],
  style: [
    {
      selector: 'node',
      style: {
        'background-color': '#666',
        'label': 'data(id)'
      }
    },
    {
      selector: 'edge',
      style: {
        'width': 3,
        'line-color': '#ccc',
        'target-arrow-color': '#ccc',
        'target-arrow-shape': 'triangle'
      }
    }
  ],
  layout: {
    name: 'grid'
  }
});
- Applying a Force-Directed Layout:
// Apply a force-directed layout
cy.layout({
  name: 'fcose',
  animate: true,
  animationDuration: 1000,
  randomize: false,
  nodeDimensionsIncludeLabels: true
}).run();
- Handling User Interactions:
// Add event listeners for user interactions
cy.on('tap', 'node', (event) => {
  const node = event.target;
  console.log(`Clicked on node: ${node.id()}`);
});

cy.on('mouseover', 'node', (event) => {
  const node = event.target;
  node.css('background-color', 'orange');
});

cy.on('mouseout', 'node', (event) => {
  const node = event.target;
  node.css('background-color', '#666');
});
- Exporting Network Data:
// Export the network data as JSON
const networkData = cy.json();
console.log(networkData);
Getting Started
To get started with Cytoscape.js, follow these steps:
- Install the library using npm or a CDN:
npm install cytoscape
- Create an HTML container for the Cytoscape.js visualization:
<div id="cy"></div>
- Initialize Cyto
Competitor Comparisons
:dizzy: Display dynamic, automatically organised, customizable network views.
Pros of vis-network
- Simpler API and easier to get started for basic network visualizations
- Better performance for larger networks (10,000+ nodes)
- More built-in physics simulation options for layout
Cons of vis-network
- Less flexible for custom styling and advanced graph operations
- Fewer extension points and plugins compared to Cytoscape.js
- Limited support for compound nodes (nodes within nodes)
Code Comparison
vis-network:
var nodes = new vis.DataSet([
  {id: 1, label: 'Node 1'},
  {id: 2, label: 'Node 2'}
]);
var edges = new vis.DataSet([
  {from: 1, to: 2}
]);
var container = document.getElementById('mynetwork');
var data = {nodes: nodes, edges: edges};
var options = {};
var network = new vis.Network(container, data, options);
Cytoscape.js:
var cy = cytoscape({
  container: document.getElementById('cy'),
  elements: [
    { data: { id: 'a' } },
    { data: { id: 'b' } },
    { data: { id: 'ab', source: 'a', target: 'b' } }
  ],
  style: [ /* ... */ ],
  layout: { name: 'grid' }
});
Both libraries offer powerful graph visualization capabilities, but Cytoscape.js provides more flexibility and extensibility, while vis-network excels in performance for larger networks and ease of use for simpler visualizations.
⚠️ This project is not maintained anymore! Please go to https://github.com/visjs
Pros of vis
- More diverse visualization types (e.g., timelines, networks, graphs)
- Easier to set up and use for simple visualizations
- Better documentation and examples for beginners
Cons of vis
- Less performant for large-scale graph rendering
- Fewer advanced graph analysis features
- Less active community and slower development pace
Code Comparison
vis:
var nodes = new vis.DataSet([
  {id: 1, label: 'Node 1'},
  {id: 2, label: 'Node 2'}
]);
var edges = new vis.DataSet([
  {from: 1, to: 2}
]);
var network = new vis.Network(container, {nodes: nodes, edges: edges}, options);
Cytoscape.js:
var cy = cytoscape({
  container: document.getElementById('cy'),
  elements: [
    { data: { id: 'a' } },
    { data: { id: 'b' } },
    { data: { id: 'ab', source: 'a', target: 'b' } }
  ]
});
Both libraries offer graph visualization capabilities, but Cytoscape.js is more focused on graph theory and network analysis, while vis provides a broader range of visualization types. Cytoscape.js has better performance for large graphs and more advanced graph algorithms, making it suitable for complex network analysis tasks. vis is easier to get started with and offers more diverse visualization options, making it a good choice for simpler projects or those requiring multiple visualization types.
Directed graph layout for JavaScript
Pros of dagre
- Specialized in directed graph layouts, offering efficient algorithms for hierarchical structures
- Lightweight and focused, making it easier to integrate into existing projects
- Better performance for large, complex directed graphs
Cons of dagre
- Limited to directed graph layouts, less versatile for other graph types
- Fewer built-in features and customization options
- Smaller community and less frequent updates
Code Comparison
dagre:
var g = new dagre.graphlib.Graph();
g.setNode("a", { label: "A" });
g.setNode("b", { label: "B" });
g.setEdge("a", "b");
dagre.layout(g);
Cytoscape.js:
var cy = cytoscape({
  elements: [
    { data: { id: 'a', label: 'A' } },
    { data: { id: 'b', label: 'B' } },
    { data: { source: 'a', target: 'b' } }
  ],
  layout: { name: 'dagre' }
});
Summary
dagre is a specialized library for directed graph layouts, offering efficient algorithms and good performance for hierarchical structures. It's lightweight and easy to integrate but has limited features compared to Cytoscape.js. Cytoscape.js is more versatile, supporting various graph types and offering extensive customization options, but may be overkill for simple directed graph layouts.
Beautiful Graphs
Pros of ngraph
- Lightweight and modular, allowing for more flexibility in graph rendering
- Better performance for large-scale graphs with thousands of nodes
- Supports 3D graph layouts out of the box
Cons of ngraph
- Less comprehensive documentation compared to Cytoscape.js
- Fewer built-in layout algorithms and styling options
- Steeper learning curve for beginners due to its modular nature
Code Comparison
ngraph:
var graph = require('ngraph.graph')();
var renderGraph = require('ngraph.three');

graph.addLink(1, 2);
graph.addLink(2, 3);

var renderer = renderGraph(graph);
renderer.run();
Cytoscape.js:
var cy = cytoscape({
  container: document.getElementById('cy'),
  elements: [
    { data: { id: '1' } },
    { data: { id: '2' } },
    { data: { id: '3' } },
    { data: { source: '1', target: '2' } },
    { data: { source: '2', target: '3' } }
  ]
});
Both libraries offer graph visualization capabilities, but ngraph focuses on performance and modularity, while Cytoscape.js provides a more comprehensive set of features and easier setup for beginners. The code comparison shows that ngraph requires separate modules for graph creation and rendering, while Cytoscape.js combines these functionalities in a single setup.
Force-directed graph rendered on HTML5 canvas
Pros of Force-Graph
- Simpler API and easier to get started with for basic force-directed graphs
- Built-in support for 3D force-directed graphs
- Lightweight and focused specifically on force-directed layouts
Cons of Force-Graph
- Less flexible for complex graph visualizations and custom layouts
- Fewer built-in algorithms and analysis tools
- More limited styling and customization options
Code Comparison
Force-Graph:
const Graph = ForceGraph()
  (document.getElementById('graph'))
    .graphData(data)
    .nodeId('id')
    .nodeVal('val')
    .nodeLabel('name')
    .linkSource('source')
    .linkTarget('target');
Cytoscape.js:
const cy = cytoscape({
  container: document.getElementById('graph'),
  elements: data,
  style: [ /* ... */ ],
  layout: { name: 'cose' }
});
Both libraries allow for easy graph creation, but Force-Graph's API is more concise for basic force-directed layouts. Cytoscape.js offers more flexibility in styling and layout options, making it better suited for complex graph visualizations and analysis tasks. Force-Graph excels in simplicity and 3D support, while Cytoscape.js provides a more comprehensive toolkit for graph manipulation and analysis.
Convert  designs to code with AI

Introducing Visual Copilot: A new AI model to turn Figma designs to high quality code using your components.
Try Visual CopilotREADME
![]()
![]()
![]()
![]()

![]()

![]()
![]()
![]()
Created at the University of Toronto and published in Oxford Bioinformatics (2016, 2023).
Authored by: Max Franz, Christian Lopes, Dylan Fong, Mike Kucera, ..., Gary Bader
Cytoscape.js
Graph theory (network) library for visualisation and analysis : https://js.cytoscape.org
Description
Cytoscape.js is a fully featured graph theory library. Do you need to model and/or visualise relational data, like biological data or social networks? If so, Cytoscape.js is just what you need.
Cytoscape.js contains a graph theory model and an optional renderer to display interactive graphs. This library was designed to make it as easy as possible for programmers and scientists to use graph theory in their apps, whether it's for server-side analysis in a Node.js app or for a rich user interface.
You can get started with Cytoscape.js with one line:
var cy = cytoscape({ elements: myElements, container: myDiv });
Learn more about the features of Cytoscape.js by reading its documentation.
Example
The Tokyo railway stations network can be visualised with Cytoscape:
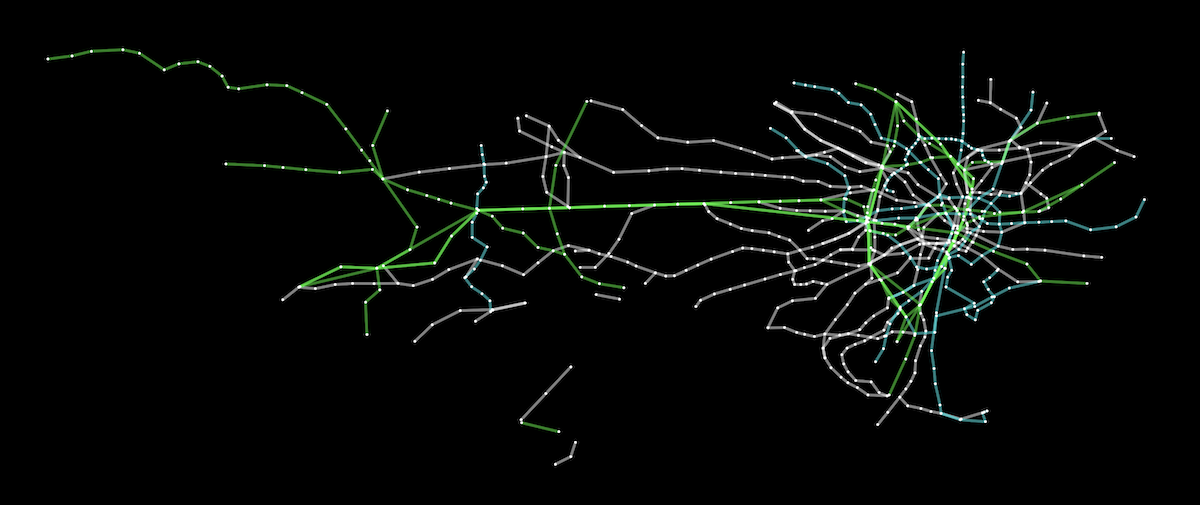
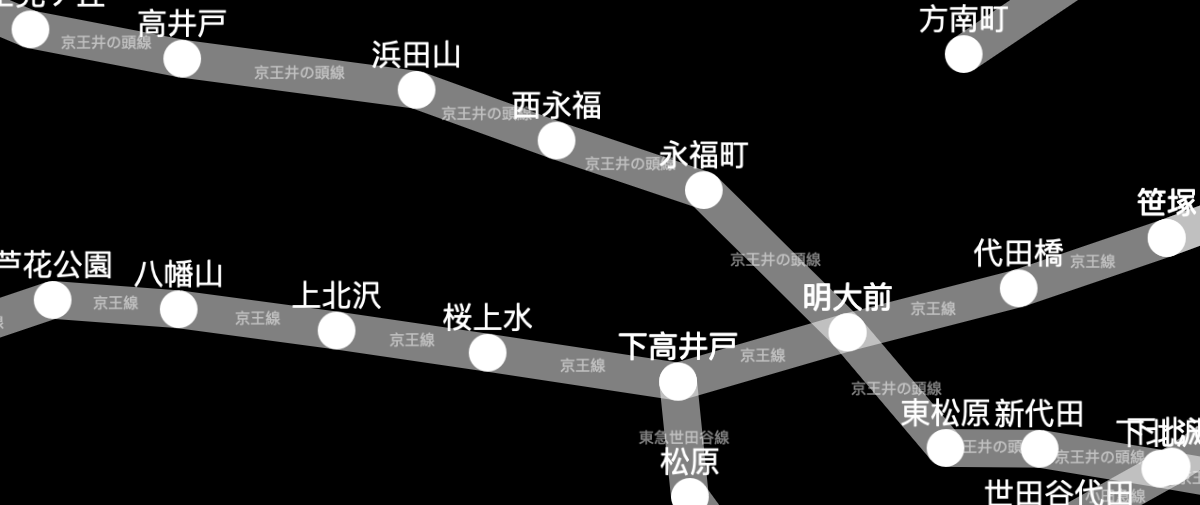
A live demo and source code are available for the Tokyo railway stations graph. More demos are available in the documentation.
Documentation
You can find the documentation and downloads on the project website.
Roadmap
Future versions of Cytoscape.js are planned in the milestones of the Github issue tracker. You can use the milestones to see what's currently planned for future releases.
Contributing to Cytoscape.js
Would you like to become a Cytoscape.js contributor? You can contribute in technical roles (e.g. features, testing) or non-technical roles (e.g. documentation, outreach), depending on your interests. Get in touch with us by posting a GitHub discussion.
For the mechanics of contributing a pull request, refer to CONTRIBUTING.md.
Feature releases are made monthly, while patch releases are made weekly. This allows for rapid releases of first- and third-party contributions.
Citation
To cite Cytoscape.js in a paper, please cite the Oxford Bioinformatics issue:
Cytoscape.js: a graph theory library for visualisation and analysis
Franz M, Lopes CT, Huck G, Dong Y, Sumer O, Bader GD
Bioinformatics (2016) 32 (2): 309-311 first published online September 28, 2015 doi:10.1093/bioinformatics/btv557 (PDF)
Build dependencies
Install node and npm. Run npm install before using npm run.
Build instructions
Run npm run <target> in the console. The main targets are:
Building:
build: do all builds of the library (umd, min, umd, esm)build:min: do the unminified build with bundled dependencies (for simple html pages, good for novices)build:umd: do the umd (cjs/amd/globals) buildbuild:esm: do the esm (ES 2015 modules) buildclean: clean thebuilddirectorydocs: build the docs intodocumentationrelease: build all release artifactswatch: automatically build lib for debugging (with sourcemap, no babel, very quick)- good for general testing on
debug/index.html - served on
http://localhost:8080or the first available port thereafter, with livereload ondebug/index.html
- good for general testing on
watch:babel: automatically build lib for debugging (with sourcemap, with babel, a bit slower)- good for testing performance or for testing out of date browsers
- served on
http://localhost:8080or the first available port thereafter, with livereload ondebug/index.html
watch:umd: automatically build prod umd bundle (no sourcemap, with babel)- good for testing cytoscape in another project (with a
"cytoscape": "file:./path/to/cytoscape"reference in your project'spackage.json) - no http server
- good for testing cytoscape in another project (with a
dist: update the distribution js for npm etc.
Testing:
The default test scripts run directly against the source code. Tests can alternatively be run on a built bundle. The library can be built on node>=6, but the library's bundle can be tested on node>=0.10.
test: run all testing & lintingtest:js: run the mocha tests on the public API of the lib (directly on source files)npm run test:js -- -g "my test name"runs tests on only the matching test cases
test:build: run the mocha tests on the public API of the lib (on a built bundle)npm run buildshould be run beforehand on a recent version of nodenpm run test:build -- -g "my test name"runs build tests on only the matching test cases
test:modules: run unit tests on private, internal APInpm run test:modules -- -g "my test name"runs modules tests on only the matching test cases
lint: lint the js sources via eslintbenchmark: run all benchmarksbenchmark:single: run benchmarks only for the suite specified inbenchmark/single
Release instructions
Background
- Ensure that a milestone exists for the release you want to make, with all the issues for that release assigned in the milestone.
- Bug fixes should be applied to both the
masterandunstablebranches. PRs can go on either branch, with the patch applied to the other branch after merging. - When a patch release is made concurrently with a feature release, the patch release should be made first. Wait 5 minutes after the patch release completes before starting the feature release -- otherwise Zenodo doesn't pick up releases properly.
Patch version
- Go to Actions > Patch release
- Go to the 'Run workflow' dropdown
- [Optional] The 'master' branch should be preselected for you
- Press the green 'Run workflow' button
- Close the milestone for the release
Feature version
- Go to Actions > Feature release
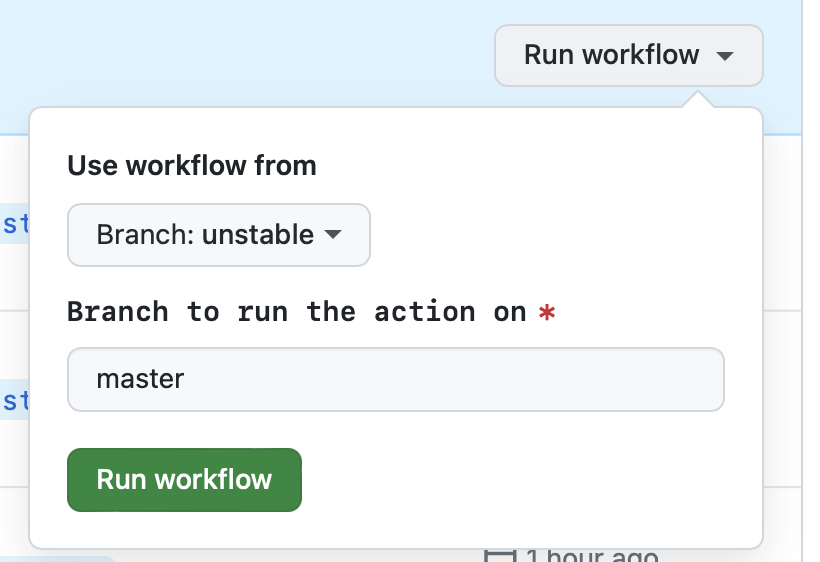
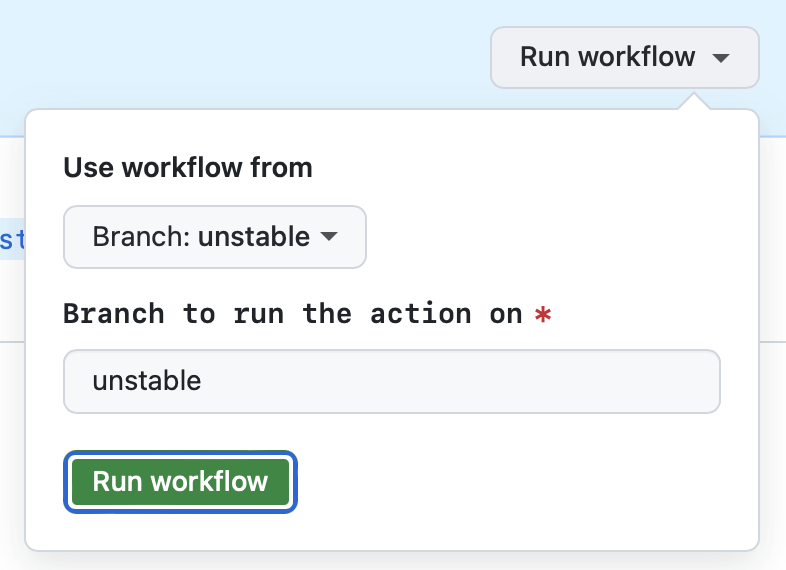
- Go to the 'Run workflow' dropdown
- [Optional] The 'unstable' branch should be preselected for you
- Press the green 'Run workflow' button
- Close the milestone for the release
- Make the release announcement on the blog
Notes on GitHub Actions UI
- 'Use workflow from' in the GitHub UI selects the branch from which the workflow YML file is selected. Since the workflow files should usually be the same on the master and unstable branches, it shouldn't matter what's selected.
- 'Branch to run the action on' in the GitHub UI is preselected for you. You don't need to change it.
Tests
Mocha tests are found in the test directory. The tests can be run in the browser or they can be run via Node.js (npm run test:js).
Top Related Projects
:dizzy: Display dynamic, automatically organised, customizable network views.
⚠️ This project is not maintained anymore! Please go to https://github.com/visjs
Directed graph layout for JavaScript
Beautiful Graphs
Force-directed graph rendered on HTML5 canvas
Convert designs to code with AI
Introducing Visual Copilot: A new AI model to turn Figma designs to high quality code using your components.
Try Visual Copilot