
Top Related Projects

UNIX-like reverse engineering framework and command-line toolset

An open-source user mode debugger for Windows. Optimized for reverse engineering and malware analysis.

Exploit Development and Reverse Engineering with GDB & LLDB Made Easy

GEF (GDB Enhanced Features) - a modern experience for GDB with advanced debugging capabilities for exploit devs & reverse engineers on Linux

Free and Open Source Reverse Engineering Platform powered by rizin

Clone this repo to build Frida
Quick Overview
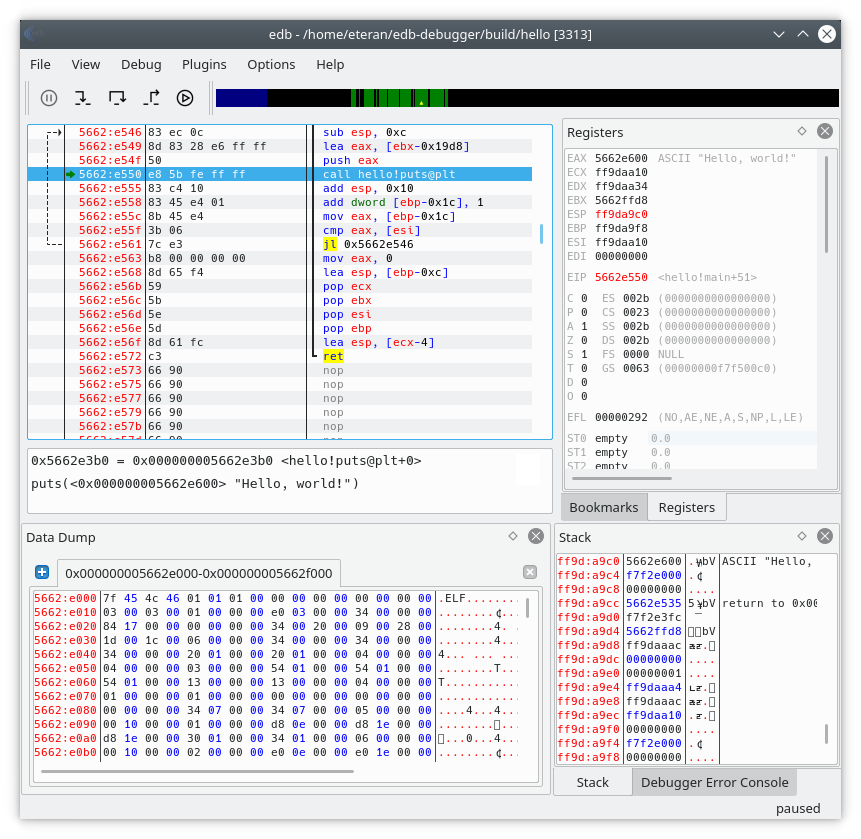
edb-debugger is an open-source, cross-platform AArch32/x86/x86-64 debugger. It aims to be a Linux equivalent of OllyDbg, providing a user-friendly graphical interface for debugging and reverse engineering. edb-debugger supports various debugging features and is designed to be extensible through plugins.
Pros
- Cross-platform support (Linux, FreeBSD, OpenBSD, macOS, Windows)
- User-friendly graphical interface
- Extensible through a plugin system
- Active development and community support
Cons
- Limited documentation compared to some commercial debuggers
- May have a steeper learning curve for beginners
- Some advanced features might be missing compared to more established debuggers
- Performance can be slower than some native debuggers on certain platforms
Getting Started
To get started with edb-debugger:
-
Clone the repository:
git clone https://github.com/eteran/edb-debugger.git -
Install dependencies (example for Ubuntu):
sudo apt-get install cmake build-essential libboost-dev libqt5xmlpatterns5-dev qtbase5-dev qt5-default libgraphviz-dev libcapstone-dev -
Build the project:
cd edb-debugger mkdir build && cd build cmake .. make -
Run edb-debugger:
./edb
For more detailed instructions and platform-specific information, refer to the project's README and documentation on GitHub.
Competitor Comparisons
UNIX-like reverse engineering framework and command-line toolset
Pros of radare2
- More comprehensive and feature-rich, supporting a wider range of architectures and file formats
- Highly scriptable and extensible with a powerful API
- Active community and frequent updates
Cons of radare2
- Steeper learning curve due to its complexity and command-line interface
- Less user-friendly for beginners compared to edb-debugger's GUI
- Can be overwhelming with its vast array of features and options
Code Comparison
radare2:
r2 -d /bin/ls
[0x7f...]> aaa
[0x7f...]> pdf @ main
edb-debugger:
edb --run /bin/ls
// GUI-based interaction, no direct command-line equivalent
Summary
radare2 is a powerful, versatile tool with a command-line interface, suitable for advanced users and complex analysis tasks. edb-debugger offers a more accessible GUI-based approach, making it easier for beginners but potentially limiting for advanced use cases. radare2's extensive features and scriptability come at the cost of a steeper learning curve, while edb-debugger prioritizes ease of use but may lack some advanced capabilities.
An open-source user mode debugger for Windows. Optimized for reverse engineering and malware analysis.
Pros of x64dbg
- More extensive feature set, including advanced debugging capabilities and a rich plugin ecosystem
- Active development with frequent updates and a larger community
- Better support for Windows-specific debugging scenarios
Cons of x64dbg
- Steeper learning curve due to its complex interface and numerous features
- Limited cross-platform support, primarily focused on Windows
Code Comparison
While both debuggers use different codebases, here's a simplified example of how they might handle breakpoints:
edb-debugger:
DebuggerCore::insert_breakpoint(edb::address_t address) {
    quint8 orig_byte;
    if (read_bytes(address, &orig_byte, 1)) {
        write_bytes(address, &break_opcode, 1);
    }
}
x64dbg:
bool DbgSetBpxEx(duint address, BPXTYPE type, bool singleshoot, DWORD titantype, size_t count) {
    BREAKPOINT bp;
    bp.type = type;
    bp.addr = address;
    bp.enabled = true;
    bp.singleshoot = singleshoot;
    bp.titantype = titantype;
    return BpAdd(&bp);
}
Both debuggers implement breakpoint functionality, but x64dbg offers more granular control over breakpoint types and behavior.
Exploit Development and Reverse Engineering with GDB & LLDB Made Easy
Pros of pwndbg
- Seamless integration with GDB, providing enhanced functionality for reverse engineering and exploit development
- Extensive set of commands tailored for binary analysis and exploitation
- Active community and frequent updates, ensuring compatibility with latest vulnerabilities and techniques
Cons of pwndbg
- Steeper learning curve due to command-line interface and advanced features
- Limited cross-platform support, primarily focused on Linux environments
- Requires additional setup and configuration compared to standalone GUI debuggers
Code Comparison
pwndbg:
from pwn import *
context.update(arch='i386', os='linux')
p = process('./vulnerable_program')
p.sendline(cyclic(100))
p.interactive()
edb-debugger:
#include <QApplication>
#include <edb.h>

int main(int argc, char *argv[]) {
    QApplication app(argc, argv);
    edb::v1::load_plugin("AnalyzerPlugin");
    return edb::v1::run_debug_session(argv[1]);
}
While pwndbg focuses on command-line interaction and scripting capabilities, edb-debugger provides a graphical interface for debugging. pwndbg is more suited for advanced users and security researchers, while edb-debugger offers a more accessible approach for general-purpose debugging tasks.
GEF (GDB Enhanced Features) - a modern experience for GDB with advanced debugging capabilities for exploit devs & reverse engineers on Linux
Pros of GEF
- Integrates seamlessly with GDB, leveraging its powerful debugging capabilities
- Offers a rich set of features for exploit development and reverse engineering
- Supports multiple architectures, including x86, ARM, MIPS, and PowerPC
Cons of GEF
- Requires GDB as a dependency, which may not be ideal for all use cases
- Has a steeper learning curve due to its extensive feature set
- Limited GUI support, primarily operates through command-line interface
Code Comparison
GEF:
gef➤ checksec
[+] checksec for '/path/to/binary'
Canary                        : ✓
NX                            : ✓
PIE                           : ✓
Fortify                       : ✘
RelRO                         : Full
EDB:
// No direct equivalent in EDB, but similar functionality can be achieved through plugins or manual analysis
Additional Notes
EDB-Debugger is a graphical debugger with a user-friendly interface, making it more accessible for beginners. It primarily focuses on x86 and x86-64 architectures, offering a comprehensive set of debugging tools within a GUI environment. GEF, on the other hand, extends GDB's functionality, providing advanced features for security researchers and exploit developers across multiple architectures, but with a command-line interface.
Free and Open Source Reverse Engineering Platform powered by rizin
Pros of Cutter
- More comprehensive feature set, including support for multiple architectures and file formats
- Built on top of the powerful rizin reverse engineering framework
- Active development with frequent updates and a larger community
Cons of Cutter
- Steeper learning curve due to its extensive functionality
- Potentially overwhelming interface for beginners or those with simpler debugging needs
- Larger resource footprint compared to edb-debugger
Code Comparison
Cutter (Python API example):
import cutter

# Open a binary
cutter.cmd("o /bin/ls")

# Analyze the binary
cutter.cmd("aa")

# Print functions
print(cutter.cmdj("aflj"))
edb-debugger (C++ API example):
#include <edb/Debugger.h>

// Attach to a process
edb::v1::debugger_core->attach(pid);

// Set a breakpoint
edb::address_t address = 0x12345678;
edb::v1::debugger_core->set_breakpoint(address);

// Continue execution
edb::v1::debugger_core->resume(edb::DEBUG_CONTINUE);
Both Cutter and edb-debugger are powerful debugging tools, but they cater to different user needs. Cutter offers a more feature-rich environment suitable for complex reverse engineering tasks, while edb-debugger provides a simpler, more focused debugging experience for x86/x86-64 binaries.
Clone this repo to build Frida
Pros of Frida
- Cross-platform support (iOS, Android, Windows, macOS, Linux)
- Dynamic instrumentation and code injection capabilities
- Extensive scripting support with JavaScript API
Cons of Frida
- Steeper learning curve for beginners
- May require more setup and configuration
Code Comparison
Frida (JavaScript):
Java.perform(function () {
  var MainActivity = Java.use("com.example.app.MainActivity");
  MainActivity.onCreate.implementation = function (savedInstanceState) {
    console.log("MainActivity.onCreate() called");
    this.onCreate(savedInstanceState);
  };
});
EDB-Debugger (C++):
#include <edb/Debugger.h>

int main() {
    edb::v1::Debugger debugger;
    debugger.attach(pid);
    debugger.run();
    return 0;
}
Key Differences
- Frida focuses on dynamic instrumentation and runtime manipulation
- EDB-Debugger is a traditional debugger with a GUI interface
- Frida offers more flexibility for mobile and cross-platform debugging
- EDB-Debugger provides a more familiar environment for desktop application debugging
Use Cases
- Frida: Mobile app analysis, reverse engineering, and security research
- EDB-Debugger: Desktop application debugging and analysis on Linux systems
Convert  designs to code with AI

Introducing Visual Copilot: A new AI model to turn Figma designs to high quality code using your components.
Try Visual CopilotREADME

![]()
![]()
![]()
edb is a cross platform AArch32/x86/x86-64 debugger. It was inspired by Ollydbg, but aims to function on AArch32, x86, and x86-64 as well as multiple OS's. Linux is the only officially supported platform at the moment, but FreeBSD, OpenBSD, OSX and Windows ports are underway with varying degrees of functionality.
edb is available under the GPL 2 license, see the COPYING for details.
NOTE: version 1.5.0 is the last version to support linux kernels older than 3.0. New development will target 3.0 and newer, and will be 2.0.0 when released.
NOTE: This README now only covers the most essential documentation, for more complete documentation see the wiki
Cloning
When cloning the repo, please use git's --recursive flag to ensure that the
sub-modules will be properly cloned and updated to the correct versions.
Here is an example:
git clone --recursive https://github.com/eteran/edb-debugger.git
Compiling
Compiling edb is generally quite simple. The latest release of edb currently depends on the following packages:
| Dependency | Version Required |
|---|---|
| GCC/Clang | Supporting C++17 |
| Qt | >= 5.9 |
| Capstone | >= 3.0 |
| Graphviz | >= 2.38.0 (Optional) |
Many distributions already have packages that satisfy these. The wiki contains examples for some popular distributions:
- https://github.com/eteran/edb-debugger/wiki/Compiling-(Fedora)
- https://github.com/eteran/edb-debugger/wiki/Compiling-(Ubuntu)
- https://github.com/eteran/edb-debugger/wiki/Compiling-(Debian)
Once you have the necessary dependencies installed, compilation is done with
cmake:
CMake
If you plan to just run edb out of the build directory, it's as simple as this:
$ mkdir build
$ cd build
$ cmake ..
$ make
$ ./edb
If you would like to properly install edb on the system for all users, it's only a little different:
$ mkdir build
$ cd build
$ cmake -DCMAKE_INSTALL_PREFIX=/usr/local/ ..
$ make
$ make install
$ edb
Installing
Basic installation is simple, you may run
$ make install
In which case the plugins will be installed in /usr/local/lib/edb and the
binaries will be installed in /usr/local/bin/.
Top Related Projects
UNIX-like reverse engineering framework and command-line toolset
An open-source user mode debugger for Windows. Optimized for reverse engineering and malware analysis.
Exploit Development and Reverse Engineering with GDB & LLDB Made Easy
GEF (GDB Enhanced Features) - a modern experience for GDB with advanced debugging capabilities for exploit devs & reverse engineers on Linux
Free and Open Source Reverse Engineering Platform powered by rizin
Clone this repo to build Frida
Convert designs to code with AI
Introducing Visual Copilot: A new AI model to turn Figma designs to high quality code using your components.
Try Visual Copilot