
Top Related Projects

Like Prometheus, but for logs.

Logstash - transport and process your logs, events, or other data

The Prometheus monitoring system and time series database.

Agent for collecting, processing, aggregating, and writing metrics, logs, and other arbitrary data.
Quick Overview
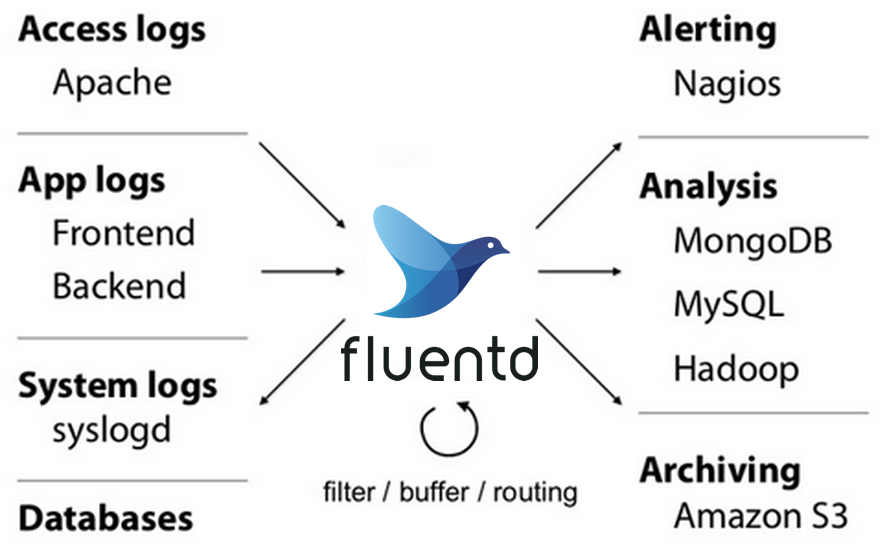
Fluentd is an open-source data collector and unified logging layer, designed to unify data collection and consumption for better use and understanding of data. It allows you to collect, process, and forward logs from various sources to multiple destinations, making it easier to handle large volumes of log data in a flexible and scalable manner.
Pros
- Highly flexible and extensible with over 1000 plugins
- Supports multiple input and output formats
- Lightweight and written in C and Ruby for performance
- Strong community support and active development
Cons
- Configuration can be complex for advanced use cases
- Limited built-in visualization capabilities
- Potential performance issues with very high data volumes
- Steep learning curve for newcomers
Code Examples
- Basic configuration to collect system logs and forward to Elasticsearch:
<source>
  @type tail
  path /var/log/syslog
  tag system.logs
</source>

<match system.**>
  @type elasticsearch
  host localhost
  port 9200
  index_name fluentd
  type_name fluentd
</match>
- Parsing JSON logs and filtering based on log level:
<source>
  @type tail
  path /var/log/app/application.log
  tag app.logs
  <parse>
    @type json
  </parse>
</source>

<filter app.logs>
  @type grep
  <regexp>
    key level
    pattern (ERROR|WARN)
  </regexp>
</filter>

<match app.logs>
  @type file
  path /var/log/fluentd/filtered_logs
</match>
- Using the record_transformer plugin to add custom fields:
<source>
  @type http
  port 8888
</source>

<filter **>
  @type record_transformer
  <record>
    hostname "#{Socket.gethostname}"
    tag ${tag}
    time ${time}
  </record>
</filter>

<match **>
  @type stdout
</match>
Getting Started
-
Install Fluentd:
gem install fluentd -
Create a basic configuration file (fluent.conf):
<source> @type http port 8888 </source> <match **> @type stdout </match> -
Start Fluentd:
fluentd -c fluent.conf -
Send a sample log:
curl -X POST -d 'json={"message":"Hello Fluentd!"}' http://localhost:8888/test.tag
You should see the log output in your console. From here, you can expand your configuration to collect and forward logs as needed.
Competitor Comparisons
Like Prometheus, but for logs.
Pros of Loki
- Designed for high-volume log storage and querying, optimized for cloud-native environments
- Integrates seamlessly with Grafana for powerful visualization and alerting
- Uses an efficient index-free log storage system, reducing storage costs
Cons of Loki
- Limited log parsing and transformation capabilities compared to Fluentd
- Fewer input and output plugins, potentially requiring additional tools for log collection
- Steeper learning curve for users not familiar with Prometheus-style querying
Code Comparison
Fluentd configuration example:
<source>
  @type tail
  path /var/log/nginx/access.log
  tag nginx.access
</source>

<match nginx.access>
  @type elasticsearch
  host elasticsearch.example.com
  port 9200
  index_name nginx-access
</match>
Loki configuration example:
scrape_configs:
  - job_name: nginx
    static_configs:
      - targets:
          - localhost
        labels:
          job: nginx
          __path__: /var/log/nginx/access.log
Both Fluentd and Loki are powerful log management tools, but they serve different purposes. Fluentd excels in log collection, parsing, and routing, while Loki focuses on efficient log storage and querying in cloud-native environments. The choice between them depends on specific use cases and existing infrastructure.
Logstash - transport and process your logs, events, or other data
Pros of Logstash
- Tighter integration with Elasticsearch and Kibana (ELK stack)
- More extensive plugin ecosystem
- Better support for complex data transformations
Cons of Logstash
- Higher resource consumption
- Steeper learning curve
- Less flexibility in output destinations
Code Comparison
Logstash configuration:
input {
  file {
    path => "/var/log/syslog"
    start_position => "beginning"
  }
}
output {
  elasticsearch {
    hosts => ["localhost:9200"]
  }
}
Fluentd configuration:
<source>
  @type tail
  path /var/log/syslog
  pos_file /var/log/td-agent/syslog.pos
  tag system.syslog
</source>
<match system.**>
  @type elasticsearch
  host localhost
  port 9200
</match>
Both Fluentd and Logstash are powerful log collection and processing tools. Fluentd is known for its lightweight nature and flexibility, while Logstash excels in complex data transformations and integration with the Elastic stack. Fluentd's configuration tends to be more concise and modular, while Logstash offers a more extensive DSL for data manipulation. The choice between the two often depends on specific use cases, existing infrastructure, and performance requirements.
The Prometheus monitoring system and time series database.
Pros of Prometheus
- Built-in visualization and alerting capabilities
- Powerful query language (PromQL) for data analysis
- Native support for multi-dimensional data and time series
Cons of Prometheus
- Less flexible for log aggregation compared to Fluentd
- Limited long-term storage options without additional components
- Steeper learning curve for complex setups
Code Comparison
Prometheus configuration (prometheus.yml):
scrape_configs:
  - job_name: 'node'
    static_configs:
      - targets: ['localhost:9100']
Fluentd configuration (fluent.conf):
<source>
  @type tail
  path /var/log/httpd-access.log
  tag apache.access
</source>
Summary
Prometheus excels in metrics collection and monitoring, offering robust querying and visualization tools. It's well-suited for cloud-native environments and microservices architectures. Fluentd, on the other hand, specializes in log collection and data aggregation, providing greater flexibility in handling various data formats and sources. While Prometheus configuration focuses on defining scrape targets, Fluentd's configuration revolves around defining input sources and output destinations for log data. The choice between the two depends on specific monitoring and data collection needs in your infrastructure.
Agent for collecting, processing, aggregating, and writing metrics, logs, and other arbitrary data.
Pros of Telegraf
- Written in Go, offering better performance and lower resource usage
- Supports a wider range of input plugins and data sources out-of-the-box
- Tighter integration with InfluxDB and the TICK stack
Cons of Telegraf
- Less flexible for complex log parsing and transformation scenarios
- Smaller community and ecosystem compared to Fluentd
- Limited output options compared to Fluentd's extensive plugin system
Code Comparison
Telegraf configuration (TOML):
[[inputs.cpu]]
  percpu = true
  totalcpu = true
  collect_cpu_time = false
  report_active = false
Fluentd configuration (Ruby):
<source>
  @type cpu
  tag cpu.stats
  interval 10s
</source>
Both Telegraf and Fluentd are powerful data collection and processing tools, but they have different strengths. Telegraf excels in metrics collection and is optimized for performance, while Fluentd is more versatile in log processing and data transformation. The choice between them depends on specific use cases and integration requirements within your infrastructure.
Convert  designs to code with AI

Introducing Visual Copilot: A new AI model to turn Figma designs to high quality code using your components.
Try Visual CopilotREADME
Fluentd: Open-Source Log Collector
![]()
![]()
Fluentd collects events from various data sources and writes them to files, RDBMS, NoSQL, IaaS, SaaS, Hadoop and so on. Fluentd helps you unify your logging infrastructure (Learn more about the Unified Logging Layer).
Quick Start
$ gem install fluentd
$ fluentd -s conf
$ fluentd -c conf/fluent.conf &
$ echo '{"json":"message"}' | fluent-cat debug.test
Development
Branch
- master: For v1 development.
- v0.12: For v0.12. This is deprecated version. we already stopped supporting (See https://www.fluentd.org/blog/drop-schedule-announcement-in-2019).
Prerequisites
- Ruby 3.2 or later
- git
git should be in PATH. On Windows, you can use Github for Windows and GitShell for easy setup.
Install dependent gems
Use bundler:
$ gem install bundler
$ bundle install --path vendor/bundle
Run test
$ bundle exec rake test
You can run specified test via TEST environment variable:
$ bundle exec rake test TEST=test/test_specified_path.rb
$ bundle exec rake test TEST=test/test_*.rb
More Information
- Website: https://www.fluentd.org/
- Documentation: https://docs.fluentd.org/
- Project repository: https://github.com/fluent
- Discussion: https://github.com/fluent/fluentd/discussions
- Slack / Community: https://slack.fluentd.org
- Newsletters: https://www.fluentd.org/newsletter
- Author: Sadayuki Furuhashi
- Copyright: 2011-2021 Fluentd Authors
- License: Apache License, Version 2.0
Security
A third party security audit was performed by Cure53, you can see the full report here.
See SECURITY to contact us about vulnerability.
Contributors:
Patches contributed by great developers.
Top Related Projects
Like Prometheus, but for logs.
Logstash - transport and process your logs, events, or other data
The Prometheus monitoring system and time series database.
Agent for collecting, processing, aggregating, and writing metrics, logs, and other arbitrary data.
Convert designs to code with AI
Introducing Visual Copilot: A new AI model to turn Figma designs to high quality code using your components.
Try Visual Copilot