
Top Related Projects

Stack trace visualizer

FlameScope is a visualization tool for exploring different time ranges as Flame Graphs.

🔥 Pyflame: A Ptracing Profiler For Python. This project is deprecated and not maintained.

pprof is a tool for visualization and analysis of profiling data

Deprecated Catapult GitHub. Please instead use http://crbug.com "Speed>Benchmarks" component for bugs and https://chromium.googlesource.com/catapult for downloading and editing source code..
Quick Overview
Speedscope is an interactive flamegraph visualizer for performance profiles. It's designed to help developers analyze and understand performance bottlenecks in their code by providing a visual representation of CPU time spent in different parts of the program.
Pros
- Web-based and platform-independent, making it accessible from any device with a modern web browser
- Supports multiple profile formats, including Chrome's .cpuprofile, Firefox's .profile, and V8's .cpuprofile
- Offers a responsive and interactive user interface for exploring performance data
- Open-source and actively maintained
Cons
- Requires uploading potentially sensitive performance data to a web service (if using the hosted version)
- May have a learning curve for users unfamiliar with flamegraph visualizations
- Limited customization options compared to some other profiling tools
Getting Started
To use Speedscope, you can either visit the hosted version at https://www.speedscope.app/ or run it locally:
-
Clone the repository:
git clone https://github.com/jlfwong/speedscope.git -
Install dependencies:
cd speedscope npm install -
Start the development server:
npm run dev -
Open your browser and navigate to
http://localhost:3000 -
Upload your performance profile or drag and drop it onto the page to start analyzing
Competitor Comparisons
Stack trace visualizer
Pros of FlameGraph
- Written in Perl, making it lightweight and easily portable
- Supports a wide range of input formats and profiling tools
- Highly customizable with various options for coloring and formatting
Cons of FlameGraph
- Requires command-line usage, which may be less user-friendly for some
- Generates static SVG output, lacking interactive features
- Requires additional tools or scripts for data preprocessing in some cases
Code Comparison
FlameGraph (Perl):
my $ypad1 = $fontsize * 4;
my $ypad2 = $fontsize * 2;
my $xpad = 10;
my $depthmax = (scalar(@Data) + 1) * $frameheight;
Speedscope (TypeScript):
const HEAP_PROFILE_TYPE = 'HEAP';
const TIME_PROFILE_TYPE = 'TIME';
export type ProfileType = typeof HEAP_PROFILE_TYPE | typeof TIME_PROFILE_TYPE;
While FlameGraph uses Perl for its implementation, Speedscope is built with TypeScript, offering type safety and modern JavaScript features. FlameGraph's code focuses on SVG generation, while Speedscope's code snippet demonstrates type definitions for profile types.
Both tools serve similar purposes but cater to different user preferences and use cases. FlameGraph excels in flexibility and broad input support, while Speedscope offers a more interactive, web-based experience.
FlameScope is a visualization tool for exploring different time ranges as Flame Graphs.
Pros of Flamescope
- Built by Netflix, potentially benefiting from their extensive experience in performance analysis
- Supports multiple input formats, including Linux perf and eBPF
- Offers a subsecond offset heatmap for identifying patterns in trace data
Cons of Flamescope
- Less actively maintained compared to Speedscope (last commit over 2 years ago)
- Limited to Python backend, which may not be ideal for all use cases
- Requires more setup and dependencies compared to Speedscope's standalone web app
Code Comparison
Flamescope (Python):
@app.route('/profile/<profile>')
def profile(profile):
    filename = secure_filename(profile)
    file_path = os.path.join(PROFILES_DIR, filename)
    if not os.path.isfile(file_path):
        return 'Profile not found', 404
    return send_file(file_path, mimetype='application/octet-stream')
Speedscope (TypeScript):
export function importFromChromeCPUProfile(
  chromeCPUProfile: ChromeCPUProfile
): Profile {
  const profile = new CallTreeProfileBuilder(chromeCPUProfile.endTime)
  convertChromeCPUProfile(chromeCPUProfile, profile)
  return profile.build()
}
Both projects aim to visualize performance profiles, but they differ in implementation and features. Speedscope offers a more modern, actively maintained solution with broader language support, while Flamescope provides unique features like subsecond offset heatmaps and benefits from Netflix's expertise in performance analysis.
🔥 Pyflame: A Ptracing Profiler For Python. This project is deprecated and not maintained.
Pros of pyflame
- Specifically designed for profiling Python code, offering deep insights into Python applications
- Low-overhead profiling, suitable for production environments
- Supports profiling of multi-threaded Python applications
Cons of pyflame
- Limited to Python profiling, while speedscope is language-agnostic
- Less actively maintained compared to speedscope
- Requires root access or special permissions to run, which may be a security concern
Code Comparison
pyflame example:
import pyflame

pyflame.start()
# Your Python code here
pyflame.stop()
speedscope example (using JavaScript):
const speedscope = require('speedscope')

speedscope.start()
// Your code here (any language)
speedscope.stop()
Note: speedscope doesn't have a direct code integration like pyflame. It typically works with profile data generated by other tools.
Summary
pyflame is a specialized Python profiler with low overhead, ideal for production environments. However, it's limited to Python and requires special permissions. speedscope, on the other hand, is a versatile, language-agnostic profiler visualization tool that can work with various profiling data formats but doesn't provide direct profiling capabilities.
pprof is a tool for visualization and analysis of profiling data
Pros of pprof
- More comprehensive profiling tool with support for multiple languages (Go, C++, Java)
- Integrated with Google's performance tools ecosystem
- Offers both command-line and web interface options for analysis
Cons of pprof
- Steeper learning curve due to more complex features
- May be overkill for simple profiling needs
- Requires additional setup for non-Go languages
Code Comparison
pprof (Go):
import "net/http/pprof"

func main() {
    go func() {
        log.Println(http.ListenAndServe("localhost:6060", nil))
    }()
    // Rest of the application code
}
speedscope (JavaScript):
const { writeFileSync } = require('fs');
const speedscope = require('speedscope');

const profile = speedscope.formatTrace(/* your trace data */);
writeFileSync('profile.speedscope.json', JSON.stringify(profile));
Summary
pprof is a more feature-rich and versatile profiling tool, suitable for complex projects and multiple languages. It offers deeper integration with Google's performance tools but may be more challenging to set up and use.
speedscope, on the other hand, is a simpler, web-based flame graph viewer that focuses on providing an easy-to-use interface for visualizing performance data. It's more accessible for quick profiling tasks but may lack some advanced features found in pprof.
Deprecated Catapult GitHub. Please instead use http://crbug.com "Speed>Benchmarks" component for bugs and https://chromium.googlesource.com/catapult for downloading and editing source code..
Pros of Catapult
- More comprehensive performance analysis tools, including tracing and benchmarking
- Integrated with Chrome DevTools for browser-based performance analysis
- Supports a wider range of performance data formats and sources
Cons of Catapult
- Larger and more complex project, potentially harder to set up and use
- Primarily focused on Chrome and web-based performance analysis
- May have a steeper learning curve for new users
Code Comparison
Speedscope (JavaScript):
export function importFromChromeCPUProfile(content: string | ArrayBuffer): Profile {
  let json = typeof content === 'string' ? JSON.parse(content) : content
  return importFromChromeTimeline([json])
}
Catapult (Python):
def ImportFromChromeCPUProfile(profile_data):
  trace_data = json.loads(profile_data)
  return timeline_model.TimelineModel(trace_data)
Both projects provide functionality to import Chrome CPU profiles, but Catapult's implementation is part of a larger, more complex system for performance analysis.
Convert  designs to code with AI

Introducing Visual Copilot: A new AI model to turn Figma designs to high quality code using your components.
Try Visual CopilotREADME
English | ç®ä½ä¸æ
ð¬speedscope
A fast, interactive web-based viewer for performance profiles. Supports import from a variety of profiles in a variety of languages (JS, Ruby, Python, Go & more). Try it here: https://www.speedscope.app
Given raw profiling data, speedscope allows you to interactively explore the data to get insight into what's slow in your application, or allocating all the memory, or whatever data is represented in the profiling data.
Supported file formats
speedscope is designed to ingest profiles from a variety of different profilers for different programming languages & environments. Click the links below for documentation on how to import from a specific source.
- JavaScript
- Ruby
- Python
- PHP
- Go
- Rust
- Java
- Erlang/Elixir
- Native code
- Importing from Instruments.app (macOS)
- Importing from
perf(linux)
- Importing from .NET Core
- Importing from GHC (Haskell)
- Importing from custom sources
Contributions to add support for additional formats are welcome! See issues with the "import source" tag.
Usage
Visit https://www.speedscope.app, then either browse to find a profile file or drag-and-drop one onto the page. The profiles are not uploaded anywhere -- the application is totally in-browser.
Command line usage
For offline use, or convenience in the terminal, you can also install speedscope via npm:
npm install -g speedscope
Invoking speedscope /path/to/profile will load speedscope in your default browser.
Self-contained directory
If you don't have npm or node installed, you can also download a
self-contained version from https://github.com/jlfwong/speedscope/releases.
After you download the zip file from a release, simply unzip it and open the
contained index.html in Chrome or Firefox.
Importing via URL
To load a specific profile by URL, you can append a hash fragment like #profileURL=[URL-encoded profile URL]&title=[URL-encoded custom title]. Note that the server hosting the profile must have CORS configured to allow AJAX requests from speedscope.
Views
ð°Time Order
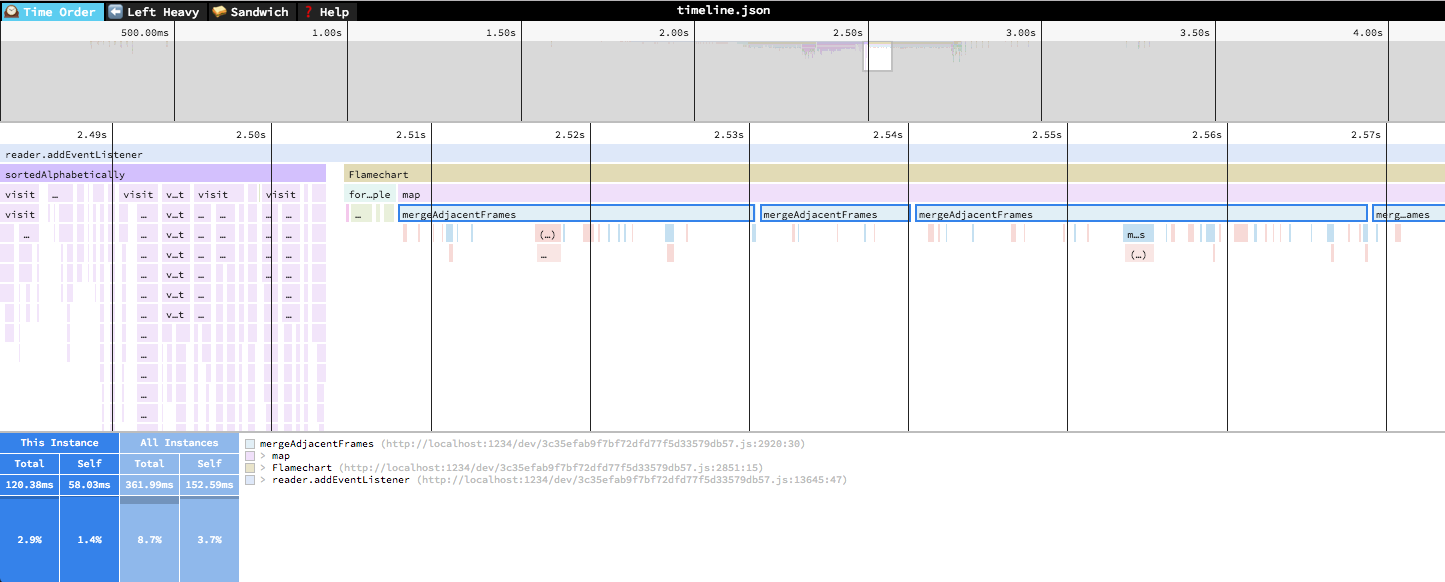
In the "Time Order" view (the default), call stacks are ordered left-to-right in the same order as they occurred in the input file, which is usually going to be the chronological order they were recorded in. This view is most helpful for understanding the behavior of an application over time, e.g. "first the data is fetched from the database, then the data is prepared for serialization, then the data is serialized to JSON".
The horizontal axis represents the "weight" of each stack (most commonly CPU time), and the vertical axis shows you the stack active at the time of the sample. If you click on one of the frames, you'll be able to see summary statistics about it.
⬠ï¸Left Heavy
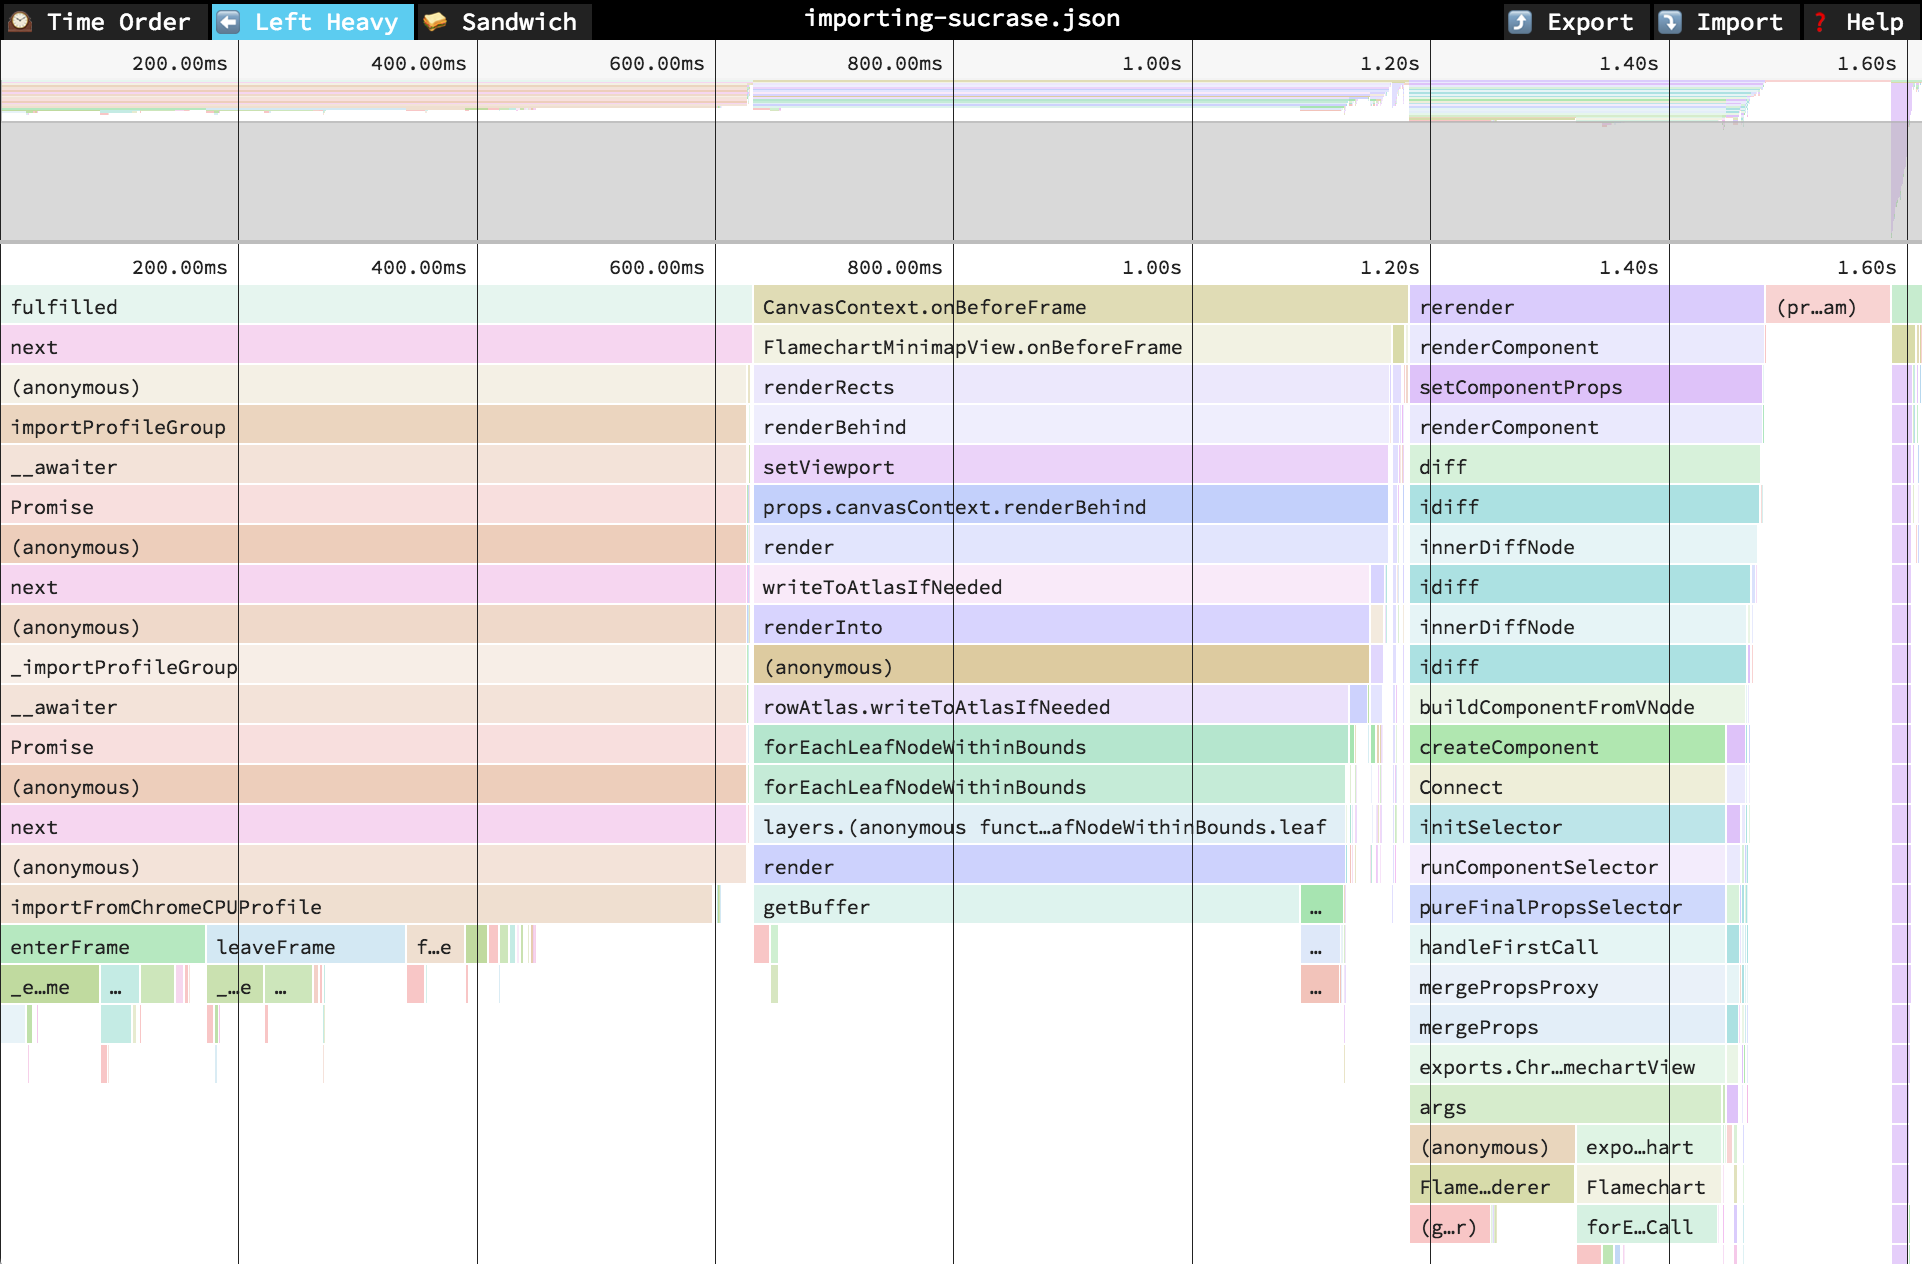
In the "Left Heavy" view, identical stacks are grouped together, regardless of whether they were recorded sequentially. Then, the stacks are sorted so that the heaviest stack for each parent is on the left -- hence "left heavy". This view is useful for understanding where all the time is going in situations where there are hundreds or thousands of function calls interleaved between other call stacks.
𥪠Sandwich
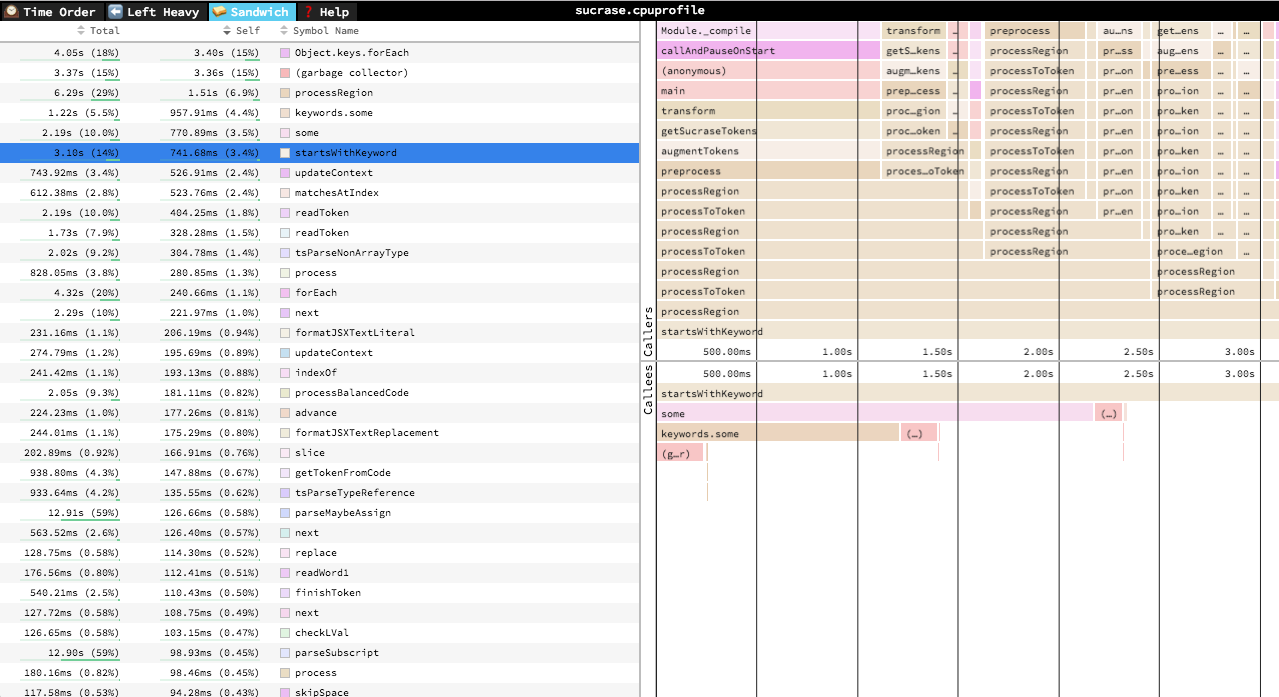
The Sandwich view is a table view in which you can find a list of all functions and their associated times. You can sort by self time or total time. It's called "Sandwich" view because if you select one of the rows in the table, you can see flamegraphs for all the callers and callees of the selected row.
Navigation
Once a profile has loaded, the main view is split into two: the top area is the "minimap", and the bottom area is the "stack view".
Minimap Navigation
- Scroll on either axis to pan around
- Click and drag to narrow your view to a specific range
Stack View Navigation
- Scroll on either axis to pan around
- Pinch to zoom
- Hold Cmd+Scroll to zoom
- Double click on a frame to fit the viewport to it
- Click on a frame to view summary statistics about it
Keyboard Navigation
+: zoom in-: zoom out0: zoom out to see the entire profilew/a/s/dor arrow keys: pan around the profile1: Switch to the "Time Order" view2: Switch to the "Left Heavy" view3: Switch to the "Sandwich" viewr: Collapse recursion in the flamegraphsCmd+S/Ctrl+Sto save the current profileCmd+O/Ctrl+Oto open a new profilen: Go to next profile/thread if one is availablep: Go to previous profile/thread if one is availablet: Open the profile/thread selector if availableCmd+F/Ctrl+F: to open search. While open,EnterandShift+Entercycle through results
Contributing
Do you want to contribute to speedscope? Sweeeeet. Check out CONTRIBUTING.md for instructions on setting up your dev environment.
Top Related Projects
Stack trace visualizer
FlameScope is a visualization tool for exploring different time ranges as Flame Graphs.
🔥 Pyflame: A Ptracing Profiler For Python. This project is deprecated and not maintained.
pprof is a tool for visualization and analysis of profiling data
Deprecated Catapult GitHub. Please instead use http://crbug.com "Speed>Benchmarks" component for bugs and https://chromium.googlesource.com/catapult for downloading and editing source code..
Convert designs to code with AI
Introducing Visual Copilot: A new AI model to turn Figma designs to high quality code using your components.
Try Visual Copilot