Top Related Projects
Status Page for monitoring your websites and applications with beautiful graphs, analytics, and plugins. Run on any type of environment.
Open-source cron job and background task monitoring service, written in Python & Django
Apprise - Push Notifications that work with just about every platform!
⛑ Automated developer-oriented status page
Glances an Eye on your system. A top/htop alternative for GNU/Linux, BSD, Mac OS and Windows operating systems.
The open and composable observability and data visualization platform. Visualize metrics, logs, and traces from multiple sources like Prometheus, Loki, Elasticsearch, InfluxDB, Postgres and many more.
Quick Overview
Uptime Kuma is a self-hosted monitoring tool designed to track the uptime and performance of websites, APIs, and other network services. It offers a user-friendly interface, real-time alerts, and detailed status pages, making it an excellent choice for both personal and professional use.
Pros
- Easy to set up and use, with a clean and intuitive web interface
- Supports various monitoring types, including HTTP(S), TCP, DNS, and more
- Offers flexible notification options, including email, Telegram, Discord, and custom webhooks
- Completely free and open-source, with active community support
Cons
- Requires self-hosting, which may be challenging for non-technical users
- Limited advanced features compared to some enterprise-level monitoring solutions
- May require additional setup for high-availability configurations
- Documentation could be more comprehensive for complex scenarios
Getting Started
To get started with Uptime Kuma, follow these steps:
- Install Docker on your system if not already installed.
- Run the following command to start Uptime Kuma:
docker run -d --restart=always -p 3001:3001 -v uptime-kuma:/app/data --name uptime-kuma louislam/uptime-kuma:1
- Access the web interface at
http://your-server-ip:3001. - Set up your first monitor by clicking "Add New Monitor" and following the prompts.
For more detailed instructions and configuration options, refer to the official documentation on the GitHub repository.
Competitor Comparisons
Status Page for monitoring your websites and applications with beautiful graphs, analytics, and plugins. Run on any type of environment.
Pros of Statping
- More extensive API documentation and support
- Built-in notification services for various platforms
- Advanced user management and role-based access control
Cons of Statping
- Less active development and community support
- More complex setup and configuration process
- Limited built-in themes and customization options
Code Comparison
Statping (Go):
func (s *Service) Check(guard bool) {
    if guard {
        s.checkGuard <- struct{}{}
        defer func() { <-s.checkGuard }()
    }
    s.RecheckFailure()
    s.UpdateStats()
    s.LastCheck = time.Now()
    s.Checkpoint = s.LastCheck
}
Uptime Kuma (JavaScript):
async check(checkType, url, config) {
    const startTime = Date.now();
    try {
        const result = await this.makeRequest(checkType, url, config);
        this.handleSuccess(result, startTime);
    } catch (error) {
        this.handleFailure(error, startTime);
    }
}
Both repositories offer uptime monitoring solutions, but they differ in implementation and features. Statping provides more built-in notification options and user management, while Uptime Kuma offers a simpler setup and more active community support. The code comparison shows Statping's use of Go with concurrent checks, while Uptime Kuma uses JavaScript with async/await for handling requests.
Open-source cron job and background task monitoring service, written in Python & Django
Pros of Healthchecks
- More mature project with a longer development history
- Offers a hosted solution in addition to self-hosting options
- Supports a wider range of notification channels
Cons of Healthchecks
- Less user-friendly interface compared to Uptime Kuma
- Requires more setup and configuration
- Limited built-in monitoring options for websites and services
Code Comparison
Healthchecks (Python):
@csrf_exempt
def ping(request, code):
    check = get_object_or_404(Check, code=code)
    check.n_pings = F("n_pings") + 1
    check.last_ping = timezone.now()
    check.save()
    return HttpResponse("OK")
Uptime Kuma (JavaScript):
async ping(monitorID) {
    const monitor = await this.getMonitor(monitorID);
    const startTime = Date.now();
    const result = await this.checkMonitor(monitor);
    const latency = Date.now() - startTime;
    await this.sendNotification(monitor, result, latency);
    return result;
}
Both projects aim to provide uptime monitoring solutions, but they differ in their approach and implementation. Healthchecks focuses on cron job and scheduled task monitoring, while Uptime Kuma offers a more general-purpose uptime monitoring solution with a user-friendly interface. The code snippets demonstrate the different languages and approaches used in each project, with Healthchecks using Python and Django, and Uptime Kuma using JavaScript and Node.js.
Apprise - Push Notifications that work with just about every platform!
Pros of Apprise
- Supports a wider range of notification services (80+)
- More lightweight and focused solely on notifications
- Can be easily integrated into other applications as a library
Cons of Apprise
- Lacks built-in monitoring capabilities
- No web-based GUI for configuration and management
- Requires more technical knowledge to set up and use effectively
Code Comparison
Apprise (Python):
import apprise

apobj = apprise.Apprise()
apobj.add('mailto://user:pass@gmail.com')
apobj.notify(
    body='Hello World',
    title='My notification title',
)
Uptime Kuma (JavaScript):
const UptimeKuma = require('uptime-kuma-api');

const kuma = new UptimeKuma('http://localhost:3001');
await kuma.login('username', 'password');
await kuma.addMonitor({
    name: 'My Website',
    url: 'https://example.com',
    type: 'http',
});
Summary
Apprise is a powerful notification library supporting numerous services, while Uptime Kuma is a comprehensive uptime monitoring solution with a user-friendly interface. Apprise excels in flexibility and integration capabilities, whereas Uptime Kuma offers a more complete monitoring package out of the box. The choice between them depends on whether you need a dedicated notification system or a full-featured uptime monitoring tool.
⛑ Automated developer-oriented status page
Pros of Gatus
- Lightweight and efficient, with minimal resource usage
- Supports a wide range of monitoring protocols and custom checks
- Easily configurable using YAML files
Cons of Gatus
- Less user-friendly interface compared to Uptime Kuma
- Limited built-in notification options
- Lacks some advanced features like maintenance windows
Code Comparison
Gatus configuration (YAML):
endpoints:
  - name: my-website
    url: https://example.com
    interval: 5m
    conditions:
      - "[STATUS] == 200"
Uptime Kuma configuration (JSON):
{
  "type": "http",
  "name": "My Website",
  "url": "https://example.com",
  "interval": 300,
  "maxretries": 0
}
Both Gatus and Uptime Kuma are open-source monitoring tools, but they have different approaches. Gatus focuses on simplicity and efficiency, using YAML configuration files and supporting various monitoring protocols. It's lightweight and easily integrable into existing systems.
Uptime Kuma, on the other hand, offers a more user-friendly interface with a modern dashboard. It provides additional features like status pages and more notification options out of the box. However, it may require more resources to run compared to Gatus.
The choice between the two depends on specific needs: Gatus for a lightweight, customizable solution, or Uptime Kuma for a more feature-rich, user-friendly experience.
Glances an Eye on your system. A top/htop alternative for GNU/Linux, BSD, Mac OS and Windows operating systems.
Pros of Glances
- More comprehensive system monitoring, including CPU, memory, disk, network, and processes
- Cross-platform support for various operating systems (Linux, macOS, Windows)
- Extensible plugin system for custom metrics and integrations
Cons of Glances
- Lacks specific uptime monitoring and alerting features
- No built-in status page generation for public viewing
- More complex setup and configuration compared to Uptime Kuma
Code Comparison
Glances (Python):
from glances_api import Glances

glances = Glances()
cpu_percent = glances.getCpu()
print(f"CPU Usage: {cpu_percent}%")
Uptime Kuma (JavaScript):
const Monitor = require('./monitor');

const monitor = new Monitor({
  name: 'Example Website',
  url: 'https://example.com',
  interval: 60
});

monitor.start();
While both projects focus on monitoring, they serve different purposes. Glances is a comprehensive system monitoring tool, providing detailed information about various system resources. Uptime Kuma, on the other hand, specializes in uptime monitoring and status page generation for websites and services. The code examples reflect these differences, with Glances retrieving system metrics and Uptime Kuma setting up a website monitor.
The open and composable observability and data visualization platform. Visualize metrics, logs, and traces from multiple sources like Prometheus, Loki, Elasticsearch, InfluxDB, Postgres and many more.
Pros of Grafana
- More comprehensive data visualization and analytics capabilities
- Supports a wider range of data sources and integrations
- Highly customizable dashboards with advanced querying options
Cons of Grafana
- Steeper learning curve and more complex setup
- Requires more resources to run and maintain
- May be overkill for simple uptime monitoring needs
Code Comparison
Uptime Kuma (JavaScript):
async function checkCertificate(hostname, port) {
    try {
        const tlsOptions = {
            host: hostname,
            port: port,
            rejectUnauthorized: false,
        };
        const socket = tls.connect(tlsOptions);
        // ... (certificate checking logic)
    } catch (error) {
        // ... (error handling)
    }
}
Grafana (Go):
func (s *Service) CheckHealth(ctx context.Context) *backend.CheckHealthResult {
    var status = backend.HealthStatusOk
    var message = "Data source is working"

    if _, err := s.getDatasource(ctx); err != nil {
        status = backend.HealthStatusError
        message = err.Error()
    }

    return &backend.CheckHealthResult{
        Status:  status,
        Message: message,
    }
}
Both repositories focus on monitoring and visualization, but Grafana offers a more robust and feature-rich platform for data analysis and dashboard creation. Uptime Kuma, on the other hand, provides a simpler and more focused solution for uptime monitoring. The code snippets demonstrate the different languages and approaches used in each project, with Uptime Kuma using JavaScript for certificate checking and Grafana using Go for health checks.
Convert  designs to code with AI

Introducing Visual Copilot: A new AI model to turn Figma designs to high quality code using your components.
Try Visual CopilotREADME
Uptime Kuma
Uptime Kuma is an easy-to-use self-hosted monitoring tool.
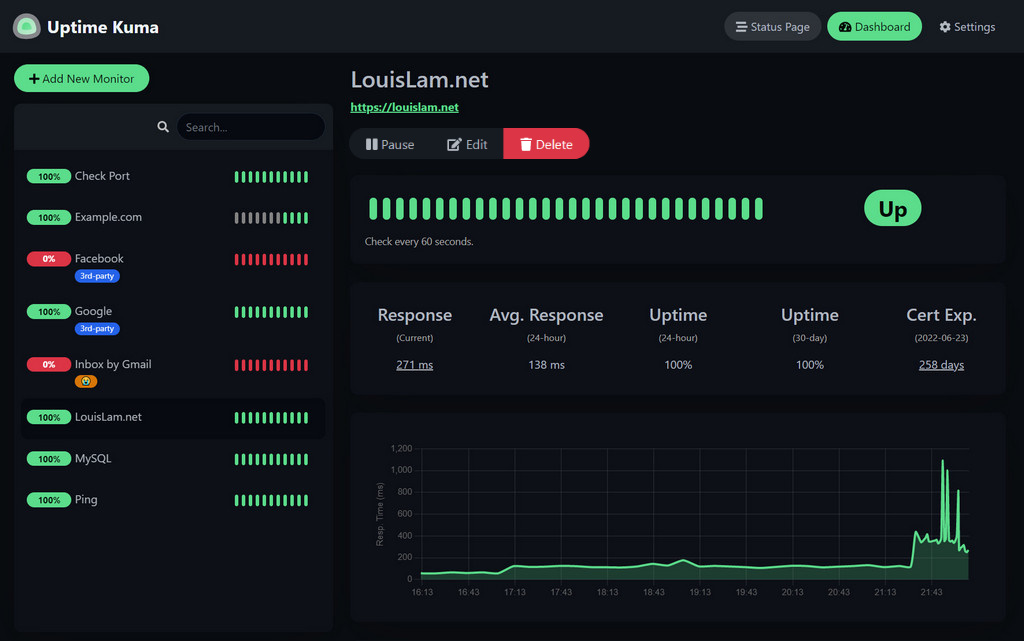
ð¥ Live Demo
Try it!
Demo Server (Location: Frankfurt - Germany): https://demo.kuma.pet/start-demo
It is a temporary live demo, all data will be deleted after 10 minutes. Sponsored by Uptime Kuma Sponsors.
â Features
- Monitoring uptime for HTTP(s) / TCP / HTTP(s) Keyword / HTTP(s) Json Query / Ping / DNS Record / Push / Steam Game Server / Docker Containers
- Fancy, Reactive, Fast UI/UX
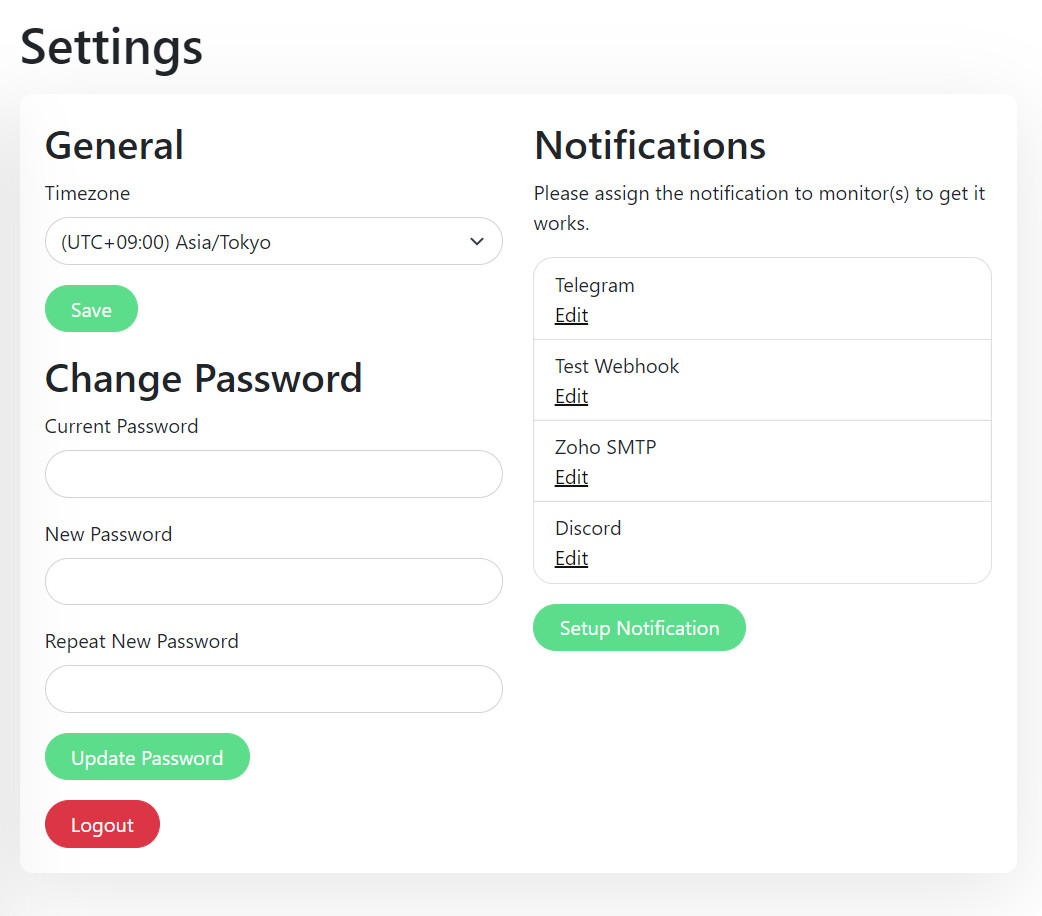
- Notifications via Telegram, Discord, Gotify, Slack, Pushover, Email (SMTP), and 90+ notification services, click here for the full list
- 20-second intervals
- Multi Languages
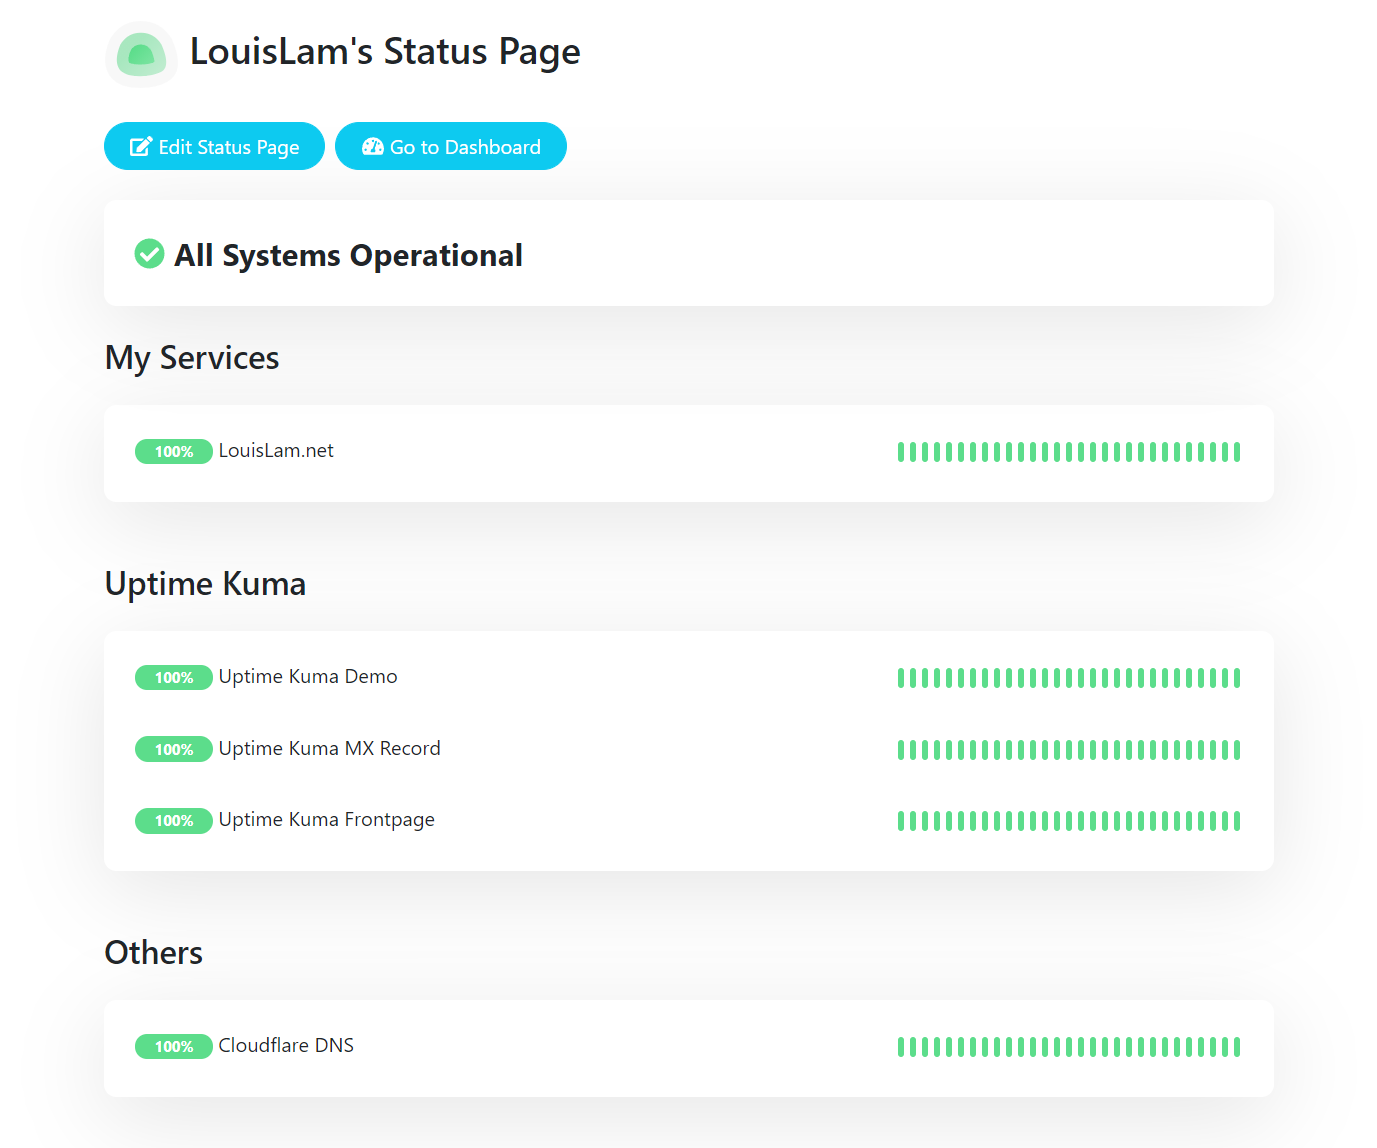
- Multiple status pages
- Map status pages to specific domains
- Ping chart
- Certificate info
- Proxy support
- 2FA support
ð§ How to Install
ð³ Docker
docker run -d --restart=always -p 3001:3001 -v uptime-kuma:/app/data --name uptime-kuma louislam/uptime-kuma:1
Uptime Kuma is now running on http://0.0.0.0:3001.
[!WARNING] File Systems like NFS (Network File System) are NOT supported. Please map to a local directory or volume.
[!NOTE] If you want to limit exposure to localhost (without exposing port for other users or to use a reverse proxy), you can expose the port like this:
docker run -d --restart=always -p 127.0.0.1:3001:3001 -v uptime-kuma:/app/data --name uptime-kuma louislam/uptime-kuma:1
ðªð» Non-Docker
Requirements:
- Platform
- â Major Linux distros such as Debian, Ubuntu, CentOS, Fedora and ArchLinux etc.
- â Windows 10 (x64), Windows Server 2012 R2 (x64) or higher
- â FreeBSD / OpenBSD / NetBSD
- â Replit / Heroku
- Node.js 18 / 20.4
- npm 9
- Git
- pm2 - For running Uptime Kuma in the background
git clone https://github.com/louislam/uptime-kuma.git
cd uptime-kuma
npm run setup

# Option 1. Try it
node server/server.js

# (Recommended) Option 2. Run in the background using PM2
# Install PM2 if you don't have it:
npm install pm2 -g && pm2 install pm2-logrotate

# Start Server
pm2 start server/server.js --name uptime-kuma
Uptime Kuma is now running on http://localhost:3001
More useful PM2 Commands
# If you want to see the current console output
pm2 monit

# If you want to add it to startup
pm2 save && pm2 startup
Advanced Installation
If you need more options or need to browse via a reverse proxy, please read:
https://github.com/louislam/uptime-kuma/wiki/%F0%9F%94%A7-How-to-Install
ð How to Update
Please read:
https://github.com/louislam/uptime-kuma/wiki/%F0%9F%86%99-How-to-Update
ð What's Next?
I will assign requests/issues to the next milestone.
https://github.com/louislam/uptime-kuma/milestones
â¤ï¸ Sponsors
Thank you so much! (GitHub Sponsors will be updated manually. OpenCollective sponsors will be updated automatically, the list will be cached by GitHub though. It may need some time to be updated)
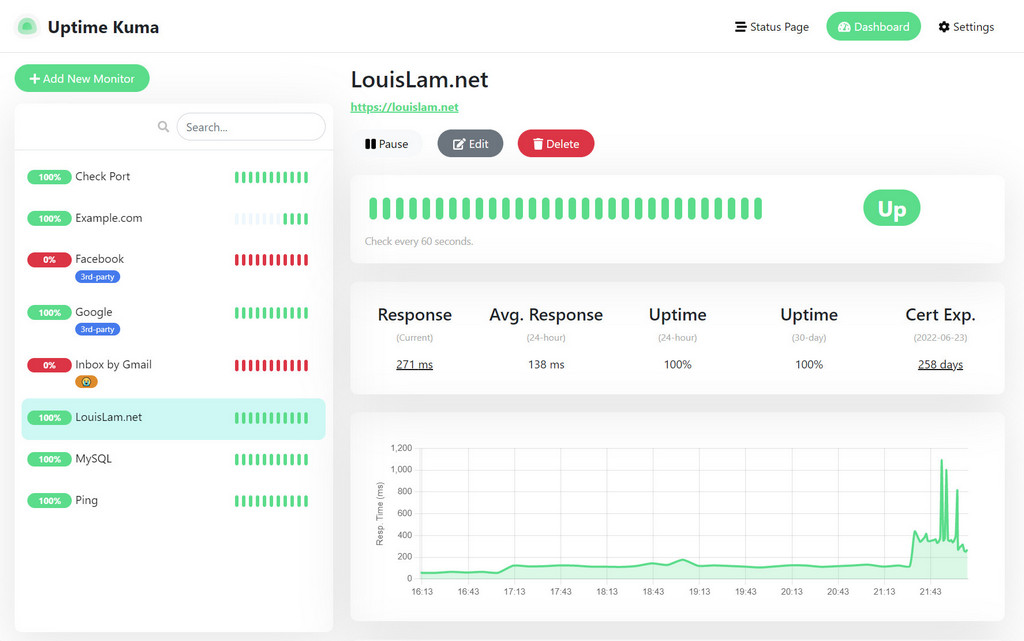
ð¼ More Screenshots
Light Mode:
Status Page:
Settings Page:
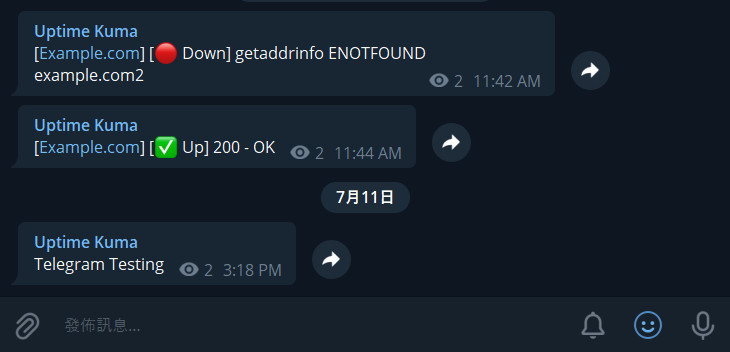
Telegram Notification Sample:
Motivation
- I was looking for a self-hosted monitoring tool like "Uptime Robot", but it is hard to find a suitable one. One of the closest ones is statping. Unfortunately, it is not stable and no longer maintained.
- Wanted to build a fancy UI.
- Learn Vue 3 and vite.js.
- Show the power of Bootstrap 5.
- Try to use WebSocket with SPA instead of a REST API.
- Deploy my first Docker image to Docker Hub.
If you love this project, please consider giving it a â.
ð£ï¸ Discussion / Ask for Help
â ï¸ For any general or technical questions, please don't send me an email, as I am unable to provide support in that manner. I will not respond if you ask questions there.
I recommend using Google, GitHub Issues, or Uptime Kuma's subreddit for finding answers to your question. If you cannot find the information you need, feel free to ask:
My Reddit account: u/louislamlam You can mention me if you ask a question on the subreddit.
Contributions
Create Pull Requests
We DO NOT accept all types of pull requests and do not want to waste your time. Please be sure that you have read and follow pull request rules: CONTRIBUTING.md#can-i-create-a-pull-request-for-uptime-kuma
Test Pull Requests
There are a lot of pull requests right now, but I don't have time to test them all.
If you want to help, you can check this: https://github.com/louislam/uptime-kuma/wiki/Test-Pull-Requests
Test Beta Version
Check out the latest beta release here: https://github.com/louislam/uptime-kuma/releases
Bug Reports / Feature Requests
If you want to report a bug or request a new feature, feel free to open a new issue.
Translations
If you want to translate Uptime Kuma into your language, please visit Weblate Readme.
Spelling & Grammar
Feel free to correct the grammar in the documentation or code. My mother language is not English and my grammar is not that great.
Top Related Projects
Status Page for monitoring your websites and applications with beautiful graphs, analytics, and plugins. Run on any type of environment.
Open-source cron job and background task monitoring service, written in Python & Django
Apprise - Push Notifications that work with just about every platform!
⛑ Automated developer-oriented status page
Glances an Eye on your system. A top/htop alternative for GNU/Linux, BSD, Mac OS and Windows operating systems.
The open and composable observability and data visualization platform. Visualize metrics, logs, and traces from multiple sources like Prometheus, Loki, Elasticsearch, InfluxDB, Postgres and many more.
Convert  designs to code with AI

Introducing Visual Copilot: A new AI model to turn Figma designs to high quality code using your components.
Try Visual Copilot


