 mapbox-gl-js
Interactive, thoroughly customizable maps in the browser, powered by vector tiles and WebGL
Top Related Projects

OpenLayers

🍃 JavaScript library for mobile-friendly interactive maps 🇺🇦

WebGL2 powered visualization framework

An open-source JavaScript library for world-class 3D globes and maps :earth_americas:

Vector and raster maps with GL styles. Server side rendering by MapLibre GL Native. Map tile server for MapLibre GL JS, Android, iOS, Leaflet, OpenLayers, GIS via WMTS, etc.

WebGL map rendering engine for creative cartography
Quick Overview
Mapbox GL JS is a JavaScript library for interactive, customizable vector maps on the web. It uses WebGL for fast rendering of maps, allowing for smooth zooming and tilting. The library is part of the Mapbox ecosystem, providing developers with tools to create rich, responsive map experiences.
Pros
- High performance with WebGL rendering
- Extensive customization options for map styles and features
- Supports both vector and raster tiles
- Large community and ecosystem of plugins
Cons
- Requires a Mapbox access token, which may have usage limits
- Learning curve can be steep for advanced customizations
- Some features may require paid plans for high-volume usage
- Limited offline capabilities compared to some alternatives
Code Examples
Creating a basic map:
mapboxgl.accessToken = 'YOUR_MAPBOX_ACCESS_TOKEN';
const map = new mapboxgl.Map({
    container: 'map', // container ID
    style: 'mapbox://styles/mapbox/streets-v11', // style URL
    center: [-74.5, 40], // starting position [lng, lat]
    zoom: 9 // starting zoom
});
Adding a marker to the map:
const marker = new mapboxgl.Marker()
    .setLngLat([-74.5, 40])
    .addTo(map);
Changing the map style:
map.setStyle('mapbox://styles/mapbox/satellite-v9');
Getting Started
- Sign up for a Mapbox account and get an access token.
- Include the Mapbox GL JS library in your HTML:
<script src='https://api.mapbox.com/mapbox-gl-js/v2.9.1/mapbox-gl.js'></script>
<link href='https://api.mapbox.com/mapbox-gl-js/v2.9.1/mapbox-gl.css' rel='stylesheet' />
- Create a container for the map:
<div id='map' style='width: 400px; height: 300px;'></div>
- Initialize the map in your JavaScript:
mapboxgl.accessToken = 'YOUR_MAPBOX_ACCESS_TOKEN';
const map = new mapboxgl.Map({
    container: 'map',
    style: 'mapbox://styles/mapbox/streets-v11',
    center: [-74.5, 40],
    zoom: 9
});
- Customize and add features to your map as needed.
Competitor Comparisons
OpenLayers
Pros of OpenLayers
- Completely free and open-source, with no usage limits or API keys required
- Supports a wider range of data formats and projections out-of-the-box
- More extensive documentation and examples for advanced use cases
Cons of OpenLayers
- Steeper learning curve, especially for beginners
- Less optimized for mobile devices and touch interactions
- Larger file size, which can impact load times for web applications
Code Comparison
OpenLayers:
import Map from 'ol/Map';
import View from 'ol/View';
import TileLayer from 'ol/layer/Tile';
import OSM from 'ol/source/OSM';

const map = new Map({
  layers: [new TileLayer({ source: new OSM() })],
  target: 'map',
  view: new View({ center: [0, 0], zoom: 2 })
});
Mapbox GL JS:
mapboxgl.accessToken = 'YOUR_ACCESS_TOKEN';
const map = new mapboxgl.Map({
  container: 'map',
  style: 'mapbox://styles/mapbox/streets-v11',
  center: [0, 0],
  zoom: 2
});
Both libraries offer powerful mapping capabilities, but OpenLayers provides more flexibility and customization options at the cost of complexity, while Mapbox GL JS offers a more streamlined experience with better performance on mobile devices. The choice between them depends on specific project requirements and developer preferences.
🍃 JavaScript library for mobile-friendly interactive maps 🇺🇦
Pros of Leaflet
- Lightweight and simple to use, with a smaller learning curve
- More flexible and customizable, allowing easier integration of third-party plugins
- Open-source with a large community, leading to extensive documentation and support
Cons of Leaflet
- Less advanced 3D mapping capabilities compared to Mapbox GL JS
- Limited built-in features for complex data visualizations
- Performance may degrade with large datasets or numerous markers
Code Comparison
Leaflet:
var map = L.map('map').setView([51.505, -0.09], 13);
L.tileLayer('https://{s}.tile.openstreetmap.org/{z}/{x}/{y}.png', {
    attribution: '© OpenStreetMap contributors'
}).addTo(map);
Mapbox GL JS:
mapboxgl.accessToken = 'YOUR_ACCESS_TOKEN';
var map = new mapboxgl.Map({
    container: 'map',
    style: 'mapbox://styles/mapbox/streets-v11',
    center: [-0.09, 51.505],
    zoom: 13
});
Both libraries offer easy map initialization, but Mapbox GL JS requires an access token and uses a more modern, WebGL-based approach. Leaflet's syntax is slightly simpler and more intuitive for beginners, while Mapbox GL JS provides more advanced styling options out of the box.
WebGL2 powered visualization framework
Pros of deck.gl
- Specializes in large-scale data visualization with WebGL
- Offers a wide range of customizable layer types for different data visualizations
- Integrates well with React and other frameworks
Cons of deck.gl
- Steeper learning curve for developers new to WebGL or data visualization
- Less comprehensive mapping features compared to Mapbox GL JS
- May require additional libraries for full-featured map applications
Code Comparison
deck.gl example:
import {Deck} from '@deck.gl/core';
import {ScatterplotLayer} from '@deck.gl/layers';

new Deck({
  layers: [new ScatterplotLayer({data, getPosition: d => d.coordinates})]
});
Mapbox GL JS example:
mapboxgl.accessToken = 'YOUR_ACCESS_TOKEN';
const map = new mapboxgl.Map({
  container: 'map',
  style: 'mapbox://styles/mapbox/streets-v11'
});
deck.gl focuses on creating data visualization layers, while Mapbox GL JS provides a more complete map rendering solution out of the box. deck.gl offers greater flexibility for custom visualizations, but Mapbox GL JS is often easier to set up for standard mapping applications. Both libraries have their strengths, and the choice between them depends on the specific requirements of your project.
An open-source JavaScript library for world-class 3D globes and maps :earth_americas:
Pros of Cesium
- Specialized for 3D geospatial visualization and analysis
- Supports time-dynamic data and terrain rendering
- Open-source with an active community
Cons of Cesium
- Steeper learning curve for beginners
- Larger file size and potentially higher resource usage
- Less extensive styling options compared to Mapbox GL JS
Code Comparison
Cesium:
const viewer = new Cesium.Viewer('cesiumContainer');
viewer.scene.globe.enableLighting = true;
const entity = viewer.entities.add({
  position: Cesium.Cartesian3.fromDegrees(-75.59777, 40.03883),
  point: { pixelSize: 10, color: Cesium.Color.RED }
});
Mapbox GL JS:
mapboxgl.accessToken = 'your-access-token';
const map = new mapboxgl.Map({
  container: 'map',
  style: 'mapbox://styles/mapbox/streets-v11',
  center: [-75.59777, 40.03883],
  zoom: 9
});
Both Cesium and Mapbox GL JS are powerful mapping libraries, but they cater to different use cases. Cesium excels in 3D geospatial visualization and analysis, making it ideal for applications requiring complex terrain rendering and time-dynamic data. On the other hand, Mapbox GL JS offers a more streamlined experience for 2D mapping with extensive styling options and better performance for simpler use cases. The choice between the two depends on the specific requirements of your project.
Vector and raster maps with GL styles. Server side rendering by MapLibre GL Native. Map tile server for MapLibre GL JS, Android, iOS, Leaflet, OpenLayers, GIS via WMTS, etc.
Pros of tileserver-gl
- Self-hosted solution, offering more control over data and infrastructure
- Supports multiple vector tile formats, including MBTiles and GeoJSON
- Provides a built-in map viewer for easy visualization and testing
Cons of tileserver-gl
- Less extensive documentation and community support compared to mapbox-gl-js
- Limited styling options and customization features out-of-the-box
- May require more setup and configuration for advanced use cases
Code Comparison
mapbox-gl-js:
mapboxgl.accessToken = 'your-access-token';
const map = new mapboxgl.Map({
    container: 'map',
    style: 'mapbox://styles/mapbox/streets-v11',
    center: [-74.5, 40],
    zoom: 9
});
tileserver-gl:
const map = new maplibregl.Map({
    container: 'map',
    style: 'http://localhost:8080/styles/osm-bright/style.json',
    center: [-74.5, 40],
    zoom: 9
});
Both repositories provide powerful tools for working with vector tiles and creating interactive maps. mapbox-gl-js offers a more comprehensive solution with extensive documentation and features, while tileserver-gl provides a self-hosted alternative with greater control over data and infrastructure. The choice between the two depends on specific project requirements, desired level of customization, and infrastructure preferences.
WebGL map rendering engine for creative cartography
Pros of Tangram
- More flexible styling options with custom shaders and scene files
- Lighter weight and potentially faster rendering for simpler maps
- Open-source with a more permissive license (MIT)
Cons of Tangram
- Smaller community and ecosystem compared to Mapbox GL JS
- Less comprehensive documentation and learning resources
- Fewer built-in features and controls out of the box
Code Comparison
Mapbox GL JS:
mapboxgl.accessToken = 'your-access-token';
const map = new mapboxgl.Map({
    container: 'map',
    style: 'mapbox://styles/mapbox/streets-v11',
    center: [-74.5, 40],
    zoom: 9
});
Tangram:
var map = L.map('map');
var layer = Tangram.leafletLayer({
    scene: 'scene.yaml',
    attribution: '...'
});
layer.addTo(map);
map.setView([40.70531, -74.00976], 13);
Both libraries offer powerful mapping capabilities, but Mapbox GL JS provides a more comprehensive solution with extensive documentation and features. Tangram, on the other hand, offers more flexibility in styling and rendering, making it suitable for projects requiring custom map designs or lighter-weight solutions. The choice between the two depends on specific project requirements, desired customization level, and available resources for implementation and maintenance.
Convert  designs to code with AI

Introducing Visual Copilot: A new AI model to turn Figma designs to high quality code using your components.
Try Visual CopilotREADME
![]()
Mapbox GL JS is a JavaScript library for interactive, customizable vector maps on the web. It takes map styles that conform to the Mapbox Style Specification, applies them to vector tiles that conform to the Mapbox Vector Tile Specification, and renders them using WebGL.
Mapbox GL JS is part of the cross-platform Mapbox GL ecosystem, which also includes compatible native SDKs for applications on Android, iOS, macOS, Qt, and React Native. Mapbox provides building blocks to add location features like maps, search, and navigation into any experience you create. To get started with GL JS or any of our other building blocks, sign up for a Mapbox account.
In addition to GL JS, this repository contains code, issues, and test fixtures that are common to both GL JS and the native SDKs. For code and issues specific to the native SDKs, see the mapbox/mapbox-gl-native repository.
- Getting started with Mapbox GL JS
- Tutorials
- API documentation
- Examples
- Style documentation
- Open source styles
- Contributor documentation
- Browser Data Storage
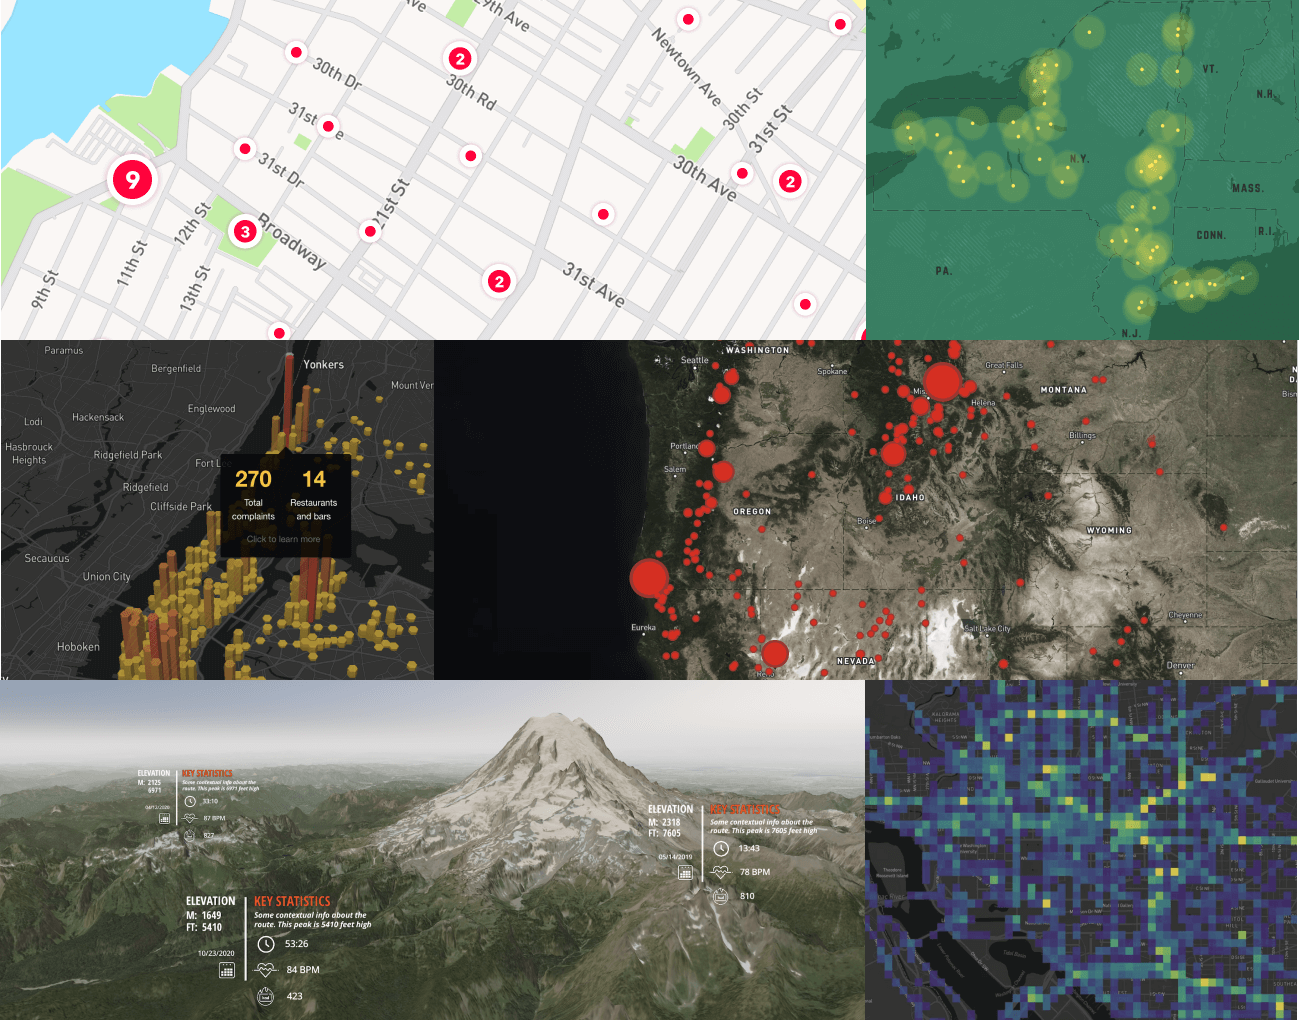
Caption: (Mapbox GL JS maps, left-to-right, top-to-bottom): Custom styled point clusters, custom style with points, hexbin visualization on a Dark style map with Popups, data-driven circles over a raster layer with satellite imagery, 3D terrain with custom Markers, Mapbox Movement data visualization.
License
Mapbox Web SDK
Copyright © 2021 - 2023 Mapbox, Inc. All rights reserved.
The software and files in this repository (collectively, âSoftwareâ) are licensed under the Mapbox TOS for use only with the relevant Mapbox product(s) listed at www.mapbox.com/pricing. This license allows developers with a current active Mapbox account to use and modify the authorized portions of the Software as needed for use only with the relevant Mapbox product(s) through their Mapbox account in accordance with the Mapbox TOS. This license terminates automatically if a developer no longer has a Mapbox account in good standing or breaches the Mapbox TOS. For the license terms, please see the Mapbox TOS at https://www.mapbox.com/legal/tos/ which incorporates the Mapbox Product Terms at www.mapbox.com/legal/service-terms. If this Software is a SDK, modifications that change or interfere with marked portions of the code related to billing, accounting, or data collection are not authorized and the SDK sends limited de-identified location and usage data which is used in accordance with the Mapbox TOS. [Updated 2023-01]
Top Related Projects
OpenLayers
🍃 JavaScript library for mobile-friendly interactive maps 🇺🇦
WebGL2 powered visualization framework
An open-source JavaScript library for world-class 3D globes and maps :earth_americas:
Vector and raster maps with GL styles. Server side rendering by MapLibre GL Native. Map tile server for MapLibre GL JS, Android, iOS, Leaflet, OpenLayers, GIS via WMTS, etc.
WebGL map rendering engine for creative cartography
Convert designs to code with AI
Introducing Visual Copilot: A new AI model to turn Figma designs to high quality code using your components.
Try Visual Copilot