
Top Related Projects

COVID-19 App

Tracking the impact of COVID-19 in India

Novel Coronavirus (COVID-19) Cases, provided by JHU CSSE

API for Current cases and more stuff about COVID-19 and Influenza

A repository of data on coronavirus cases and deaths in the U.S.
Quick Overview
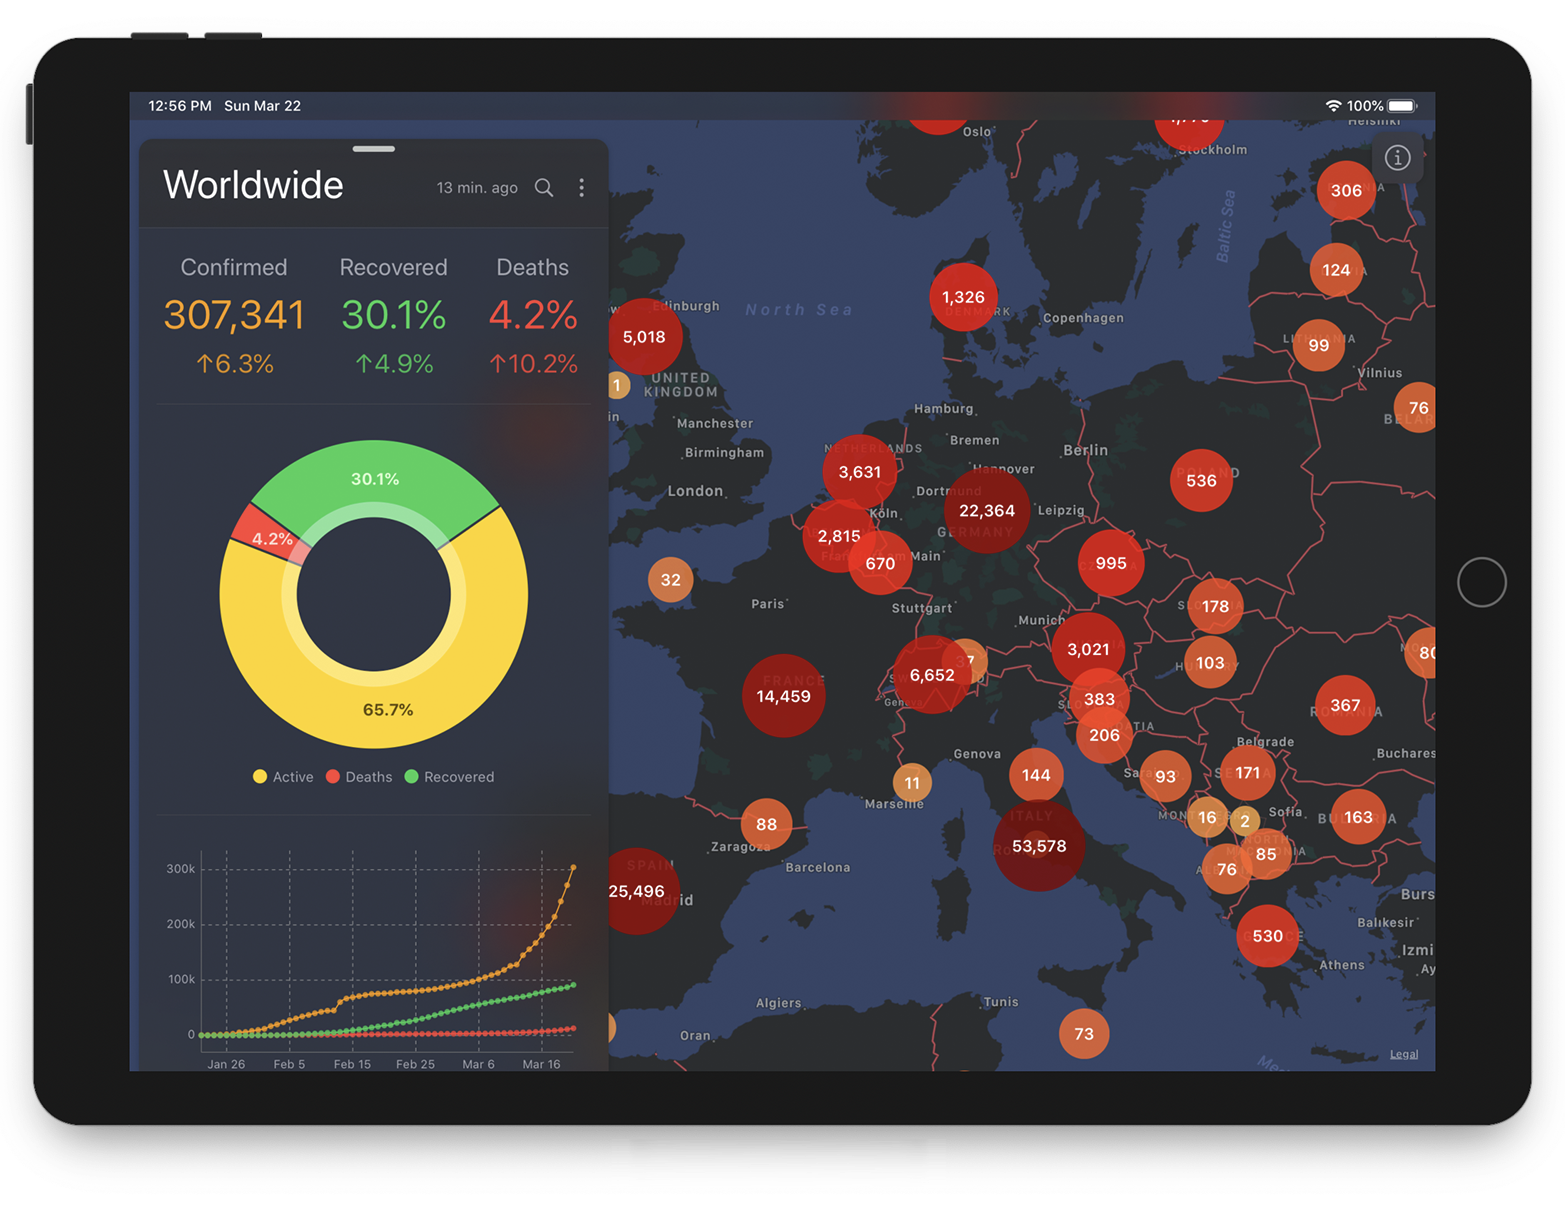
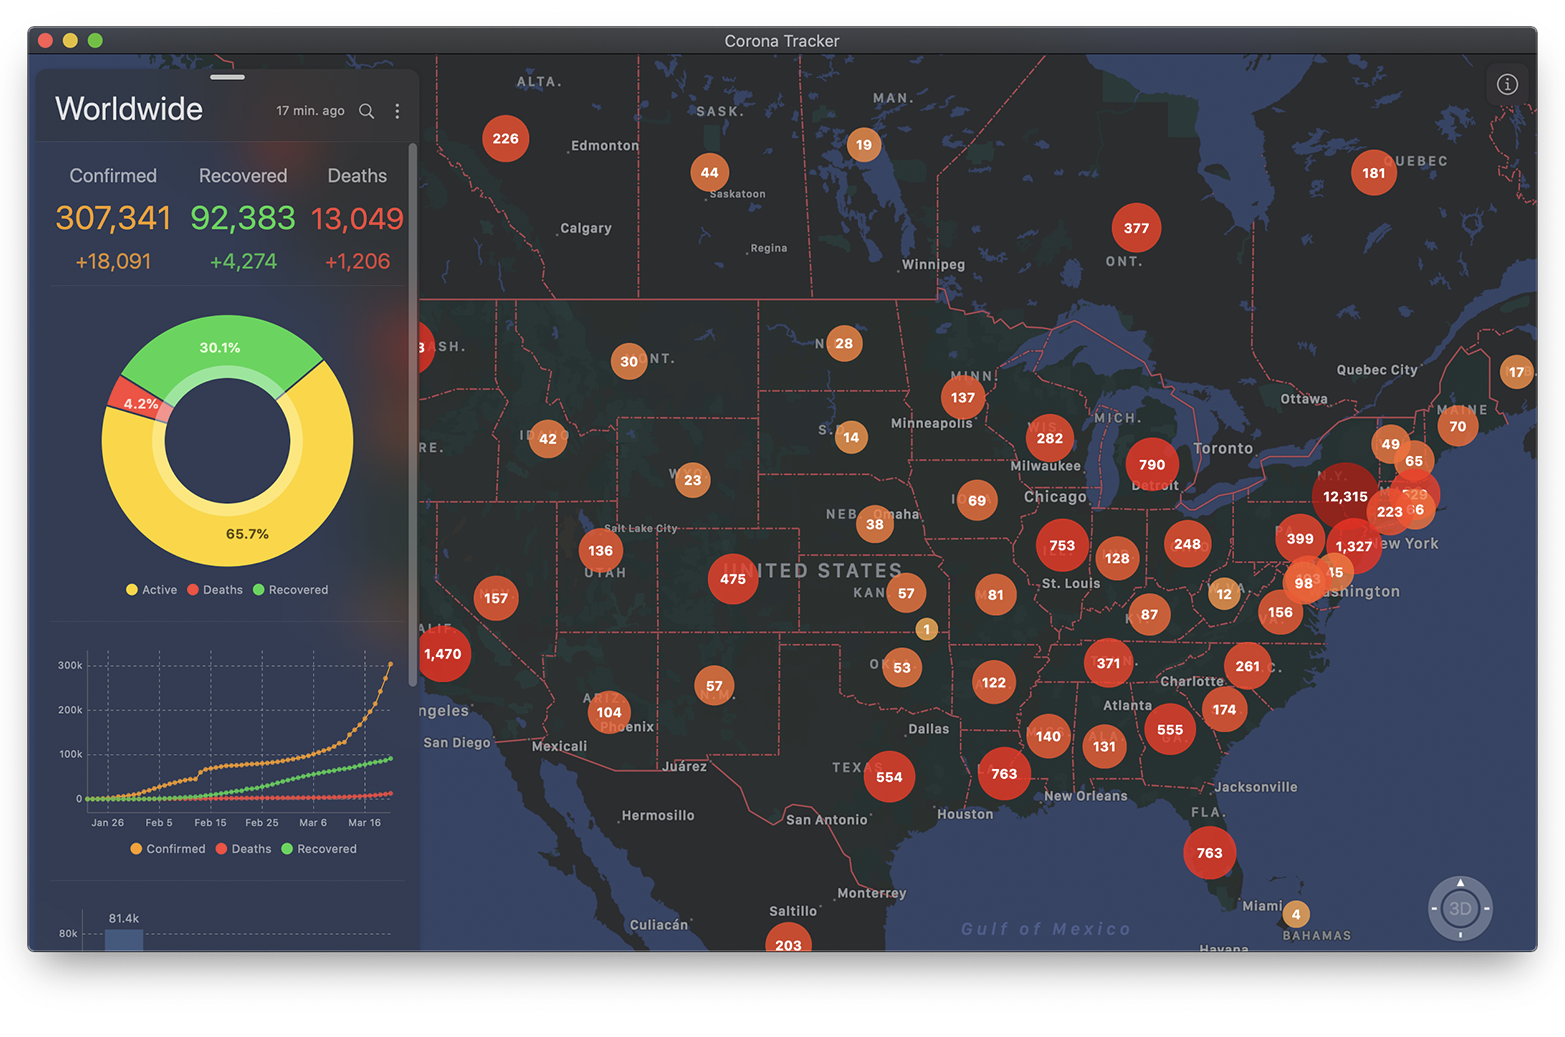
CoronaTracker is an open-source iOS app that provides real-time statistics and information about the COVID-19 pandemic. It offers a user-friendly interface to track cases, deaths, and recoveries globally and for specific countries. The app is built using SwiftUI and combines data from multiple reliable sources.
Pros
- Built with SwiftUI, showcasing modern iOS development practices
- Provides real-time data from multiple trusted sources
- Offers both global and country-specific statistics
- Features an intuitive and visually appealing user interface
Cons
- Limited to iOS devices, excluding Android and web users
- May require frequent updates to maintain data accuracy as the pandemic situation evolves
- Potential for information overload, which could be overwhelming for some users
Code Examples
Here are a few code examples from the CoronaTracker project:
- Fetching data from an API:
func fetchData() {
    isLoading = true
    api.fetchReports { result in
        self.isLoading = false
        switch result {
        case .success(let reports):
            self.allReports = reports
        case .failure(let error):
            self.errorMessage = error.localizedDescription
        }
    }
}
- Updating the UI with new data:
struct ReportView: View {
    @ObservedObject var report: Report

    var body: some View {
        VStack {
            Text("Confirmed: \(report.confirmed)")
            Text("Deaths: \(report.deaths)")
            Text("Recovered: \(report.recovered)")
        }
    }
}
- Implementing a search function:
func search() {
    if searchText.isEmpty {
        filteredCountries = countries
    } else {
        filteredCountries = countries.filter { $0.name.lowercased().contains(searchText.lowercased()) }
    }
}
Getting Started
To get started with CoronaTracker:
-
Clone the repository:
git clone https://github.com/mhdhejazi/CoronaTracker.git -
Open the project in Xcode:
cd CoronaTracker open CoronaTracker.xcodeproj -
Build and run the project on your iOS device or simulator.
Note: Make sure you have Xcode installed and are running the latest version compatible with the project.
Competitor Comparisons
COVID-19 App
Pros of WHO app
- Official WHO-backed application, potentially providing more authoritative information
- Likely has access to a wider range of global health data and resources
- May offer more comprehensive features beyond just tracking COVID-19 cases
Cons of WHO app
- Less frequently updated compared to CoronaTracker
- Potentially more complex and slower to load due to broader scope
- May have a steeper learning curve for users seeking quick, straightforward information
Code comparison
CoronaTracker:
struct GlobalStats: Codable {
    let confirmed: Int
    let recovered: Int
    let deaths: Int
    let critical: Int
    let lastUpdate: Date
}
WHO app:
class CaseStats {
  final int cases;
  final int deaths;
  final int recovered;
  final DateTime lastUpdated;

  CaseStats({this.cases, this.deaths, this.recovered, this.lastUpdated});
}
Both repositories use similar data structures for tracking case statistics, with CoronaTracker implemented in Swift and the WHO app in Dart. The WHO app's structure is slightly simpler, omitting the "critical" cases field present in CoronaTracker.
Tracking the impact of COVID-19 in India
Pros of covid19india-react
- More comprehensive data visualization for India-specific COVID-19 statistics
- Active community with frequent updates and contributions
- Responsive design optimized for mobile devices
Cons of covid19india-react
- Limited to India-specific data, not suitable for global tracking
- More complex codebase, potentially harder to maintain
- Heavier reliance on external APIs and data sources
Code Comparison
CoronaTracker (Swift):
func updateCountryList() {
    CountryController.shared.getCountries { [weak self] result in
        switch result {
        case .success(let countries):
            self?.countries = countries.sorted()
            self?.tableView.reloadData()
        case .failure(let error):
            print("Error fetching countries:", error)
        }
    }
}
covid19india-react (JavaScript):
const fetchData = async () => {
  try {
    const [{ data: statesDailyResponse }, { data: zonesResponse }] = await Promise.all([
      axios.get('https://api.covid19india.org/states_daily.json'),
      axios.get('https://api.covid19india.org/zones.json'),
    ]);
    setStatesDaily(statesDailyResponse.states_daily);
    setZones(zonesResponse.zones);
  } catch (err) {
    console.log(err);
  }
};
Novel Coronavirus (COVID-19) Cases, provided by JHU CSSE
Pros of COVID-19
- Comprehensive global dataset with daily updates
- Widely recognized and used by researchers and organizations
- Includes time series data for confirmed cases, deaths, and recoveries
Cons of COVID-19
- Raw data format requires processing for visualization
- Limited built-in analysis tools or visualizations
- May have occasional data inconsistencies or reporting delays
Code Comparison
COVID-19 (data format example):
Province/State,Country/Region,Lat,Long,Date,Confirmed,Deaths,Recovered
New York,US,40.7128,-74.0060,2023-04-15,1234567,98765,1111111
CoronaTracker (Swift code snippet):
struct Country: Codable {
    let name: String
    let confirmed: Int
    let deaths: Int
    let recovered: Int
    let latitude: Double
    let longitude: Double
}
CoronaTracker provides a more structured data model and a user-friendly iOS app for tracking COVID-19 statistics. It offers features like maps, charts, and notifications. However, it may not be as frequently updated or comprehensive as the COVID-19 repository.
COVID-19 is primarily a data source, while CoronaTracker is an application that utilizes similar data. The COVID-19 repository is more suitable for researchers and developers who need raw data for analysis or integration into their own projects. CoronaTracker is better for end-users who want a ready-to-use application for monitoring COVID-19 statistics on their iOS devices.
API for Current cases and more stuff about COVID-19 and Influenza
Pros of API
- More comprehensive data sources, covering multiple diseases and health-related statistics
- Regularly updated and maintained with a larger community of contributors
- Offers a well-documented RESTful API for easy integration into various applications
Cons of API
- Lacks a user-friendly graphical interface for data visualization
- May require more technical knowledge to implement and use effectively
- Focuses primarily on data provision rather than analysis or prediction
Code Comparison
CoronaTracker (Swift):
struct GlobalStats: Codable {
    let confirmed: Int
    let recovered: Int
    let deaths: Int
    let date: Date
}
API (JavaScript):
const globalData = async () => {
  const { data } = await axios.get(`${baseUrl}/all`);
  return {
    cases: data.cases,
    deaths: data.deaths,
    recovered: data.recovered,
    updated: data.updated
  };
};
Both repositories provide COVID-19 data, but API offers a more versatile solution for developers seeking to integrate health-related data into their applications. CoronaTracker, on the other hand, provides a more user-friendly interface for iOS users to track COVID-19 statistics. The code comparison shows how each project structures its data, with CoronaTracker using Swift for iOS development and API utilizing JavaScript for its server-side implementation.
A repository of data on coronavirus cases and deaths in the U.S.
Pros of covid-19-data
- Comprehensive and regularly updated dataset covering US states and counties
- Clear data format with CSV files for easy analysis and integration
- Includes additional data like excess deaths and mask mandates
Cons of covid-19-data
- Focused solely on data, lacking visualization or analysis tools
- Limited to US data, not providing global coverage
- Requires users to process and interpret the raw data themselves
Code Comparison
CoronaTracker (Swift):
func fetchData() {
    let url = URL(string: "https://corona.lmao.ninja/v2/countries")!
    URLSession.shared.dataTask(with: url) { (data, response, error) in
        // Process and update UI with fetched data
    }.resume()
}
covid-19-data (Python):
import pandas as pd

def load_us_state_data():
    url = "https://raw.githubusercontent.com/nytimes/covid-19-data/master/us-states.csv"
    df = pd.read_csv(url)
    return df
The code snippets highlight the different approaches: CoronaTracker focuses on fetching and displaying data in a mobile app, while covid-19-data provides raw data for users to analyze using tools like pandas.
Convert  designs to code with AI

Introducing Visual Copilot: A new AI model to turn Figma designs to high quality code using your components.
Try Visual CopilotREADME


Features
- Live data: Shows the most recent data, and updates automatically.
- Distribution map with two levels of details:
- Countries: When the user zooms out. Fewer details and reduced clutter.
- Cities: When the user zooms in. More details.
- Charts:
- Current state chart for all countries (and cities).
- Timeline chart for all countries (and cities).
- Top affected countries chart with info about every country.
- Daily new cases shows how fast the virus is spreading in a given country.
- Cases since the 100th case how fast the virus is spreading in different countries.
- Option for using a logarithmic scale.
- Search for countries & cities.
- Share stats & charts as images.
- Today widget for worldwide stats.
- Red color scale: Reflects the number of confirmed cases. In addition to increasing circle size.
- Statistics: Including the number of confirmed, recovered, and deaths, in addition to percents.
- iPad & macOS support.
How to Use
1. iOS & macOS App
Build from source code
- Clone/Download the repo.
- Open
Corona.xcodeprojin Xcode. - Choose the right target (iOS or macOS).
- Build & run!
2. macOS App
Download the latest release for macOS.
Or install via brew:
brew cask install corona-tracker
Contribute
Please feel free to contribute pull requests or create issues for bugs and feature requests.
Author
Mhd Hejazi (contact@samabox.com)
Credits
Data
- Johns Hopkins University Center for Systems Science and Engineering (JHU CSSE)
- Robert Koch Institute (RKI)
- Bundesministeriums für Soziales, Gesundheit, Pflege und Konsumentenschutz (BMSGPK)
- Bing COVID-19 Tracker (Bing)
Features
- Today widget by Piotr Ożóg.
Data Sources
- State-level data for Germany by Manuel Carrasco Molina.
- State-level data for Austria by Patrick Steiner.
Translations
- German by Sebastian Binder, Jakob Fuchs
- Swedish by Swedish Power Tech AB
- Portuguese by Pedro Paulo Amorim
- Italian by Ale
- French by Clément Knoderer, Paul de Laage
- Russian by Mikhail Akopov
- Chinese, Simplified by Erick Li
- Spanish by Emily Jewik
- Japanese by Sorachi Kato
- Polish by Piotr Ożóg
- Dutch by Heidi Duchting
- Romanian by Andrei Ciobanu
- Korean by Lee Gwang Yong
- Arabic by Hussam Zain
- Norwegian Bokmål by Allan Nordhøy
- Indonesian by Niko Tidar Lantang Perkasa
- Danish by Per Meldgaard
- Chinese, Traditional (Taiwan) by @League2EB
- Turkish by Nesim Tunç
- Hungarian by @BrotherLouie
- Ukrainian by Valeriy Soglaev
- Albanian by Lori K.
- Greek by Kyriakos Markakis
- Kurdish by Rawaz Mahmud
- Croatian by Nikola FraniÄeviÄ
Libraries
- CSV.swift: For parsing the CSV data file.
- Charts: Beautiful and powerful charts.
- FloatingPanel: For the bottom sheet.
- Disk: Simplifies loading/saving files.
Top Related Projects
COVID-19 App
Tracking the impact of COVID-19 in India
Novel Coronavirus (COVID-19) Cases, provided by JHU CSSE
API for Current cases and more stuff about COVID-19 and Influenza
A repository of data on coronavirus cases and deaths in the U.S.
Convert designs to code with AI
Introducing Visual Copilot: A new AI model to turn Figma designs to high quality code using your components.
Try Visual Copilot