
Top Related Projects

Generation of diagrams like flowcharts or sequence diagrams from text in a similar manner as markdown

Generate diagrams from textual description

draw.io is a JavaScript, client-side editor for general diagramming.

D2 is a modern diagram scripting language that turns text to diagrams.

Virtual whiteboard for sketching hand-drawn like diagrams

Structurizr DSL
Quick Overview
Diagrams is a Python library for creating cloud system architecture diagrams as code. It allows users to create complex diagrams programmatically, supporting various cloud providers, on-premise infrastructure, and SaaS offerings. The library aims to make it easy for developers and system architects to create, maintain, and version control their system diagrams.
Pros
- Easy to use and intuitive API for creating diagrams
- Supports a wide range of cloud providers and services
- Diagrams can be version-controlled alongside code
- Highly customizable with options for styling and layout
Cons
- Limited to static diagrams; no interactive or dynamic elements
- Requires knowledge of Python programming
- May have a steeper learning curve for non-programmers
- Limited export options (primarily PNG and DOT formats)
Code Examples
- Creating a simple AWS diagram:
from diagrams import Diagram
from diagrams.aws.compute import EC2
from diagrams.aws.database import RDS
from diagrams.aws.network import ELB

with Diagram("Web Service", show=False):
    ELB("lb") >> EC2("web") >> RDS("userdb")
- Creating a multi-cloud diagram:
from diagrams import Diagram, Cluster
from diagrams.aws.compute import ECS
from diagrams.azure.database import CosmosDB
from diagrams.gcp.analytics import BigQuery

with Diagram("Multi-Cloud", show=False):
    with Cluster("AWS"):
        ecs = ECS("ECS")

    with Cluster("Azure"):
        cosmos = CosmosDB("CosmosDB")

    with Cluster("GCP"):
        bq = BigQuery("BigQuery")

    ecs >> cosmos >> bq
- Creating a custom styled diagram:
from diagrams import Diagram, Edge
from diagrams.aws.compute import EC2
from diagrams.aws.database import RDS

graph_attr = {
    "fontsize": "45",
    "bgcolor": "transparent"
}

with Diagram("Styled Diagram", show=False, graph_attr=graph_attr):
    EC2("web") >> Edge(color="red", style="dotted") >> RDS("db")
Getting Started
To get started with Diagrams, follow these steps:
-
Install the library:
pip install diagrams -
Import the necessary modules:
from diagrams import Diagram from diagrams.aws.compute import EC2 from diagrams.aws.database import RDS -
Create a simple diagram:
with Diagram("My Architecture", show=True):
    EC2("Web Server") >> RDS("Database")
This will create a basic diagram with an EC2 instance connected to an RDS database and automatically open the resulting PNG file.
Competitor Comparisons
Generation of diagrams like flowcharts or sequence diagrams from text in a similar manner as markdown
Pros of Mermaid
- Browser-based rendering, no external dependencies
- Supports a wider variety of diagram types (e.g., Gantt charts, user journeys)
- Easier integration with Markdown and documentation tools
Cons of Mermaid
- Less flexibility in customizing diagram aesthetics
- Limited support for complex cloud architecture diagrams
- Steeper learning curve for advanced features
Code Comparison
Mermaid:
graph TD
    A[Client] --> B[Load Balancer]
    B --> C[Server1]
    B --> D[Server2]
Diagrams:
from diagrams import Diagram
from diagrams.aws.compute import EC2
from diagrams.aws.network import ELB

with Diagram("Simple Web Service", show=False):
    ELB("lb") >> [EC2("web1"),
                  EC2("web2"),
                  EC2("web3")]
Both Mermaid and Diagrams offer powerful diagramming capabilities, but they cater to different use cases. Mermaid excels in quick, text-based diagrams integrated into documentation, while Diagrams provides more detailed and customizable cloud architecture diagrams using Python code.
Generate diagrams from textual description
Pros of PlantUML
- Text-based diagram creation with a simple syntax
- Supports a wide variety of diagram types (sequence, class, use case, etc.)
- Can be integrated into various tools and platforms
Cons of PlantUML
- Requires Java runtime environment
- Limited customization options for diagram aesthetics
- Steeper learning curve for complex diagrams
Code Comparison
PlantUML:
@startuml
Alice -> Bob: Hello
Bob --> Alice: Hi there
@enduml
Diagrams:
from diagrams import Diagram
from diagrams.aws.compute import EC2

with Diagram("Simple Diagram"):
    EC2("Web Server")
Key Differences
- PlantUML uses a custom syntax, while Diagrams uses Python code
- PlantUML generates various diagram types, Diagrams focuses on cloud architecture
- PlantUML requires external rendering, Diagrams generates images directly
Use Cases
- PlantUML: General-purpose diagramming, software design, UML diagrams
- Diagrams: Cloud architecture, infrastructure-as-code visualization
Community and Ecosystem
- PlantUML: Larger community, extensive documentation, various integrations
- Diagrams: Growing community, focused on cloud providers, Python ecosystem
draw.io is a JavaScript, client-side editor for general diagramming.
Pros of draw.io
- User-friendly graphical interface for creating diagrams
- Supports a wide range of diagram types and templates
- Can be used online or as a desktop application
Cons of draw.io
- Requires manual placement and connection of elements
- Less suitable for programmatically generating diagrams
- May be overkill for simple infrastructure diagrams
Code Comparison
draw.io is primarily a graphical tool, so there's no direct code comparison. However, here's an example of how you might define a simple diagram in Diagrams:
from diagrams import Diagram
from diagrams.aws.compute import EC2
from diagrams.aws.database import RDS

with Diagram("Simple Web Service", show=False):
    EC2("Web Server") >> RDS("Database")
Key Differences
- Diagrams is Python-based and integrates well with infrastructure-as-code workflows
- draw.io offers more flexibility for general-purpose diagramming
- Diagrams excels at creating cloud architecture diagrams programmatically
- draw.io provides a more traditional drag-and-drop diagramming experience
Both tools have their strengths, with Diagrams being more focused on cloud architecture and infrastructure diagrams, while draw.io is a versatile general-purpose diagramming tool.
D2 is a modern diagram scripting language that turns text to diagrams.
Pros of d2
- Supports a wider range of diagram types, including flowcharts, sequence diagrams, and entity-relationship diagrams
- Offers a more flexible and expressive domain-specific language (DSL) for diagram creation
- Provides a built-in live editor for real-time diagram visualization and editing
Cons of d2
- Steeper learning curve due to its more complex DSL syntax
- Lacks native integration with cloud service providers, unlike diagrams which has built-in support for AWS, Azure, and GCP icons
Code Comparison
d2:
shape: sequence_diagram
alice -> bob: Hello
bob -> charlie: Hi
charlie -> alice: Greetings
diagrams:
from diagrams import Diagram
from diagrams.aws.compute import EC2
from diagrams.aws.database import RDS

with Diagram("Web Service", show=False):
    EC2("web") >> RDS("userdb")
Summary
d2 offers more flexibility and diagram types but has a steeper learning curve. diagrams excels in cloud architecture diagrams with its built-in provider integrations. Choose based on your specific diagramming needs and preferred syntax style.
Virtual whiteboard for sketching hand-drawn like diagrams
Pros of Excalidraw
- User-friendly web-based interface for creating hand-drawn style diagrams
- Collaborative features allowing real-time editing with multiple users
- Exports diagrams in various formats (PNG, SVG, JSON)
Cons of Excalidraw
- Limited to general-purpose diagramming, not specialized for cloud architecture
- Requires manual drawing of elements, which can be time-consuming for complex diagrams
Code Comparison
Excalidraw is primarily a web-based tool, so there's no direct code comparison. However, here's an example of how to embed Excalidraw in a web application:
import { Excalidraw } from "@excalidraw/excalidraw";

function App() {
  return <Excalidraw />;
}
Diagrams uses Python to programmatically create diagrams:
from diagrams import Diagram
from diagrams.aws.compute import EC2

with Diagram("Simple Diagram"):
    EC2("Web Server")
Summary
Excalidraw is a versatile, user-friendly tool for creating hand-drawn style diagrams with collaborative features. It's great for general-purpose diagramming but may be less efficient for complex, specialized diagrams like cloud architecture. Diagrams, on the other hand, offers a programmatic approach to creating cloud architecture diagrams, which can be more efficient for technical users but lacks the interactive drawing interface of Excalidraw.
Structurizr DSL
Pros of Structurizr DSL
- Offers a more comprehensive approach to software architecture documentation
- Provides multiple views (e.g., container, component, deployment) for a holistic system representation
- Supports integration with other tools in the Structurizr ecosystem
Cons of Structurizr DSL
- Steeper learning curve due to its domain-specific language
- Less flexibility in customizing diagram aesthetics
- Limited to software architecture diagrams, unlike Diagrams' broader scope
Code Comparison
Structurizr DSL:
workspace {
    model {
        user = person "User"
        softwareSystem = softwareSystem "Software System" {
            webapp = container "Web Application"
            database = container "Database"
        }
        user -> webapp "Uses"
        webapp -> database "Reads from and writes to"
    }
    views {
        systemContext softwareSystem "SystemContext" {
            include *
            autoLayout
        }
    }
}
Diagrams:
from diagrams import Diagram
from diagrams.aws.compute import EC2
from diagrams.aws.database import RDS

with Diagram("Web Service", show=False):
    EC2("web") >> RDS("userdb")
Convert  designs to code with AI

Introducing Visual Copilot: A new AI model to turn Figma designs to high quality code using your components.
Try Visual CopilotREADME

Diagrams
![]()
![]()
![]()


Diagram as Code.
Diagrams lets you draw the cloud system architecture in Python code. It was born for prototyping a new system architecture design without any design tools. You can also describe or visualize the existing system architecture as well. Diagrams currently supports main major providers including: AWS, Azure, GCP, Kubernetes, Alibaba Cloud, Oracle Cloud etc... It also supports On-Premises nodes, SaaS and major Programming frameworks and languages.
Diagram as Code also allows you to track the architecture diagram changes in any version control system.
NOTE: It does not control any actual cloud resources nor does it generate cloud formation or terraform code. It is just for drawing the cloud system architecture diagrams.
Providers
Getting Started
It requires Python 3.9 or higher, check your Python version first.
It uses Graphviz to render the diagram, so you need to install Graphviz to use diagrams. After installing graphviz (or already have it), install the diagrams.
macOS users can download the Graphviz via
brew install graphvizif you're using Homebrew.
# using pip (pip3)
$ pip install diagrams

# using pipenv
$ pipenv install diagrams

# using poetry
$ poetry add diagrams
You can start with quick start. Check out guides for more details, and you can find all available nodes list in here.
Examples
| Event Processing | Stateful Architecture | Advanced Web Service |
|---|---|---|
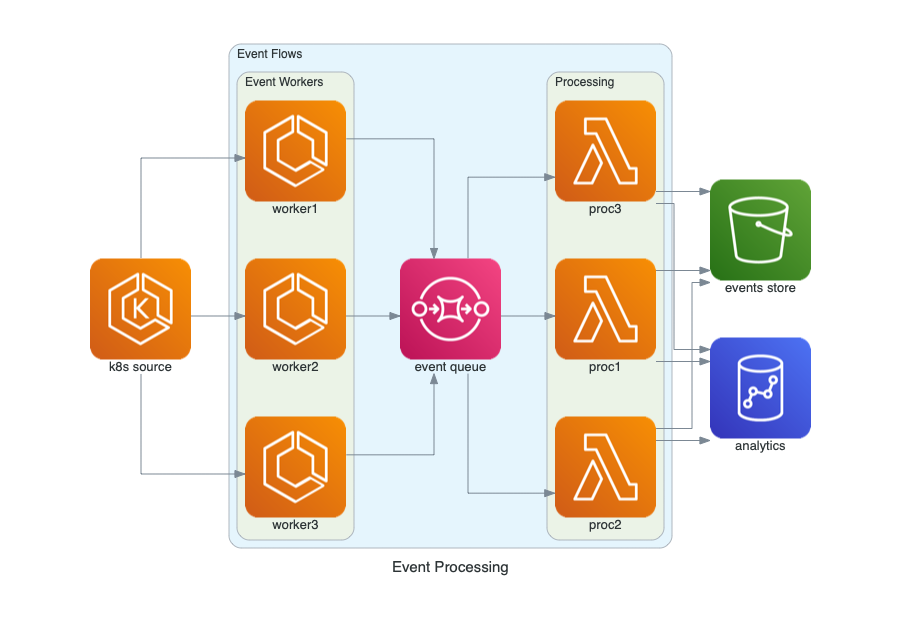 | 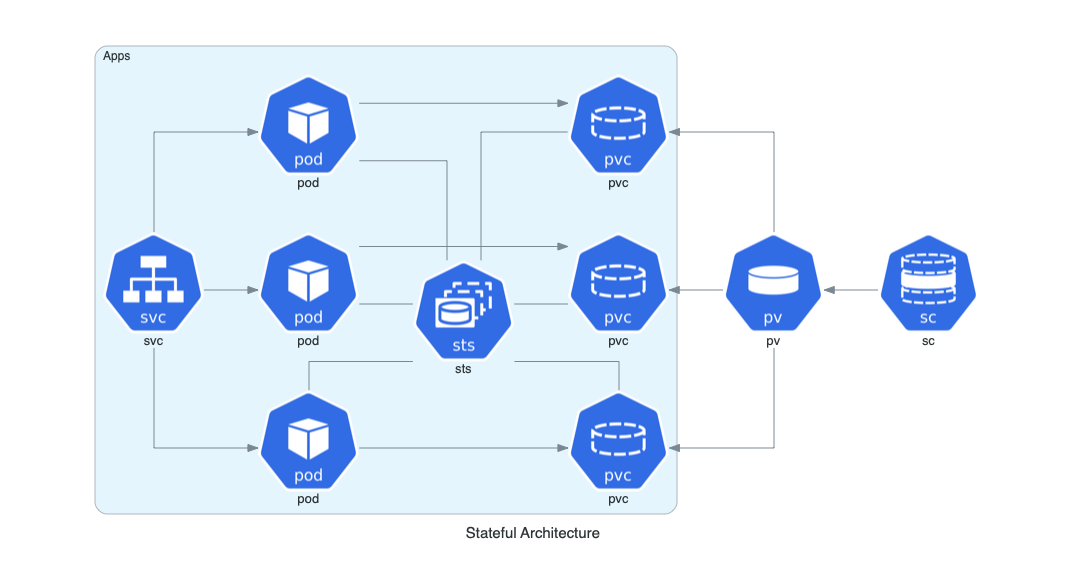 | 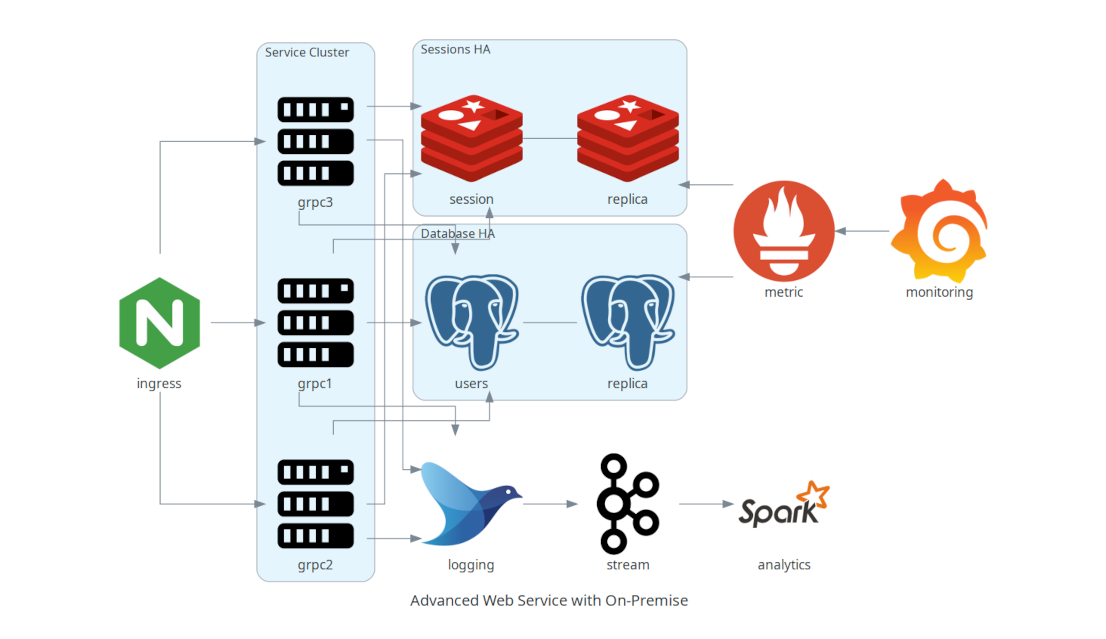 |
You can find all the examples on the examples page.
Contributing
To contribute to diagram, check out contribution guidelines.
Let me know if you are using diagrams! I'll add you in showcase page. (I'm working on it!) :)
Who uses it?
Apache Airflow is the most popular data workflow Orchestrator. Airflow uses Diagrams to generate architecture diagrams in their documentation.
Cloudiscovery helps you to analyze resources in your cloud (AWS/GCP/Azure/Alibaba/IBM) account. It allows you to create a diagram of analyzed cloud resource map based on this Diagrams library, so you can draw your existing cloud infrastructure with Cloudiscovery.
Airflow Diagrams is an Airflow plugin that aims to easily visualise your Airflow DAGs on service level from providers like AWS, GCP, Azure, etc. via diagrams.
KubeDiagrams is a tool to generate Kubernetes architecture diagrams from Kubernetes manifest files, kustomization files, Helm charts, and actual cluster state. KubeDiagrams supports all Kubernetes built-in resources, any custom resources, and label-based resource clustering.
Other languages
- If you are familiar with Go, you can use go-diagrams as well.
License
Top Related Projects
Generation of diagrams like flowcharts or sequence diagrams from text in a similar manner as markdown
Generate diagrams from textual description
draw.io is a JavaScript, client-side editor for general diagramming.
D2 is a modern diagram scripting language that turns text to diagrams.
Virtual whiteboard for sketching hand-drawn like diagrams
Structurizr DSL
Convert designs to code with AI
Introducing Visual Copilot: A new AI model to turn Figma designs to high quality code using your components.
Try Visual Copilot