
Top Related Projects

minimal monitor for JS Heap Size via performance.memory
Quick Overview
stats.js is a lightweight JavaScript performance monitor that provides real-time statistics for web applications. It displays frames per second (FPS), milliseconds per frame (MS), and memory usage in a small, customizable panel that can be easily integrated into any web project.
Pros
- Simple and easy to use with minimal setup required
- Lightweight and performant, with negligible impact on application performance
- Customizable appearance and positioning
- Supports multiple panels for monitoring different metrics simultaneously
Cons
- Limited to basic performance metrics (FPS, MS, MB)
- May not provide enough detail for complex performance analysis
- Requires manual integration into each project (no automatic instrumentation)
- Not actively maintained (last update was in 2020)
Code Examples
- Basic usage:
// Create a new Stats instance
const stats = new Stats();

// Add the stats panel to the document
document.body.appendChild(stats.dom);

// Update stats in the animation loop
function animate() {
    stats.begin();
    // Your animation code here
    stats.end();
    requestAnimationFrame(animate);
}
animate();
- Using multiple panels:
const stats = new Stats();
stats.showPanel(0); // 0: fps, 1: ms, 2: mb, 3+: custom
document.body.appendChild(stats.dom);

const stats2 = new Stats();
stats2.showPanel(1);
stats2.dom.style.cssText = 'position:absolute;top:0;left:80px;';
document.body.appendChild(stats2.dom);
- Custom panel:
const stats = new Stats();
stats.showPanel(3); // Custom panel
stats.dom.style.cssText = 'position:absolute;top:0;left:0;';
document.body.appendChild(stats.dom);

const myPanel = stats.addPanel(new Stats.Panel('Custom', '#ff8', '#221'));
const update = () => {
    myPanel.update(Math.random() * 100, 100);
    requestAnimationFrame(update);
};
update();
Getting Started
-
Include the stats.js library in your HTML:
<script src="https://cdnjs.cloudflare.com/ajax/libs/stats.js/r17/Stats.min.js"></script> -
Create a new Stats instance and add it to your document:
const stats = new Stats(); document.body.appendChild(stats.dom); -
Update the stats in your animation loop:
function animate() {
    stats.begin();
    // Your animation code here
    stats.end();
    requestAnimationFrame(animate);
}
animate();
Competitor Comparisons
minimal monitor for JS Heap Size via performance.memory
Pros of memory-stats.js
- Focuses specifically on memory usage monitoring
- Provides detailed memory allocation information
- Lightweight and easy to integrate into existing projects
Cons of memory-stats.js
- Limited to memory-related metrics only
- Less actively maintained compared to stats.js
- Fewer customization options for display and appearance
Code Comparison
stats.js:
var stats = new Stats();
stats.showPanel(0); // 0: fps, 1: ms, 2: mb, 3+: custom
document.body.appendChild(stats.dom);

function animate() {
    stats.begin();
    // monitored code goes here
    stats.end();
    requestAnimationFrame(animate);
}
memory-stats.js:
var memoryStats = new MemoryStats();
memoryStats.domElement.style.position = 'fixed';
memoryStats.domElement.style.right = '0px';
memoryStats.domElement.style.bottom = '0px';
document.body.appendChild(memoryStats.domElement);

requestAnimationFrame(function rAFloop() {
    memoryStats.update();
    requestAnimationFrame(rAFloop);
});
Summary
stats.js is a more comprehensive performance monitoring tool, offering FPS, MS, and MB panels, while memory-stats.js focuses solely on memory usage. stats.js has a larger community and more frequent updates, making it suitable for general performance monitoring. memory-stats.js is ideal for projects specifically concerned with memory allocation and usage patterns. Both libraries are easy to implement and provide valuable insights for web developers optimizing their applications.
Convert  designs to code with AI

Introducing Visual Copilot: A new AI model to turn Figma designs to high quality code using your components.
Try Visual CopilotREADME
stats.js
JavaScript Performance Monitor
This class provides a simple info box that will help you monitor your code performance.
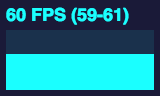
- FPS Frames rendered in the last second. The higher the number the better.
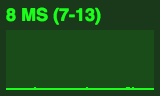
- MS Milliseconds needed to render a frame. The lower the number the better.
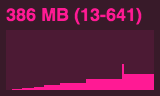
- MB MBytes of allocated memory. (Run Chrome with
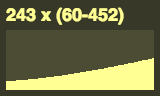
--enable-precise-memory-info) - CUSTOM User-defined panel support.
Screenshots
Installation
npm install stats.js
Usage
var stats = new Stats();
stats.showPanel( 1 ); // 0: fps, 1: ms, 2: mb, 3+: custom
document.body.appendChild( stats.dom );

function animate() {

	stats.begin();

	// monitored code goes here

	stats.end();

	requestAnimationFrame( animate );

}

requestAnimationFrame( animate );
Bookmarklet
You can add this code to any page using the following bookmarklet:
javascript:(function(){var script=document.createElement('script');script.onload=function(){var stats=new Stats();document.body.appendChild(stats.dom);requestAnimationFrame(function loop(){stats.update();requestAnimationFrame(loop)});};script.src='https://mrdoob.github.io/stats.js/build/stats.min.js';document.head.appendChild(script);})()
Top Related Projects
minimal monitor for JS Heap Size via performance.memory
Convert designs to code with AI
Introducing Visual Copilot: A new AI model to turn Figma designs to high quality code using your components.
Try Visual Copilot