Top Related Projects
The best JavaScript Data Table for building Enterprise Applications. Supports React / Angular / Vue / Plain JavaScript.
JavaScript Data Grid / Data Table with a Spreadsheet Look & Feel. Works with React, Angular, and Vue. Supported by the Handsontable team ⚡
🤖 Headless UI for building powerful tables & datagrids for TS/JS - React-Table, Vue-Table, Solid-Table, Svelte-Table
React components for efficiently rendering large lists and tabular data
A lightning fast JavaScript grid/spreadsheet
Advanced table plugin
Quick Overview
Tabulator is an interactive JavaScript library for creating feature-rich, editable data tables. It allows developers to create tables from various data sources, including JSON, AJAX, and HTML, with advanced functionality like sorting, filtering, and editing built-in.
Pros
- Highly customizable with numerous options for styling and functionality
- Supports various data input formats and output options
- Responsive design with mobile compatibility
- Extensive documentation and active community support
Cons
- Learning curve can be steep for advanced features
- Large file size compared to simpler table libraries
- Some users report performance issues with very large datasets
- Occasional conflicts with other JavaScript libraries
Code Examples
Creating a basic table:
var table = new Tabulator("#example-table", {
    data: tableData,
    columns: [
        {title: "Name", field: "name"},
        {title: "Age", field: "age"},
        {title: "Gender", field: "gender"},
    ],
});
Adding sorting and filtering:
var table = new Tabulator("#example-table", {
    data: tableData,
    columns: [
        {title: "Name", field: "name", sorter: "string", headerFilter: "input"},
        {title: "Age", field: "age", sorter: "number", headerFilter: "number"},
        {title: "Gender", field: "gender", sorter: "string", headerFilter: true},
    ],
});
Enabling row selection and adding a custom formatter:
var table = new Tabulator("#example-table", {
    data: tableData,
    columns: [
        {title: "Name", field: "name"},
        {title: "Age", field: "age"},
        {title: "Status", field: "status", formatter: function(cell, formatterParams){
            return cell.getValue() ? "<span style='color:green'>Active</span>" : "<span style='color:red'>Inactive</span>";
        }},
    ],
    selectable: true,
});
Getting Started
- Include Tabulator files in your HTML:
<link href="https://unpkg.com/tabulator-tables@5.4.4/dist/css/tabulator.min.css" rel="stylesheet">
<script type="text/javascript" src="https://unpkg.com/tabulator-tables@5.4.4/dist/js/tabulator.min.js"></script>
- Create a container element in your HTML:
<div id="example-table"></div>
- Initialize Tabulator in your JavaScript:
var tableData = [
    {id:1, name:"John", age:"18", gender:"male"},
    {id:2, name:"Jane", age:"22", gender:"female"},
];

var table = new Tabulator("#example-table", {
    data: tableData,
    columns: [
        {title: "Name", field: "name"},
        {title: "Age", field: "age"},
        {title: "Gender", field: "gender"},
    ],
});
This will create a basic Tabulator table with the provided data and columns.
Competitor Comparisons
The best JavaScript Data Table for building Enterprise Applications. Supports React / Angular / Vue / Plain JavaScript.
Pros of ag-grid
- More extensive feature set, including advanced filtering, grouping, and pivoting
- Better performance with large datasets (100,000+ rows)
- Stronger enterprise support and documentation
Cons of ag-grid
- Steeper learning curve due to complexity
- More expensive for commercial use
- Larger bundle size, which may impact load times
Code Comparison
Tabulator:
var table = new Tabulator("#example-table", {
    data: tabledata,
    columns: [
        {title: "Name", field: "name"},
        {title: "Age", field: "age"},
        {title: "Gender", field: "gender"},
    ],
});
ag-grid:
var gridOptions = {
    columnDefs: [
        {headerName: "Name", field: "name"},
        {headerName: "Age", field: "age"},
        {headerName: "Gender", field: "gender"},
    ],
    rowData: tabledata
};
new agGrid.Grid(document.querySelector('#myGrid'), gridOptions);
Both libraries offer similar basic setup, but ag-grid provides more configuration options for advanced features. Tabulator has a simpler API, making it easier to get started for basic use cases. ag-grid excels in complex scenarios and large-scale applications, while Tabulator is more lightweight and suitable for simpler projects or those with limited resources.
JavaScript Data Grid / Data Table with a Spreadsheet Look & Feel. Works with React, Angular, and Vue. Supported by the Handsontable team ⚡
Pros of Handsontable
- More feature-rich with advanced functionalities like data validation, filtering, and sorting
- Extensive documentation and better community support
- Offers both open-source and commercial versions with additional features
Cons of Handsontable
- Steeper learning curve due to its complexity
- Larger file size, which may impact performance for simpler use cases
- Commercial license required for some advanced features
Code Comparison
Tabulator:
var table = new Tabulator("#example-table", {
    data: tabledata,
    columns: [
        {title: "Name", field: "name"},
        {title: "Age", field: "age"},
    ],
});
Handsontable:
var hot = new Handsontable(document.getElementById('example'), {
    data: tabledata,
    colHeaders: ['Name', 'Age'],
    columns: [
        {data: 'name'},
        {data: 'age'},
    ],
});
Both libraries offer similar basic functionality for creating data tables, but Handsontable provides more built-in features and customization options. Tabulator has a simpler API and is generally easier to set up for basic use cases. The choice between the two depends on the specific requirements of your project, such as the need for advanced features, performance considerations, and budget constraints.
🤖 Headless UI for building powerful tables & datagrids for TS/JS - React-Table, Vue-Table, Solid-Table, Svelte-Table
Pros of Table
- Framework-agnostic with adapters for React, Vue, Solid, and Svelte
- More flexible and customizable for complex table scenarios
- Better TypeScript support and type safety
Cons of Table
- Steeper learning curve due to its flexibility and API complexity
- Requires more setup and configuration for basic use cases
- Smaller community and fewer ready-made examples compared to Tabulator
Code Comparison
Tabulator:
var table = new Tabulator("#example-table", {
    data: tableData,
    columns: [
        {title: "Name", field: "name"},
        {title: "Age", field: "age"},
    ],
});
Table:
const table = useReactTable({
    data,
    columns: [
        { header: 'Name', accessorKey: 'name' },
        { header: 'Age', accessorKey: 'age' },
    ],
    getCoreRowModel: getCoreRowModel(),
});
Summary
Tabulator is easier to set up and use for simple table needs, with a larger community and more examples. Table offers greater flexibility, framework support, and TypeScript integration, but requires more initial configuration and has a steeper learning curve. Choose Tabulator for quick, straightforward tables, and Table for complex, highly customized table implementations across different frameworks.
React components for efficiently rendering large lists and tabular data
Pros of react-virtualized
- Specialized for handling large data sets with efficient rendering
- Offers a wide range of components for various virtualization needs
- Integrates seamlessly with React applications
Cons of react-virtualized
- Steeper learning curve due to its focus on virtualization
- Less out-of-the-box styling options compared to Tabulator
- Requires more setup and configuration for basic table functionality
Code Comparison
react-virtualized:
import { Table, Column } from 'react-virtualized';

<Table
  width={300}
  height={300}
  headerHeight={20}
  rowHeight={30}
  rowCount={data.length}
  rowGetter={({ index }) => data[index]}
>
  <Column label="Name" dataKey="name" width={100} />
  <Column label="Age" dataKey="age" width={100} />
</Table>
Tabulator:
var table = new Tabulator("#example-table", {
  data: tabledata,
  columns: [
    {title: "Name", field: "name"},
    {title: "Age", field: "age"},
  ],
});
The code comparison shows that react-virtualized requires more setup for a basic table, while Tabulator offers a more concise initialization. However, react-virtualized's approach provides more control over rendering and performance optimization for large datasets.
A lightning fast JavaScript grid/spreadsheet
Pros of SlickGrid
- Highly performant for large datasets, capable of handling millions of rows
- Extensive customization options and plugin ecosystem
- Advanced features like frozen columns and rows
Cons of SlickGrid
- Steeper learning curve due to its complexity
- Less modern UI and styling out of the box
- Requires more setup and configuration for basic functionality
Code Comparison
SlickGrid:
var grid = new Slick.Grid("#myGrid", data, columns, options);
grid.setSelectionModel(new Slick.RowSelectionModel());
grid.registerPlugin(new Slick.AutoTooltips());
Tabulator:
var table = new Tabulator("#myTable", {
    data: tabledata,
    columns: columns,
    layout: "fitColumns"
});
SlickGrid requires more code for basic setup and plugin integration, while Tabulator offers a more concise and declarative approach. SlickGrid's code demonstrates its flexibility but also its complexity, whereas Tabulator provides a simpler API for common use cases.
Both libraries are powerful tools for creating data grids, but they cater to different needs. SlickGrid excels in handling extremely large datasets and offers extensive customization, making it suitable for complex enterprise applications. Tabulator, on the other hand, provides a more user-friendly experience with modern features and easier setup, making it ideal for rapid development and simpler use cases.
Advanced table plugin
Pros of Grid.js
- Lightweight and fast, with a smaller bundle size
- Built with TypeScript, offering better type safety and developer experience
- More modern API design with a focus on simplicity
Cons of Grid.js
- Fewer advanced features compared to Tabulator
- Smaller community and ecosystem
- Less extensive documentation and examples
Code Comparison
Tabulator:
var table = new Tabulator("#example-table", {
    data: tabledata,
    columns: [
        {title: "Name", field: "name"},
        {title: "Age", field: "age"},
        {title: "Gender", field: "gender"},
    ],
});
Grid.js:
new Grid({
    columns: ['Name', 'Age', 'Gender'],
    data: tabledata,
}).render(document.getElementById("wrapper"));
Both libraries offer straightforward ways to create tables, but Grid.js has a slightly more concise syntax. Tabulator provides more configuration options out of the box, while Grid.js focuses on simplicity and ease of use.
Tabulator is more feature-rich and has a larger community, making it suitable for complex projects with advanced requirements. Grid.js, on the other hand, is a good choice for simpler projects or when a lightweight solution is preferred. The choice between the two depends on the specific needs of your project and the level of complexity you require in your data tables.
Convert  designs to code with AI

Introducing Visual Copilot: A new AI model to turn Figma designs to high quality code using your components.
Try Visual CopilotREADME


An easy to use interactive table generation JavaScript library
Full documentation & demos can be found at: http://tabulator.info

Features
Tabulator allows you to create interactive tables in seconds from any HTML Table, Javascript Array or JSON formatted data.
Simply include the library and the css in your project and you're away!
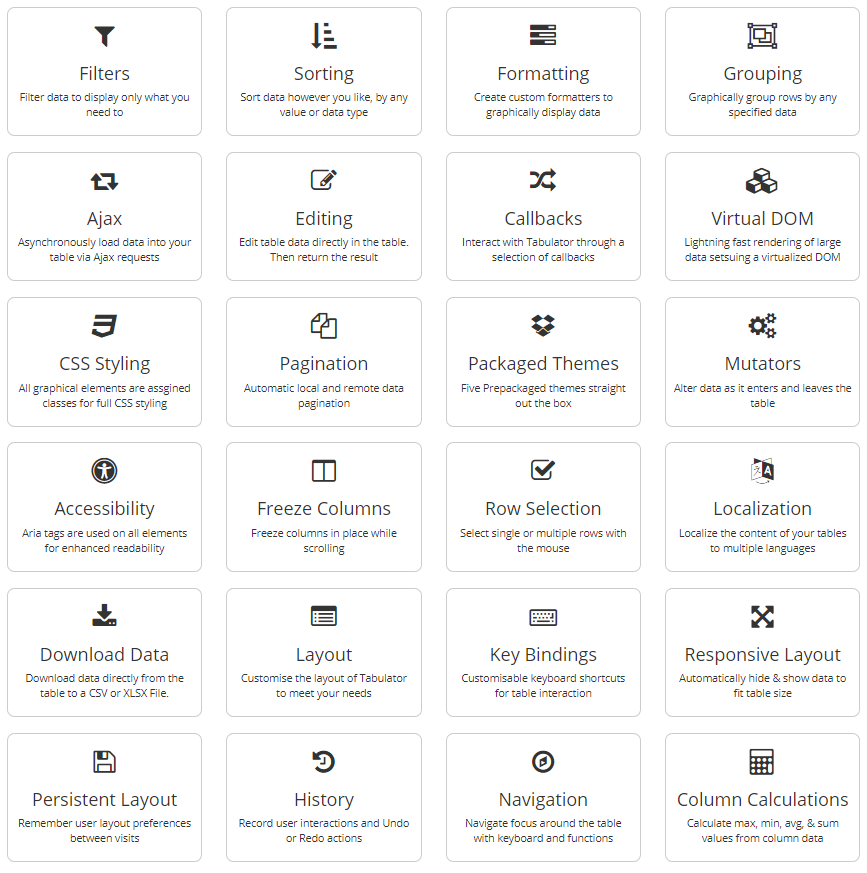
Tabulator is packed with useful features including:

Frontend Framework Support
Tabulator is built to work with all the major front end JavaScript frameworks including React, Angular and Vue.
Setup
Setting up tabulator could not be simpler.
Include the library and the css
<link href="dist/css/tabulator.min.css" rel="stylesheet">
<script type="text/javascript" src="dist/js/tabulator.min.js"></script>
Create an element to hold the table
<div id="example-table"></div>
Turn the element into a tabulator with some simple javascript
var table = new Tabulator("#example-table", {});
Bower Installation
To get Tabulator via the Bower package manager, open a terminal in your project directory and run the following command:
bower install tabulator --save
NPM Installation
To get Tabulator via the NPM package manager, open a terminal in your project directory and run the following command:
npm install tabulator-tables --save
CDN - UNPKG
To access Tabulator directly from the UNPKG CDN servers, include the following two lines at the start of your project, instead of the locally hosted versions:
<link href="https://unpkg.com/tabulator-tables/dist/css/tabulator.min.css" rel="stylesheet">
<script type="text/javascript" src="https://unpkg.com/tabulator-tables/dist/js/tabulator.min.js"></script>
Testing
Tabulator comes with both Unit and End-to-End (E2E) tests. Hereâs how you can run them:
# Unit test
npm run test:unit

# E2E test
npm run build # Make sure to build the project first
npx playwright test # Run the tests
# or
npm run test:e2e

# Run all tests
npm run test
Top Related Projects
The best JavaScript Data Table for building Enterprise Applications. Supports React / Angular / Vue / Plain JavaScript.
JavaScript Data Grid / Data Table with a Spreadsheet Look & Feel. Works with React, Angular, and Vue. Supported by the Handsontable team ⚡
🤖 Headless UI for building powerful tables & datagrids for TS/JS - React-Table, Vue-Table, Solid-Table, Svelte-Table
React components for efficiently rendering large lists and tabular data
A lightning fast JavaScript grid/spreadsheet
Advanced table plugin
Convert  designs to code with AI

Introducing Visual Copilot: A new AI model to turn Figma designs to high quality code using your components.
Try Visual Copilot