
Top Related Projects

CNCF Jaeger, a Distributed Tracing Platform

APM, Application Performance Monitoring System

Quick Overview
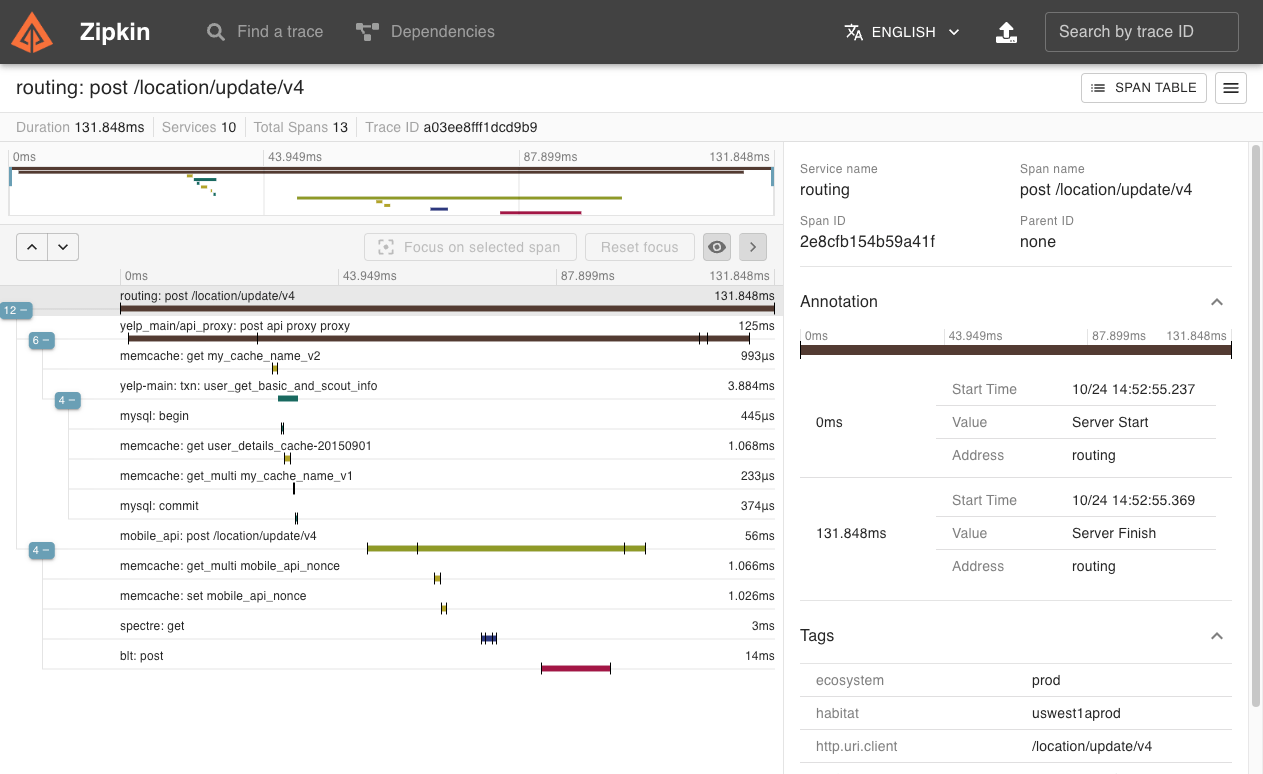
Zipkin is an open-source distributed tracing system designed to help troubleshoot latency problems in microservice architectures. It manages both the collection and lookup of this data, providing a centralized view of service dependencies and performance across complex distributed systems.
Pros
- Provides end-to-end visibility into request flows across microservices
- Supports multiple languages and frameworks through various instrumentation libraries
- Offers a user-friendly web interface for querying and visualizing traces
- Integrates well with popular cloud platforms and container orchestration tools
Cons
- Can introduce additional overhead in high-traffic systems
- Requires instrumentation of all services for complete tracing coverage
- May require significant storage resources for long-term trace retention
- Learning curve for effective use and interpretation of trace data
Code Examples
- Adding Zipkin to a Spring Boot application:
@SpringBootApplication
@EnableZipkinServer
public class ZipkinServerApplication {
    public static void main(String[] args) {
        SpringApplication.run(ZipkinServerApplication.class, args);
    }
}
- Instrumenting a Python application with Zipkin:
from flask import Flask
from py_zipkin.zipkin import create_http_headers_for_new_span, zipkin_span

app = Flask(__name__)

@app.route('/')
def index():
    with zipkin_span(
        service_name='my_service',
        span_name='index_page',
        transport_handler=http_transport,
        port=5000,
        sample_rate=100.0,
    ):
        # Your application logic here
        return "Hello, World!"

def http_transport(encoded_span):
    # Send the encoded span to Zipkin
    requests.post(
        'http://localhost:9411/api/v2/spans',
        data=encoded_span,
        headers={'Content-Type': 'application/x-thrift'},
    )

if __name__ == '__main__':
    app.run(debug=True)
- Querying Zipkin API for traces:
const axios = require('axios');

async function getTraces() {
  try {
    const response = await axios.get('http://localhost:9411/api/v2/traces', {
      params: {
        serviceName: 'my_service',
        limit: 10
      }
    });
    console.log(response.data);
  } catch (error) {
    console.error('Error fetching traces:', error);
  }
}

getTraces();
Getting Started
-
Download the latest Zipkin server:
curl -sSL https://zipkin.io/quickstart.sh | bash -s -
Start the Zipkin server:
java -jar zipkin.jar -
Instrument your application using a Zipkin library for your language/framework.
-
Send traces to Zipkin (default: http://localhost:9411/api/v2/spans).
-
Access the Zipkin UI at http://localhost:9411 to view and analyze traces.
Competitor Comparisons
CNCF Jaeger, a Distributed Tracing Platform
Pros of Jaeger
- Better support for Kubernetes and cloud-native environments
- More extensive query language for trace analysis
- Supports multiple storage backends out of the box (Cassandra, Elasticsearch, etc.)
Cons of Jaeger
- Steeper learning curve due to more complex architecture
- Requires more resources to run compared to Zipkin
- Less mature ecosystem and fewer integrations with other tools
Code Comparison
Zipkin (Java):
Span span = tracer.newTrace().name("encode").start();
try {
    doSomethingExpensive();
} finally {
    span.finish();
}
Jaeger (Go):
span := tracer.StartSpan("encode")
defer span.Finish()
doSomethingExpensive()
Both Zipkin and Jaeger are popular distributed tracing systems, but they have different strengths and use cases. Zipkin is simpler to set up and use, making it a good choice for smaller projects or teams new to distributed tracing. Jaeger, on the other hand, offers more advanced features and better scalability, making it suitable for larger, more complex microservices architectures, especially in cloud-native environments.
The code examples show that both systems have similar APIs for creating and managing spans, with minor syntax differences due to the programming languages used in the examples.
APM, Application Performance Monitoring System
Pros of SkyWalking
- More comprehensive observability platform, offering APM, metrics, and logging
- Supports multiple languages and frameworks out-of-the-box
- Provides a built-in UI for visualization and analysis
Cons of SkyWalking
- Higher complexity and steeper learning curve
- Requires more resources to run and maintain
- Less focused on distributed tracing compared to Zipkin
Code Comparison
SkyWalking agent configuration (Java):
-javaagent:/path/to/skywalking-agent.jar
-Dskywalking.agent.service_name=your-service-name
-Dskywalking.collector.backend_service=oap-server:11800
Zipkin configuration (Spring Boot):
spring.zipkin.baseUrl=http://your-zipkin-server:9411/
spring.sleuth.sampler.probability=1.0
Both projects aim to provide observability solutions, but they differ in scope and complexity. Zipkin focuses primarily on distributed tracing, making it simpler to set up and use for specific tracing needs. SkyWalking offers a more comprehensive observability platform, including APM, metrics, and logging, but requires more resources and has a steeper learning curve.
Zipkin's simplicity makes it a good choice for projects that need quick and easy distributed tracing implementation. SkyWalking is better suited for larger, more complex applications that require a full-featured observability solution across multiple languages and frameworks.
Pros of APM Server
- Seamless integration with Elasticsearch and Kibana for powerful data analysis and visualization
- Built-in support for a wide range of programming languages and frameworks
- Advanced features like distributed tracing and real-time monitoring
Cons of APM Server
- Steeper learning curve and more complex setup compared to Zipkin
- Requires Elasticsearch as a backend, which may increase infrastructure costs
- Less flexibility in terms of storage options, as it's primarily designed for Elasticsearch
Code Comparison
APM Server (Go):
func (p *processor) loadProcessors(config *config.C) error {
    processors := p.beatConfig.Processors
    procs, err := processors.LoadList(config)
    if err != nil {
        return err
    }
    p.processors = procs
    return nil
}
Zipkin (Java):
@Override public Call<Void> spanV2(List<Span> spans) {
  if (spans.isEmpty()) return Call.create(null);
  byte[] encodedSpans = SpanBytesEncoder.JSON_V2.encodeList(spans);
  return sendSpans(encodedSpans, APPLICATION_JSON);
}
The code snippets demonstrate different approaches to processing spans in APM Server (Go) and Zipkin (Java). APM Server focuses on loading and configuring processors, while Zipkin's code shows the encoding and sending of spans in JSON format.
Convert  designs to code with AI

Introducing Visual Copilot: A new AI model to turn Figma designs to high quality code using your components.
Try Visual CopilotREADME
zipkin
![]()
![]()

Zipkin is a distributed tracing system. It helps gather timing data needed to troubleshoot latency problems in service architectures. Features include both the collection and lookup of this data.
If you have a trace ID in a log file, you can jump directly to it. Otherwise, you can query based on attributes such as service, operation name, tags and duration. Some interesting data will be summarized for you, such as the percentage of time spent in a service, and whether operations failed.
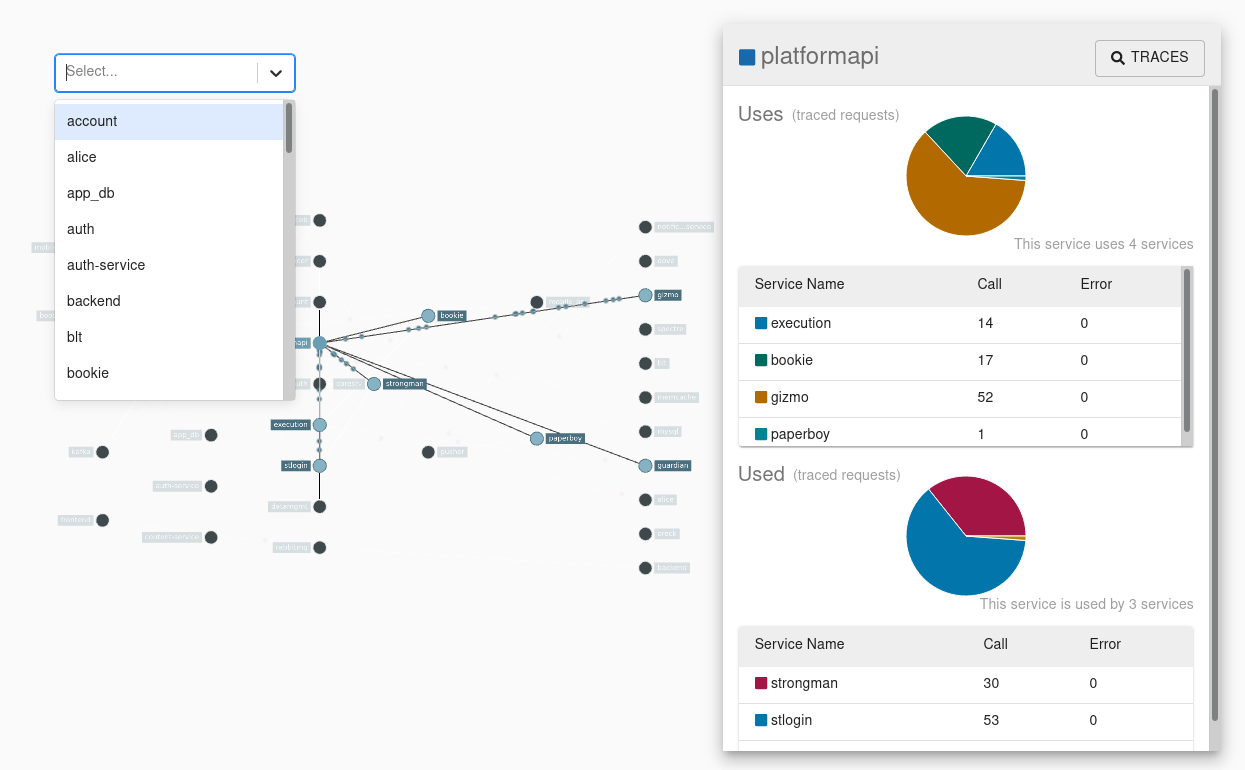
The Zipkin UI also presents a dependency diagram showing how many traced requests went through each application. This can be helpful for identifying aggregate behavior including error paths or calls to deprecated services.
Applicationâs need to be âinstrumentedâ to report trace data to Zipkin. This usually means configuration of a tracer or instrumentation library. The most popular ways to report data to Zipkin are via http or Kafka, though many other options exist, such as Apache ActiveMQ, gRPC, RabbitMQ and Apache Pulsar. The data served to the UI is stored in-memory, or persistently with a supported backend such as Apache Cassandra or Elasticsearch.
Quick-start
The quickest way to get started is to fetch the latest released server as a self-contained executable jar. Note that the Zipkin server requires minimum JRE 17+. For example:
curl -sSL https://zipkin.io/quickstart.sh | bash -s
java -jar zipkin.jar
You can also start Zipkin via Docker.
# Note: this is mirrored as ghcr.io/openzipkin/zipkin
docker run -d -p 9411:9411 openzipkin/zipkin
Once the server is running, you can view traces with the Zipkin UI at http://localhost:9411/zipkin.
If your applications aren't sending traces, yet, configure them with Zipkin instrumentation or try one of our examples.
Check out the zipkin-server documentation for configuration details, or Docker examples for how to use docker-compose.
Zipkin Slim
The slim build of Zipkin is smaller and starts faster. It supports in-memory and Elasticsearch storage, but doesn't support messaging transports like Kafka or RabbitMQ. If these constraints match your needs, you can try slim like below:
Running via Java:
curl -sSL https://zipkin.io/quickstart.sh | bash -s io.zipkin:zipkin-server:LATEST:slim zipkin.jar
java -jar zipkin.jar
Running via Docker:
# Note: this is mirrored as ghcr.io/openzipkin/zipkin-slim
docker run -d -p 9411:9411 openzipkin/zipkin-slim
Running via Homebrew:
brew install zipkin
# to run in foreground
zipkin
# to run in background
brew services start zipkin
Core Library
The core library is used by both Zipkin instrumentation and the Zipkin server.
This includes built-in codec for Zipkin's v1 and v2 json formats. A direct dependency on gson (json library) is avoided by minifying and repackaging classes used. The result is a 155k jar which won't conflict with any library you use.
Ex.
// All data are recorded against the same endpoint, associated with your service graph
localEndpoint = Endpoint.newBuilder().serviceName("tweetie").ip("192.168.0.1").build()
span = Span.newBuilder()
    .traceId("d3d200866a77cc59")
    .id("d3d200866a77cc59")
    .name("targz")
    .localEndpoint(localEndpoint)
    .timestamp(epochMicros())
    .duration(durationInMicros)
    .putTag("compression.level", "9");

// Now, you can encode it as json
bytes = SpanBytesEncoder.JSON_V2.encode(span);
Note: The above is just an example, most likely you'll want to use an existing tracing library like Brave
Core Library Requires Java 8+
The minimum Java language level of the core library is 8. This helps support those writing agent instrumentation. Version 2.x was the last to support Java 6.
Note: zipkin-reporter-brave does not use this library. So, brave still supports Java 6.
Storage Component
Zipkin includes a StorageComponent, used to store and query spans and dependency links. This is used by the server and those making collectors, or span reporters. For this reason, storage components have minimal dependencies, though require Java 17+.
Ex.
// this won't create network connections
storage = ElasticsearchStorage.newBuilder()
                              .hosts(asList("http://myelastic:9200")).build();

// prepare a call
traceCall = storage.spanStore().getTrace("d3d200866a77cc59");

// execute it synchronously or asynchronously
trace = traceCall.execute();

// clean up any sessions, etc
storage.close();
In-Memory
The InMemoryStorage component is packaged in zipkin's core library. It is neither persistent, nor viable for realistic work loads. Its purpose is for testing, for example starting a server on your laptop without any database needed.
Cassandra
The Cassandra component uses Cassandra 3.11.3+ features, but is tested against the latest patch of Cassandra 4.1.
This is the second generation of our Cassandra schema. It stores spans using UDTs, such that they appear like Zipkin v2 json in cqlsh. It is designed for scale, and uses a combination of SASI and manually implemented indexes to make querying larger data more performant.
Note: This store requires a job to aggregate dependency links.
Elasticsearch
The Elasticsearch component uses Elasticsearch 5+ features, but is tested against Elasticsearch 7-8.x and OpenSearch 2.x.
It stores spans as Zipkin v2 json so that integration with other tools is straightforward. To help with scale, this uses a combination of custom and manually implemented indexing.
Note: This store requires a spark job to aggregate dependency links.
Disabling search
The following API endpoints provide search features, and are enabled by default. Search primarily allows the trace list screen of the UI operate.
GET /services- Distinct Span.localServiceNameGET /remoteServices?serviceName=X- Distinct Span.remoteServiceName by Span.localServiceNameGET /spans?serviceName=X- Distinct Span.name by Span.localServiceNameGET /autocompleteKeys- Distinct keys of Span.tags subject to configurable whitelistGET /autocompleteValues?key=X- Distinct values of Span.tags by keyGET /traces- Traces matching a query possibly including the above criteria
When search is disabled, traces can only be retrieved by ID
(GET /trace/{traceId}). Disabling search is only viable when there is
an alternative way to find trace IDs, such as logs. Disabling search can
reduce storage costs or increase write throughput.
StorageComponent.Builder.searchEnabled(false) is implied when a zipkin
is run with the env variable SEARCH_ENABLED=false.
Legacy (v1) components
The following components are no longer encouraged, but exist to help aid transition to supported ones. These are indicated as "v1" as they use data layouts based on Zipkin's V1 Thrift model, as opposed to the simpler v2 data model currently used.
MySQL
The MySQL v1 component uses MySQL 5.6+ features, but is tested against MariaDB 10.11.
The schema was designed to be easy to understand and get started with; it was not designed for performance. Ex spans fields are columns, so you can perform ad-hoc queries using SQL. However, this component has known performance issues: queries will eventually take seconds to return if you put a lot of data into it.
This store does not require a job to aggregate dependency links. However, running the job will improve performance of dependencies queries.
Running the server from source
The Zipkin server receives spans via HTTP POST and respond to queries from its UI. It can also run collectors, such as RabbitMQ or Kafka.
To run the server from the currently checked out source, enter the following. JDK 17+ is required to compile the source.
# Build the server and also make its dependencies
$ ./mvnw -q --batch-mode -DskipTests --also-make -pl zipkin-server clean install
# Run the server
$ java -jar ./zipkin-server/target/zipkin-server-*exec.jar
Artifacts
Server artifacts are under the maven group id io.zipkin
Library artifacts are under the maven group id io.zipkin.zipkin2
Library Releases
Releases are at Sonatype and Maven Central
Library Snapshots
Snapshots are uploaded to Sonatype after commits to master.
Docker Images
Released versions of zipkin-server are published to Docker Hub as openzipkin/zipkin and GitHub
Container Registry as ghcr.io/openzipkin/zipkin. See docker for details.
Helm Charts
Helm charts are available via helm repo add zipkin https://zipkin.io/zipkin-helm.
See zipkin-helm for details.
Javadocs
https://zipkin.io/zipkin contains versioned folders with JavaDocs published on each (non-PR) build, as well as releases.
Top Related Projects
CNCF Jaeger, a Distributed Tracing Platform
APM, Application Performance Monitoring System
Convert designs to code with AI
Introducing Visual Copilot: A new AI model to turn Figma designs to high quality code using your components.
Try Visual Copilot