
Top Related Projects

A tiny, simple and fast heatmap plugin for Leaflet.
Quick Overview
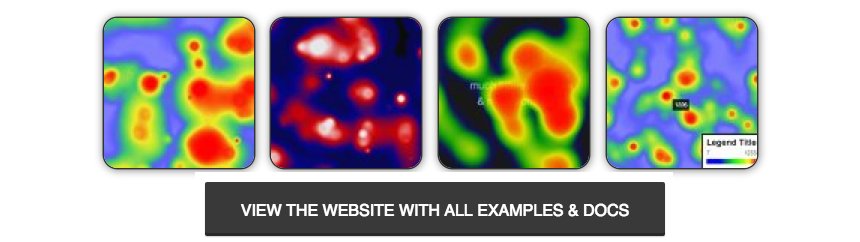
heatmap.js is a JavaScript library for creating interactive heatmaps on web pages. It allows developers to visualize data density on a 2D canvas or map overlay, with customizable color gradients and opacity levels. The library is lightweight and easy to integrate into various web projects.
Pros
- Simple and intuitive API for creating heatmaps
- Supports both canvas-based and DOM-based rendering
- Highly customizable with various configuration options
- Works well with map overlays (e.g., Google Maps)
Cons
- Limited documentation and examples
- Not actively maintained (last update was in 2016)
- Lacks advanced features like animation or real-time updates
- May have performance issues with very large datasets
Code Examples
Creating a basic heatmap:
// Create a heatmap instance
var heatmapInstance = h337.create({
  container: document.querySelector('.heatmap'),
  radius: 40,
  maxOpacity: .8,
  minOpacity: 0
});

// Add data points
heatmapInstance.addData({
  x: 200,
  y: 100,
  value: 50
});
Customizing heatmap colors:
var heatmapInstance = h337.create({
  container: document.querySelector('.heatmap'),
  gradient: {
    '.5': 'blue',
    '.8': 'red',
    '.95': 'white'
  }
});
Using with Google Maps:
var map = new google.maps.Map(document.getElementById('map-canvas'));
var heatmap = new HeatmapOverlay(map, {
  radius: 20,
  maxOpacity: 0.8,
  scaleRadius: true,
  useLocalExtrema: true
});

heatmap.setData({
  max: 8,
  data: [{lat: 24.6408, lng:46.7728, count: 3}, ...]
});
Getting Started
-
Include the heatmap.js library in your HTML:
<script src="https://cdnjs.cloudflare.com/ajax/libs/heatmap.js/2.0.2/heatmap.min.js"></script> -
Create a container element for the heatmap:
<div class="heatmap" style="width: 100%; height: 400px;"></div> -
Initialize the heatmap and add data:
var heatmapInstance = h337.create({
  container: document.querySelector('.heatmap')
});

heatmapInstance.setData({
  max: 5,
  data: [
    {x: 10, y: 15, value: 5},
    {x: 50, y: 50, value: 2},
    // Add more data points as needed
  ]
});
This will create a basic heatmap with default settings. You can customize the appearance and behavior by adjusting the configuration options when creating the heatmap instance.
Competitor Comparisons
A tiny, simple and fast heatmap plugin for Leaflet.
Pros of Leaflet.heat
- Seamless integration with Leaflet maps
- Better performance for large datasets
- More customization options for heatmap appearance
Cons of Leaflet.heat
- Requires Leaflet as a dependency
- Limited to geographical data visualization
- Less flexible for non-map-based heatmaps
Code Comparison
Leaflet.heat:
var heat = L.heatLayer(data, {radius: 25}).addTo(map);
heatmap.js:
var heatmapInstance = h337.create({
  container: document.querySelector('.heatmap'),
  radius: 25
});
heatmapInstance.setData({data: data});
Key Differences
- Leaflet.heat is specifically designed for map-based heatmaps, while heatmap.js is more versatile for various types of heatmaps.
- Leaflet.heat requires Leaflet library, whereas heatmap.js is standalone.
- Leaflet.heat uses a simpler API for adding heatmaps to maps, while heatmap.js offers more granular control over heatmap creation and data manipulation.
Use Cases
- Choose Leaflet.heat for map-based visualizations, especially with large geographical datasets.
- Opt for heatmap.js when creating heatmaps for non-map applications or when greater flexibility is needed.
Both libraries have their strengths, and the choice depends on the specific requirements of your project, such as the type of data you're visualizing and the desired level of customization.
Convert  designs to code with AI

Introducing Visual Copilot: A new AI model to turn Figma designs to high quality code using your components.
Try Visual CopilotREADME
heatmap.js
Dynamic Heatmaps for the Web.
How to get started
The fastest way to get started is to install heatmap.js with bower. Just run the following command:
bower install heatmap.js-amd
This will download the latest working version of heatmap.js and put it in your bower_components folder.
Alternatively you could just download the latest release from github and unzip it.
The file you're ultimately looking for is heatmap.js or heatmap.min.js
heatmap.js is also hosted on npm:
npm install heatmap.js
How to run the local examples
Start a webserver (e.g. python SimpleHTTPServer from the project directory root):
python -m SimpleHTTPServer 1337 &
Then browse to
http://localhost:1337/examples/
Get involved
Please have a look at the contribution guidelines before submitting contributions.
Disclaimer: PRs can take time to receive feedback or be merged ( I'm only one person with very little time ) but I'm trying to get back to everyone eventually
Questions?
In order to keep technical questions in a central place where other people can learn from it, the best thing you can do is post your question to stackoverflow with the tag heatmap.js.
If you do have a very specific question (or need commercial support) don't hesitate to contact me directly via email.
Mailing list
Want to receive the latest updates and news about heatmap.js?
There is a mailing list. No spam, just news and important updates.
Top Related Projects
A tiny, simple and fast heatmap plugin for Leaflet.
Convert designs to code with AI
Introducing Visual Copilot: A new AI model to turn Figma designs to high quality code using your components.
Try Visual Copilot