
Top Related Projects

A microbenchmark support library

Main gperftools repository

Sampling CPU and HEAP profiler for Java featuring AsyncGetCallTrace + perf_events

Stack trace visualizer
pprof is a tool for visualization and analysis of profiling data

BCC - Tools for BPF-based Linux IO analysis, networking, monitoring, and more
Quick Overview
Coz is a causal profiler that helps developers identify and optimize performance bottlenecks in their code. It works by virtually speeding up segments of code and measuring the impact on overall program execution time, providing insights into which optimizations would yield the most significant performance improvements.
Pros
- Provides causal profiling, offering more actionable insights than traditional time-based profilers
- Works with unmodified executables, making it easy to integrate into existing projects
- Supports multi-threaded applications and can identify optimization opportunities in concurrent code
- Generates visualizations to help developers understand performance bottlenecks more easily
Cons
- Currently only supports Linux systems, limiting its use on other platforms
- May introduce some runtime overhead during profiling
- Requires some understanding of causal profiling concepts to interpret results effectively
- Limited documentation and examples for advanced use cases
Getting Started
To get started with Coz, follow these steps:
- Install Coz on your Linux system:
git clone https://github.com/plasma-umass/coz.git
cd coz
make
sudo make install
- Compile your program with debug information:
gcc -g -O0 -lpthread your_program.c -o your_program
- Run your program with Coz:
coz run --- ./your_program [args...]
- Analyze the results in the generated
profile.cozfile:
coz plot profile.coz
This will generate an HTML file with visualizations of the profiling results, helping you identify which code sections would benefit most from optimization.
Competitor Comparisons
A microbenchmark support library
Pros of Benchmark
- Widely adopted and well-maintained by Google
- Supports multiple languages (C++, C, Rust)
- Extensive documentation and examples
Cons of Benchmark
- Requires manual instrumentation of code
- May introduce overhead in measurements
- Limited to microbenchmarking specific functions
Code Comparison
Benchmark:
static void BM_StringCreation(benchmark::State& state) {
  for (auto _ : state)
    std::string empty_string;
}
BENCHMARK(BM_StringCreation);
Coz:
void function_to_profile() {
  COZ_BEGIN("function_to_profile");
  // ... function body ...
  COZ_END("function_to_profile");
}
Key Differences
- Coz uses causal profiling, while Benchmark focuses on microbenchmarking
- Coz provides whole-program performance insights, Benchmark targets specific functions
- Coz requires minimal code changes, Benchmark needs more extensive instrumentation
- Coz is primarily for C/C++, while Benchmark supports multiple languages
- Coz helps identify optimization opportunities, Benchmark measures existing performance
Use Cases
- Use Benchmark for precise timing of specific functions or algorithms
- Choose Coz for understanding overall program performance and finding bottlenecks
- Benchmark is ideal for comparing different implementations of the same functionality
- Coz is better suited for large, complex applications where performance interactions are unclear
Main gperftools repository
Pros of gperftools
- Comprehensive suite of performance tools including CPU profiler, heap profiler, and heap checker
- Lightweight and low-overhead, suitable for production environments
- Extensive documentation and wide adoption in the industry
Cons of gperftools
- Primarily focused on C/C++ applications, limiting its use for other languages
- Requires manual instrumentation and analysis, which can be time-consuming
- May not provide insights into potential performance improvements as effectively as Coz
Code Comparison
gperftools (CPU profiler usage):
#include <gperftools/profiler.h>

int main() {
    ProfilerStart("my_profile.prof");
    // ... code to profile ...
    ProfilerStop();
    return 0;
}
Coz (causal profiling):
#include <coz.h>

int main() {
    COZ_PROGRESS;
    // ... code to profile ...
    return 0;
}
Summary
gperftools offers a comprehensive suite of performance tools with low overhead, making it suitable for production environments. However, it primarily targets C/C++ applications and requires manual instrumentation. Coz, on the other hand, provides causal profiling, which can offer insights into potential performance improvements more easily, but may have a steeper learning curve for some users.
Sampling CPU and HEAP profiler for Java featuring AsyncGetCallTrace + perf_events
Pros of async-profiler
- Supports a wide range of JVM-based languages (Java, Kotlin, Scala, etc.)
- Low-overhead profiling with minimal impact on application performance
- Provides detailed flame graphs and method-level profiling information
Cons of async-profiler
- Primarily focused on JVM-based applications, limiting its use for other languages
- Requires some setup and configuration to use effectively
- May not provide insights into potential optimizations as directly as Coz
Code comparison
async-profiler:
AsyncProfiler profiler = AsyncProfiler.getInstance();
profiler.start();
// ... code to profile ...
profiler.stop();
profiler.dump("profile.html");
Coz:
#include <coz.h>

void function_to_profile() {
  COZ_BEGIN("function_name");
  // ... code to profile ...
  COZ_END("function_name");
}
Summary
async-profiler is a powerful tool for profiling JVM-based applications with low overhead, providing detailed performance insights through flame graphs and method-level profiling. It excels in its support for various JVM languages and minimal impact on application performance.
On the other hand, Coz offers a unique approach to performance optimization by using causal profiling to identify potential optimizations. While Coz may provide more direct insights into optimization opportunities, it has a more limited language support compared to async-profiler.
The choice between these tools depends on the specific needs of the project, the programming language used, and the desired level of optimization insights.
Stack trace visualizer
Pros of FlameGraph
- Widely adopted and well-established tool in the performance analysis community
- Supports multiple programming languages and platforms
- Provides intuitive visualization of stack traces for easy identification of performance bottlenecks
Cons of FlameGraph
- Requires manual instrumentation or external profiling tools to generate input data
- May introduce overhead during data collection, potentially affecting application performance
- Limited in providing direct insights into potential performance improvements
Code Comparison
FlameGraph:
#!/usr/bin/perl -w
use strict;

my %collapsed;
while (<>) {
    chomp;
    my ($stack, $count) = split /\s+/;
    $collapsed{$stack} += $count;
}
Coz:
#include "causal/profiler.h"

int main(int argc, char** argv) {
  causal::profiler::init();
  // Your application code here
  causal::profiler::shutdown();
  return 0;
}
Key Differences
- FlameGraph focuses on visualizing performance data, while Coz provides causal profiling for identifying optimization opportunities
- FlameGraph requires external profiling tools, whereas Coz integrates directly into the application code
- Coz offers unique insights into potential performance improvements, while FlameGraph excels at presenting a comprehensive view of program execution
pprof is a tool for visualization and analysis of profiling data
Pros of pprof
- Widely adopted and supported by Google, with extensive documentation
- Supports multiple programming languages, including Go, C++, and Java
- Offers various visualization options for profiling data
Cons of pprof
- Requires manual instrumentation of code for some profiling types
- May introduce overhead in production environments
- Less focus on identifying bottlenecks in complex, multi-threaded applications
Code Comparison
pprof (Go):
import "net/http/pprof"

func main() {
    go func() {
        log.Println(http.ListenAndServe("localhost:6060", nil))
    }()
    // Rest of the application code
}
coz:
#include <coz.h>

int main() {
    COZ_PROGRESS;
    // Rest of the application code
}
Key Differences
- coz focuses on causal profiling, while pprof offers various profiling types
- coz is primarily designed for C/C++ applications, whereas pprof supports multiple languages
- coz aims to predict performance improvements, while pprof provides detailed runtime analysis
- pprof requires more setup and configuration, whereas coz is designed for minimal code changes
Both tools have their strengths, with pprof being more versatile and widely adopted, while coz offers unique insights through causal profiling for specific use cases.
BCC - Tools for BPF-based Linux IO analysis, networking, monitoring, and more
Pros of BCC
- Provides a comprehensive set of tools for Linux performance analysis and tracing
- Supports multiple programming languages (Python, C, Lua) for writing BPF programs
- Offers a wide range of pre-built tools for common performance analysis tasks
Cons of BCC
- Steeper learning curve due to its complexity and breadth of features
- Requires root access and kernel support for eBPF, limiting its use in some environments
- May introduce overhead in production systems if not used carefully
Code Comparison
BCC example (Python):
from bcc import BPF

b = BPF(text='int kprobe__sys_clone(void *ctx) { bpf_trace_printk("Hello, World!\\n"); return 0; }')
b.trace_print()
COZ example (C++):
#include <coz.h>

void foo() {
  COZ_PROGRESS;
  // ... function code ...
}
Key Differences
- BCC focuses on system-wide performance analysis and tracing, while COZ is designed for application-level performance optimization
- BCC requires kernel support and root access, whereas COZ can be used in user-space applications without special privileges
- BCC offers a broader set of tools and languages, while COZ provides a more focused approach to identifying performance bottlenecks
Convert  designs to code with AI

Introducing Visual Copilot: A new AI model to turn Figma designs to high quality code using your components.
Try Visual CopilotREADME
Coz: Finding Code that Counts with Causal Profiling
by Charlie Curtsinger and Emery Berger

Coz is a profiler for native code (C/C++/Rust) that unlocks optimization opportunities missed by traditional profilers. Coz employs a novel technique called causal profiling that measures optimization potential. It predicts what the impact of optimizing code will have on overall throughput or latency.
Profiles generated by Coz show the "bang for buck" of optimizing a line of code in an application. In the below profile, almost every effort to optimize the performance of this line of code directly leads to an increase in overall performance, making it an excellent candidate for optimization efforts.

Coz's measurement matches developers' assumptions about profilers: that optimizing highly-ranked code will have the greatest impact on performance. Causal profiling measures optimization potential for serial, parallel, and asynchronous programs without instrumentation of special handling for library calls and concurrency primitives. Instead, a causal profiler uses performance experiments to predict the effect of optimizations. This allows the profiler to establish causality: "optimizing function X will have effect Y," exactly the measurement developers had assumed they were getting all along.
Full details of Coz are available in our paper, Coz: Finding Code that Counts with Causal Profiling (pdf), SOSP 2015, October 2015 (recipient of a Best Paper Award).
Installation
On Debian and Ubuntu, you can install Coz via apt:
sudo apt install coz-profiler
An OpenSUSE package was prepared by user @zethra and is available at https://build.opensuse.org/package/show/home:zethra/coz-profiler.
Coz should work on any modern Linux system (specifically, running
version 2.6.32 or later, with support for the perf_event_open system
call) with a Python 3.x interpreter.
Libraries/Wrappers
By default, Coz works for C, C++, and Rust programs. It has been ported or has wrappers for several other languages, listed below:
| Language | Link |
|---|---|
| Java | JCoz: https://github.com/Decave/JCoz |
| Go | Cozgo: https://github.com/urjitbhatia/cozgo |
| Swift | Swift Coz: https://github.com/funcmike/swift-coz |
Building Coz From Source
To build Coz from source, you will need:
- A copy of the source code for this project
- A compiler with C++0x support (clang++ or g++)
- A Python interpreter (Python 3.x is required)
Once you have all dependencies in place, build Coz with CMake. On Debian-based distributions, the following commands should take care of the entire process:
sudo apt-get update
sudo apt-get install -y libdwarf-dev
sudo apt-get install -y nodejs npm
sudo apt-get install -y build-essential cmake docutils-common git python3 pkg-config
git clone https://github.com/plasma-umass/libelfin && cd libelfin && make && sudo make install && cd ..
git clone https://github.com/plasma-umass/coz && cd coz && cmake . && make && sudo make install && cd ..
sudo ldconfig
Next, you need to change the "perf_event_paranoia" level so Coz can run.
sudo sh -c 'echo 1 >/proc/sys/kernel/perf_event_paranoid'
Now you can test Coz. Build the benchmark suite and run one of the benchmarks (the SQLite3 benchmark takes a while to build).
sudo apt-get install -y libbz2-dev libsqlite3-dev
cd coz/benchmarks && cmake . && make && cd ../..
coz run --- ./coz/benchmarks/toy/toy
Finally, use the Coz viewer to see the results. This command will open up a browser tab, from which you will need to load the file profile.coz.
coz plot
If you are on a remote system, you can open the Coz viewer in your browser: https://coz-profiler.github.io/coz-ui/ and then load the file profile.coz, which you will have to transfer to your local machine.
(You may need to move the "Minimum Points" slider on the left side to see the results.)
Using Coz
Using Coz requires a small amount of setup, but you can jump ahead to the section on the included sample applications in this repository if you want to try Coz right away.
To run your program with Coz, you will need to build it with debug information (-g -gdwarf-3). You do not need to include debug symbols in the main executable: coz uses the same procedure as gdb to locate debug information for stripped binaries.
Once you have your program built with debug information, you can run it with Coz using the command coz run {coz options} --- {program name and arguments}. But, to produce a useful profile you need to decide which part(s) of the application you want to speed up by specifying one or more progress points.
Profiling Modes
Coz departs from conventional profiling by making it possible to view the effect of optimizations on both throughput and latency. To profile throughput, you must specify a progress point. To profile latency, you must specify a pair of progress points.
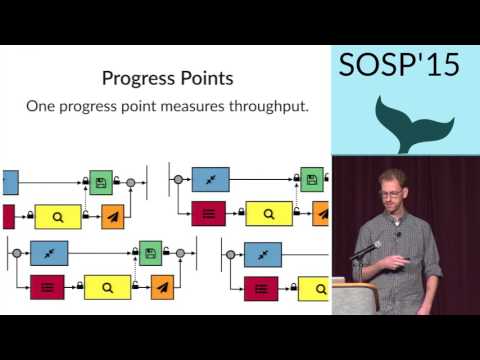
Throughput Profiling: Specifying Progress Points
To profile throughput you must indicate a line in the code that corresponds to the end of a unit of work. For example, a progress point could be the point at which a transaction concludes, when a web page finishes rendering, or when a query completes. Coz then measures the rate of visits to each progress point to determine any potential optimization's effect on throughput.
To place a progress point, include coz.h (under the include directory in this repository) and add the COZ_PROGRESS macro to at least one line you would like to execute more frequently. Don't forget to link your program with libdl: use the -ldl option.
By default, Coz uses the source file and line number as the name for your progress points. If you use COZ_PROGRESS_NAMED("name for progress point") instead, you can provide an informative name for your progress points. This also allows you to mark multiple source locations that correspond to the same progress point.
Latency Profiling: Specifying Progress Points
To profile latency, you must place two progress points that correspond to the start and end of an event of interest, such as when a transaction begins and completes. Simply mark the beginning of a transaction with the COZ_BEGIN("transaction name") macro, and the end with the COZ_END("transaction name") macro. Unlike regular progress points, you always need to specify a name for your latency progress points. Don't forget to link your program with libdl: use the -ldl option.
When coz tests a hypothetical optimization it will report the effect of that optimization on the average latency between these two points. Coz can track this information without any knowledge of individual transactions thanks to Little's Law.
Specifying Progress Points on the Command Line
Coz has command line options to specify progress points when profiling the application instead of modifying its source. This feature is currently disabled because it did not work particularly well. Adding support for better command line-specified progress points is planned in the near future.
Processing Results
To plot profile results, go to http://plasma-umass.github.io/coz/ and load your profile. This page also includes several sample profiles from PARSEC benchmarks.
Sample Applications
The benchmarks directory in this repository includes several small benchmarks with progress points added at appropriate locations. To build and run one of these benchmarks with coz, just browse to benchmarks and type cmake . && make, then you can execute the programs compiled in benchmarks/{benchmark}. These programs may require several runs before coz has enough measurements to generate a useful profile. Once you have profiled these programs for several minutes, go to http://plasma-umass.github.io/coz/ to load and plot your profile.
CMake
When you install coz it installs a cmake config file. To add coz to a cmake project simply use the command find_package(coz-profiler). This will import a target for the library and includes called coz::coz and a target for the coz binary coz::profiler. For guidance on how to use these targets refer to the CMake documentation.
Limitations
Coz currently does not support interpreted or JIT-compiled languages such as Python, Ruby, or JavaScript. Interpreted languages will likely not be supported at any point, but support for JIT-compiled languages that produce debug information could be added in the future.
License
All source code is licensed under the BSD 2-clause license unless otherwise indicated. See LICENSE.md for details.
Sample applications (in the benchmarks directory) include several Phoenix programs and pbzip2, which are licensed separately and included with this release for convenience.
Top Related Projects
A microbenchmark support library
Main gperftools repository
Sampling CPU and HEAP profiler for Java featuring AsyncGetCallTrace + perf_events
Stack trace visualizer
pprof is a tool for visualization and analysis of profiling data
BCC - Tools for BPF-based Linux IO analysis, networking, monitoring, and more
Convert designs to code with AI
Introducing Visual Copilot: A new AI model to turn Figma designs to high quality code using your components.
Try Visual Copilot