
Top Related Projects

BCC - Tools for BPF-based Linux IO analysis, networking, monitoring, and more

:tropical_fish: Beats - Lightweight shippers for Elasticsearch & Logstash

Web-based Traffic and Security Network Traffic Monitoring

Agent for collecting, processing, aggregating, and writing metrics, logs, and other arbitrary data.

The Prometheus monitoring system and time series database.
Quick Overview
ElastiFlow is an open-source network traffic analysis and visualization tool that leverages the Elastic Stack (Elasticsearch, Logstash, and Kibana) to provide real-time insights into network traffic. It is designed to help network administrators and security professionals monitor and analyze network activity, detect anomalies, and investigate security incidents.
Pros
- Comprehensive Network Visibility: ElastiFlow collects and analyzes a wide range of network traffic data, including NetFlow, sFlow, and IPFIX, providing a comprehensive view of network activity.
- Real-time Monitoring and Alerting: The tool offers real-time monitoring and alerting capabilities, allowing users to quickly identify and respond to network issues or security threats.
- Powerful Visualization and Reporting: ElastiFlow integrates with Kibana, providing users with a rich set of visualization and reporting tools to better understand network traffic patterns and trends.
- Scalable and Flexible: The Elastic Stack architecture allows ElastiFlow to scale to handle large volumes of network data, making it suitable for enterprise-level deployments.
Cons
- Complexity of Setup: Deploying and configuring ElastiFlow can be a complex process, especially for users unfamiliar with the Elastic Stack and its components.
- Dependency on Elastic Stack: ElastiFlow is tightly coupled with the Elastic Stack, which means that users must have a good understanding of Elasticsearch, Logstash, and Kibana to effectively use the tool.
- Limited Out-of-the-Box Functionality: While ElastiFlow provides a solid foundation for network traffic analysis, some users may require additional customization or development to meet their specific needs.
- Potential Performance Overhead: Depending on the volume of network data and the complexity of the deployment, ElastiFlow may introduce some performance overhead on the underlying infrastructure.
Code Examples
N/A (ElastiFlow is not a code library)
Getting Started
To get started with ElastiFlow, you'll need to have the Elastic Stack (Elasticsearch, Logstash, and Kibana) installed and configured. The following steps provide a high-level overview of the process:
-
Install the Elastic Stack: Follow the official Elastic documentation to install and configure Elasticsearch, Logstash, and Kibana on your system.
-
Deploy ElastiFlow: Clone the ElastiFlow repository from GitHub and follow the instructions in the README file to deploy the necessary Logstash configurations, Kibana dashboards, and Elasticsearch indices.
-
Configure Data Sources: Configure your network devices to send NetFlow, sFlow, or IPFIX data to the Logstash instance running ElastiFlow.
-
Explore the Dashboards: Once the data is being collected, you can explore the pre-built Kibana dashboards provided by ElastiFlow to visualize and analyze your network traffic.
-
Customize and Extend: Depending on your specific requirements, you may need to customize the ElastiFlow configuration or develop additional Kibana visualizations and dashboards to meet your needs.
For more detailed instructions, please refer to the ElastiFlow GitHub repository.
Competitor Comparisons
BCC - Tools for BPF-based Linux IO analysis, networking, monitoring, and more
Pros of BCC
- BCC provides a comprehensive set of tools for tracing and monitoring system performance, including support for a wide range of kernel events and metrics.
- BCC is highly extensible, allowing users to write custom tools and scripts to meet their specific needs.
- BCC is actively maintained and has a large and engaged community of contributors.
Cons of BCC
- BCC can be more complex to set up and configure than some other monitoring tools, especially for users who are not familiar with the Linux kernel and system programming.
- BCC may have a steeper learning curve than some other monitoring tools, as it requires a good understanding of the Linux kernel and system programming concepts.
- BCC may not provide the same level of user-friendly visualization and reporting features as some other monitoring tools.
Code Comparison
Here's a brief code comparison between BCC and Elastiflow:
BCC (Python):
from bcc import BPF

# Load the BPF program
b = BPF(text="""
#include <uapi/linux/ptrace.h>

int hello(struct pt_regs *ctx) {
    bpf_trace_printk("Hello, World!\\n");
    return 0;
}
""")

# Attach the BPF program to a kernel function
b.attach_kprobe(event="sys_clone", fn_name="hello")

# Print the output
b.trace_print()
Elastiflow (Python):
from elastiflow.collector import Collector

# Create a new Collector instance
collector = Collector()

# Start collecting data
collector.start()

# Stop collecting data
collector.stop()
:tropical_fish: Beats - Lightweight shippers for Elasticsearch & Logstash
Pros of Elastic/Beats
- Elastic/Beats is a widely-used and well-supported open-source project, with a large and active community.
- It offers a comprehensive suite of data shippers that can collect and ship data from various sources to Elasticsearch.
- Elastic/Beats is highly configurable and can be easily integrated with other Elastic Stack components.
Cons of Elastic/Beats
- Elastic/Beats can be more complex to set up and configure compared to ElastiFlow.
- The learning curve for Elastic/Beats may be steeper, especially for users who are new to the Elastic Stack.
- Elastic/Beats may have a higher resource footprint compared to ElastiFlow, depending on the specific use case.
Code Comparison
Here's a brief code comparison between Elastic/Beats and ElastiFlow:
Elastic/Beats (Filebeat):
func (p *Prospector) readLine(buf *bufio.Reader) ([]byte, error) {
    line, isPrefix, err := buf.ReadLine()
    if err != nil {
        return nil, err
    }
    if isPrefix {
        p.log.Warn("Possible incomplete line found while reading file")
        return nil, ErrLineUnfinished
    }
    return line, nil
}
ElastiFlow (Netflow/IPFIX Collector):
def process_flow(self, flow):
    """
    Process a single flow record.
    """
    try:
        self.process_flow_record(flow)
    except Exception as e:
        self.logger.error(f"Error processing flow: {e}")
        self.logger.debug(f"Flow data: {flow}")
Web-based Traffic and Security Network Traffic Monitoring
Pros of ntopng
- Comprehensive network monitoring and analysis capabilities, including real-time traffic analysis, application detection, and user identification.
- Extensive support for various network protocols and technologies, including NetFlow, sFlow, IPFIX, and more.
- Robust reporting and visualization features, allowing for in-depth analysis of network data.
Cons of ntopng
- Relatively complex setup and configuration process compared to Elastiflow.
- Larger resource requirements, as it is a more feature-rich and comprehensive solution.
- Limited community support and documentation compared to some other network monitoring tools.
Code Comparison
Here's a brief code comparison between ntopng and Elastiflow:
ntopng (sample code):
from ntop import ntop
from ntop.constants import *

# Connect to ntopng
ntop.init("http://localhost:3000", "admin", "password")

# Get top talkers
top_talkers = ntop.get_top_talkers()
for talker in top_talkers:
    print(f"IP: {talker['ip']}, Packets: {talker['packets']}, Bytes: {talker['bytes']}")
Elastiflow (sample code):
from elastiflow.client import ElastiflowClient

# Connect to Elastiflow
client = ElastiflowClient(host="http://localhost:9200")

# Get top talkers
top_talkers = client.get_top_talkers()
for talker in top_talkers:
    print(f"IP: {talker['ip']}, Packets: {talker['packets']}, Bytes: {talker['bytes']}")
Both code samples demonstrate how to retrieve the top talkers from their respective network monitoring solutions, ntopng and Elastiflow. The main difference lies in the specific API calls and library usage, but the overall functionality is similar.
Agent for collecting, processing, aggregating, and writing metrics, logs, and other arbitrary data.
Pros of Telegraf
- Telegraf is a widely-used, open-source data collection agent that supports a wide range of input and output plugins, making it a versatile tool for data collection and monitoring.
- The project has a large and active community, with regular updates and a wealth of documentation and resources available.
- Telegraf is highly configurable, allowing users to customize its behavior to suit their specific needs.
Cons of Telegraf
- Telegraf can be more complex to set up and configure than some other data collection tools, especially for users who are new to the tool.
- The project's large size and feature set can make it overkill for some simpler use cases, where a more lightweight solution might be more appropriate.
- Telegraf's reliance on a centralized configuration file can make it more difficult to manage in large-scale or distributed environments.
Code Comparison
Here's a brief comparison of the configuration for Telegraf and Elastiflow:
Telegraf configuration (excerpt):
[[inputs.cpu]]
  percpu = true
  totalcpu = true
  collect_cpu_time = false
  report_active = false

[[inputs.disk]]
  ignore_fs = ["tmpfs", "devtmpfs", "devfs", "overlay", "aufs", "squashfs"]
Elastiflow configuration (excerpt):
input:
  netflow:
    enabled: true
    listen: 0.0.0.0:2055
    protocol: udp
    max_flows_per_second: 100000
    max_flows_per_batch: 10000
    flow_timeout: 60s
    flow_cache_size: 1000000
As you can see, the configuration styles differ, with Telegraf using a TOML format and Elastiflow using YAML. The specific configuration options also differ, reflecting the different use cases and features of the two projects.
The Prometheus monitoring system and time series database.
Pros of Prometheus
- Prometheus is a widely-adopted, open-source monitoring and alerting system that has a large and active community.
- It provides a powerful query language (PromQL) that allows for flexible and complex data analysis.
- Prometheus has a wide range of exporters and integrations, making it easy to monitor a variety of systems and applications.
Cons of Prometheus
- Prometheus can be more complex to set up and configure compared to some other monitoring solutions.
- The storage format used by Prometheus (TSDB) can be resource-intensive, especially for large amounts of data.
Code Comparison
Prometheus:
func (s *TargetManager) Sync(ctx context.Context) error {
    s.mtx.Lock()
    defer s.mtx.Unlock()

    tps, err := s.discoverer.Discover(ctx)
    if err != nil {
        return err
    }
    s.targets = tps
    return nil
}
Elastiflow:
def get_flows(self, start_time, end_time, **kwargs):
    """
    Get flow data from Elasticsearch.

    Args:
        start_time (datetime): Start time of the flow data.
        end_time (datetime): End time of the flow data.
        **kwargs: Additional parameters to pass to the Elasticsearch query.

    Returns:
        dict: A dictionary containing the flow data.
    """
    query = self.build_query(start_time, end_time, **kwargs)
    response = self.es.search(index=self.index_pattern, body=query)
    return response
Convert  designs to code with AI

Introducing Visual Copilot: A new AI model to turn Figma designs to high quality code using your components.
Try Visual CopilotREADME
This legacy version of ElastiFlow™ is now deprecated.
Try the new ElastiFlow™!!!
PLEASE NOTE: This repository remains for historical purposes, however no part of this legacy solution is shared with the next generation of ElastiFlow™. To install the new solution please refer to the documentation at docs.elastiflow.com. For assistance with the new solution, please join the ElastiFlow Community Slack.
Now that the new ElastiFlow™ Unified Flow Collector is generally available, the legacy Logstash-based solution in this repository is deprecated. It will remain here for historical purposes, but will not receive updates. You are encouraged to try out the new collector. See more details below.
We have released the next generation of ElastiFlow™ which introduces the new ElastiFlow Unified Flow Collector for Netflow, IPFIX and sFlow.
Some of the enhancements included in the all-new collector include:
- Proper management templates from different devices. - NO MORE template conflicts!
- Improved Scalability - Over 10x more flows/sec than Logstash, over 3x more than Filebeat!
- Support for Option Templates - Dynamic enrichment of network interface name and application names and more!
- Telemetry Support - sFlow Counter Samples and other metrics from Cisco, Calix and more!
- Gracefully handles âunknownâ Fields - No more dropped flows when a single unsupported field is encountered.
- Fully decodes and translates all available data - DSCP, TCP Options, ECN, Fragmentation Flags, and more.
Get Started with the next generation of ElastiFlow... HERE
You can also join the ElastiFlow community Slack... HERE
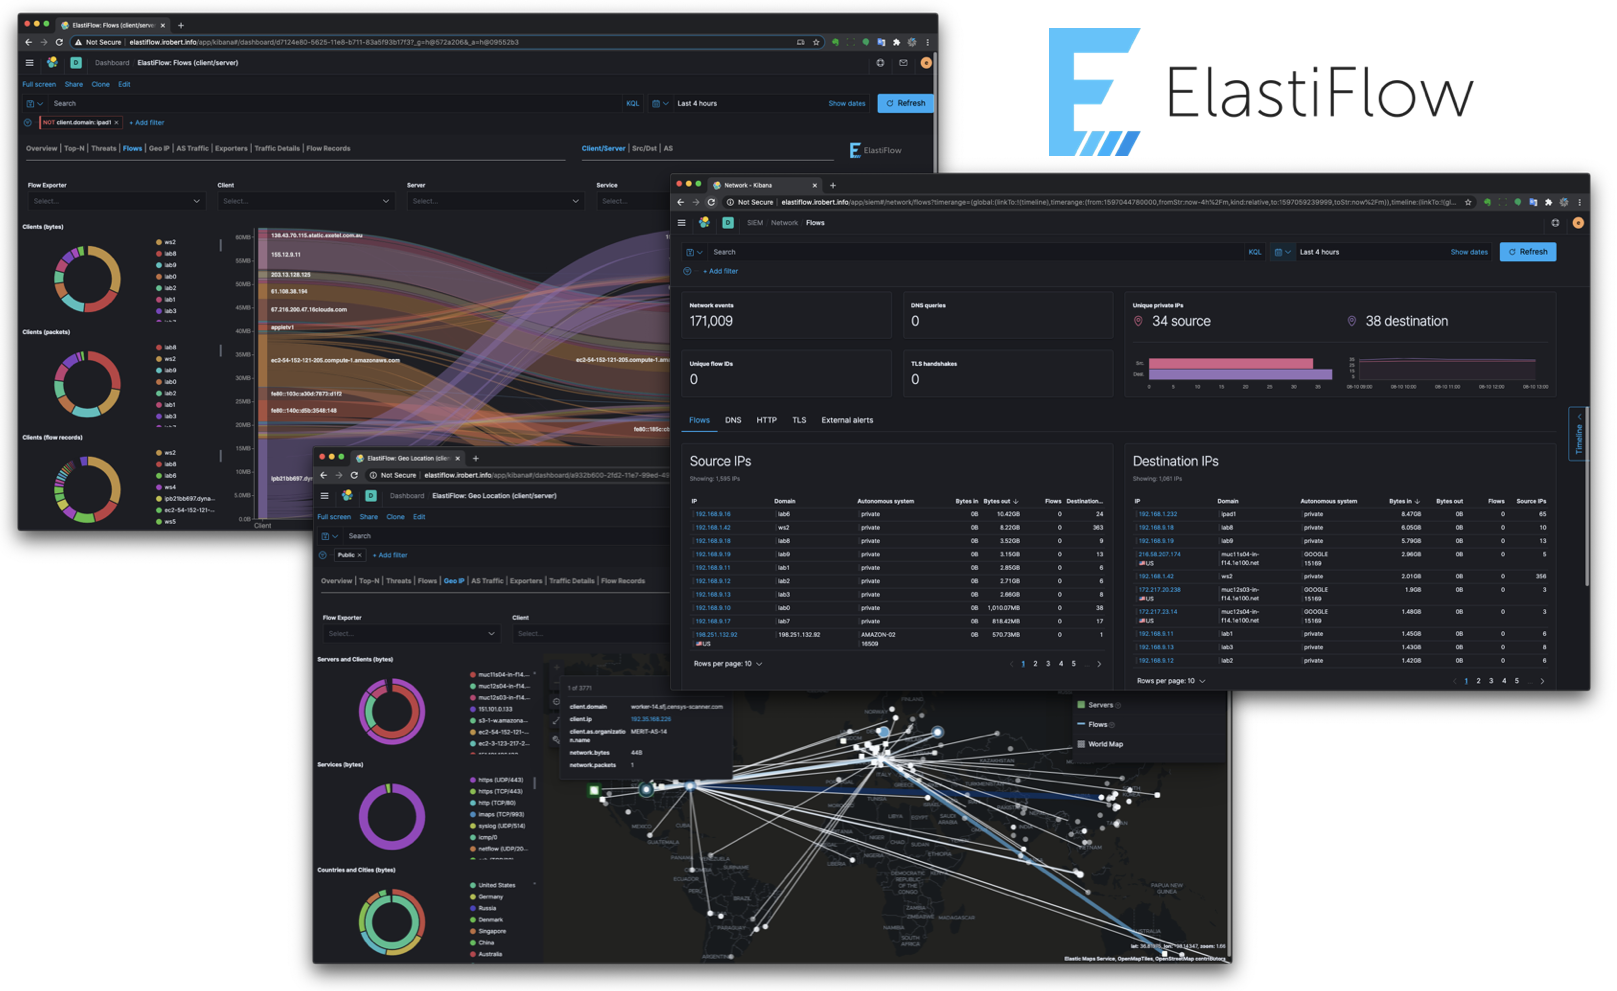
ElastiFlow™ provides network flow data collection and visualization using the Elastic Stack (Elasticsearch, Logstash and Kibana). It supports Netflow v5/v9, sFlow and IPFIX flow types (1.x versions support only Netflow v5/v9).
I was inspired to create ElastiFlow™ following the overwhelmingly positive feedback received to an article I posted on Linkedin... WTFlow?! Are you really still paying for commercial solutions to collect and analyze network flow data?
User Testimonials
| Organization | Feedback |
|---|---|
 | "ElastiFlow has significantly reduced our network flow monitoring costs. The flexibility and extensibility inherent to ElastiFlow was essential for an easy integration with our infrastructure monitoring suite." |
 | âRight now this is my personal favorite analytics tool. I use it extensively and am always finding a new way to leverage it." |
 | "We're using it since two months in our new datacenter and our network admins are very happy and impressed." |
 | "Of all the netflow tools Iâve tested it has, by far, the best visualizations." |
 | "We absolutely love ElastiFlow and recently stood it up in production. Looking forward to new functionality and dashboards." |
Getting Started
NOTE - Please refer to
INSTALL.mdfor installation instructions.
ElastiFlow™ is built using the Elastic Stack, including Elasticsearch, Logstash and Kibana. Please refer to INSTALL.md for instructions on how to install and configure ElastiFlow™.
If you are new to the Elastic Stack, this video goes beyond a simple default installation of Elasticsearch and Kibana. It discusses real-world best practices for hardware sizing and configuration, providing production-level performance and reliability.

Additionally local SSD storage should be considered as mandatory! For an in-depth look at how different storage options compare, and in particular how bad HDD-based storage is for Elasticsearch (even in multi-drive RAID0 configurations) you should watch this video...

NOTE: Please make sure that have reviewed KNOWN_ISSUES.md prior to getting started.
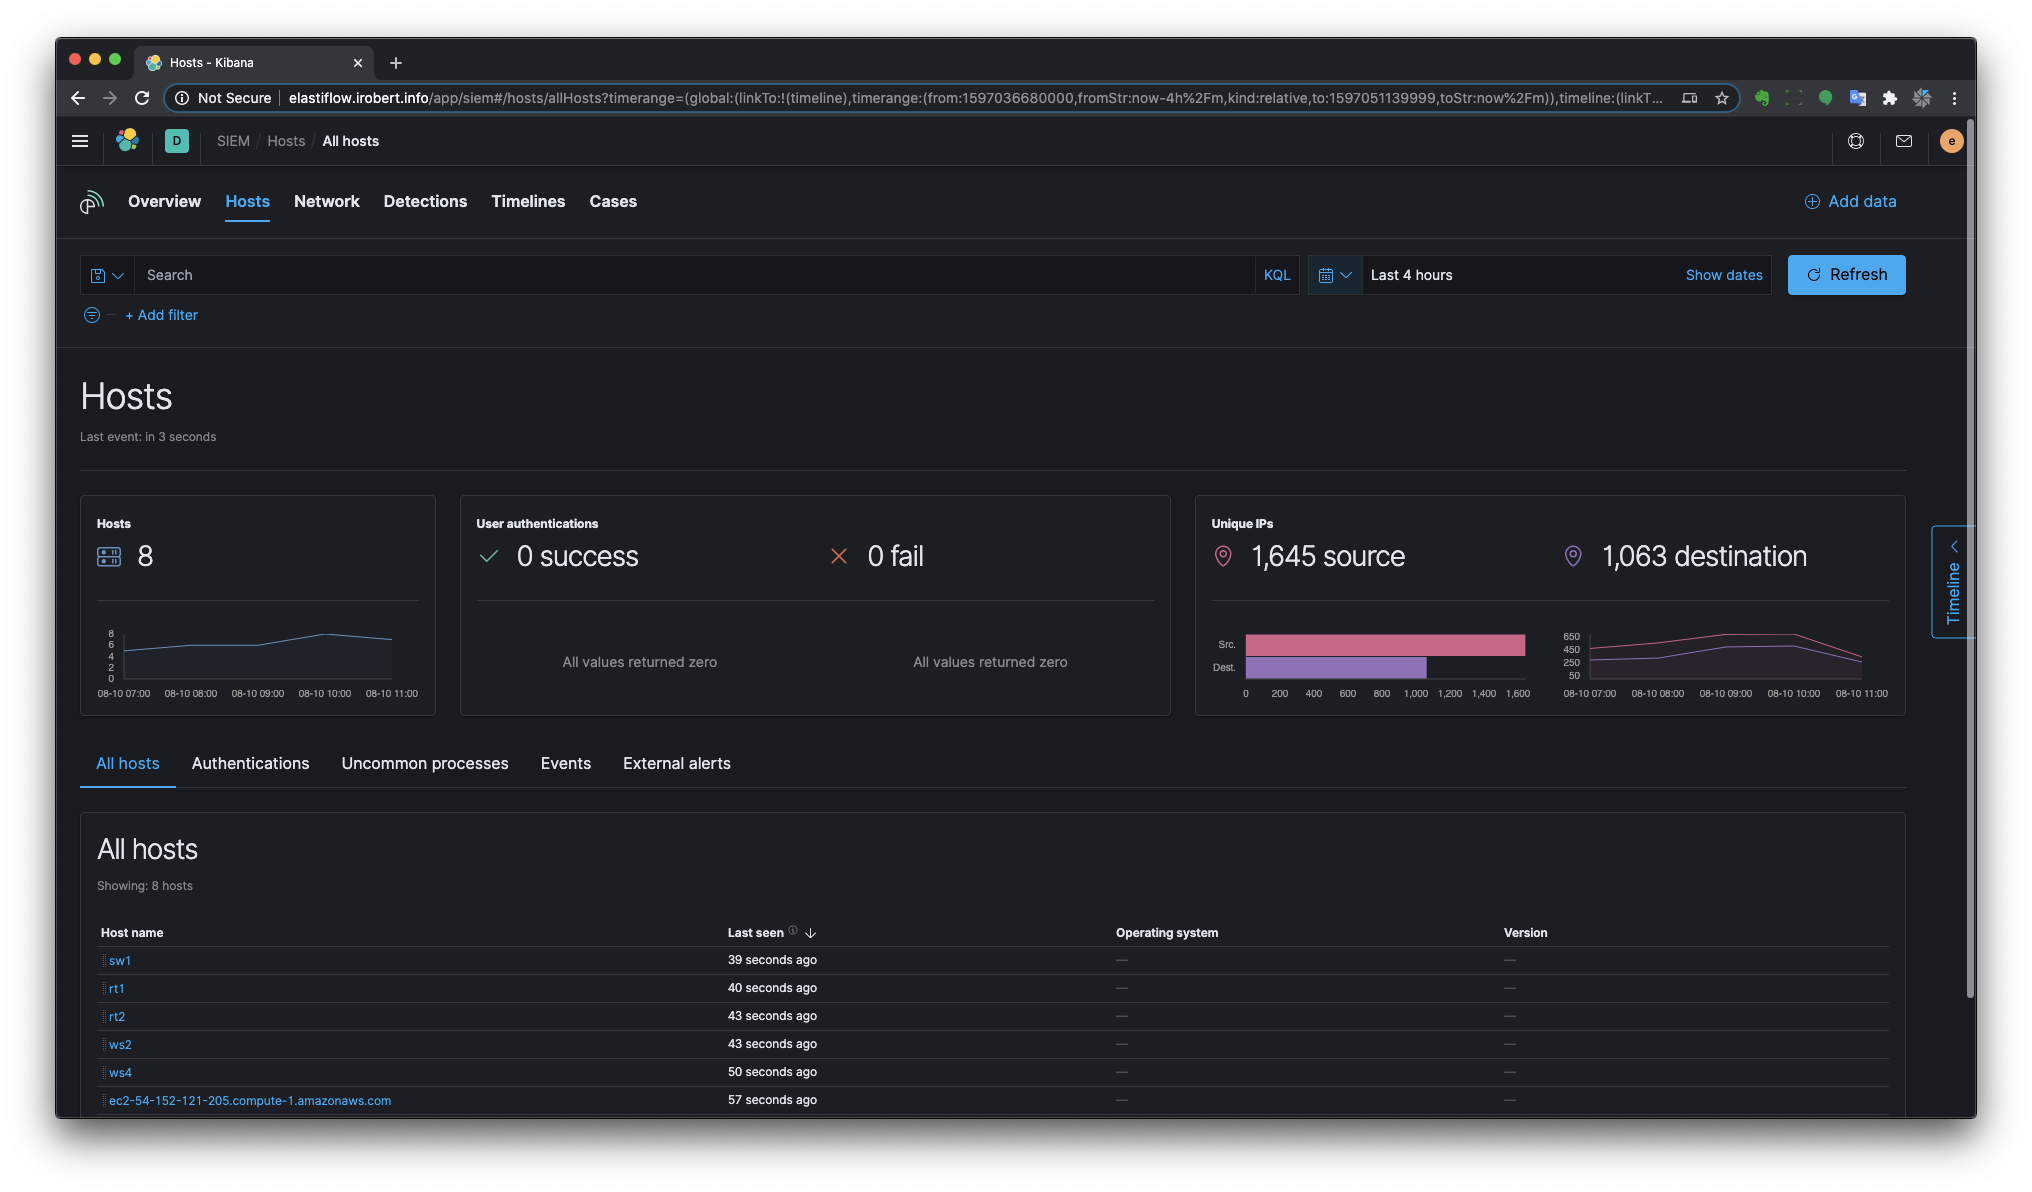
Kibana App Compatibility
SIEM


Logs

Provided Dashboards
The following dashboards are provided.
NOTE: The dashboards are optimized for a monitor resolution of 1920x1080.
Overview

Top-N
There are separate Top-N dashboards for Top Talkers, Services, Conversations and Applications.
Top Talkers

Top Services

Top Conversations

Top Applications

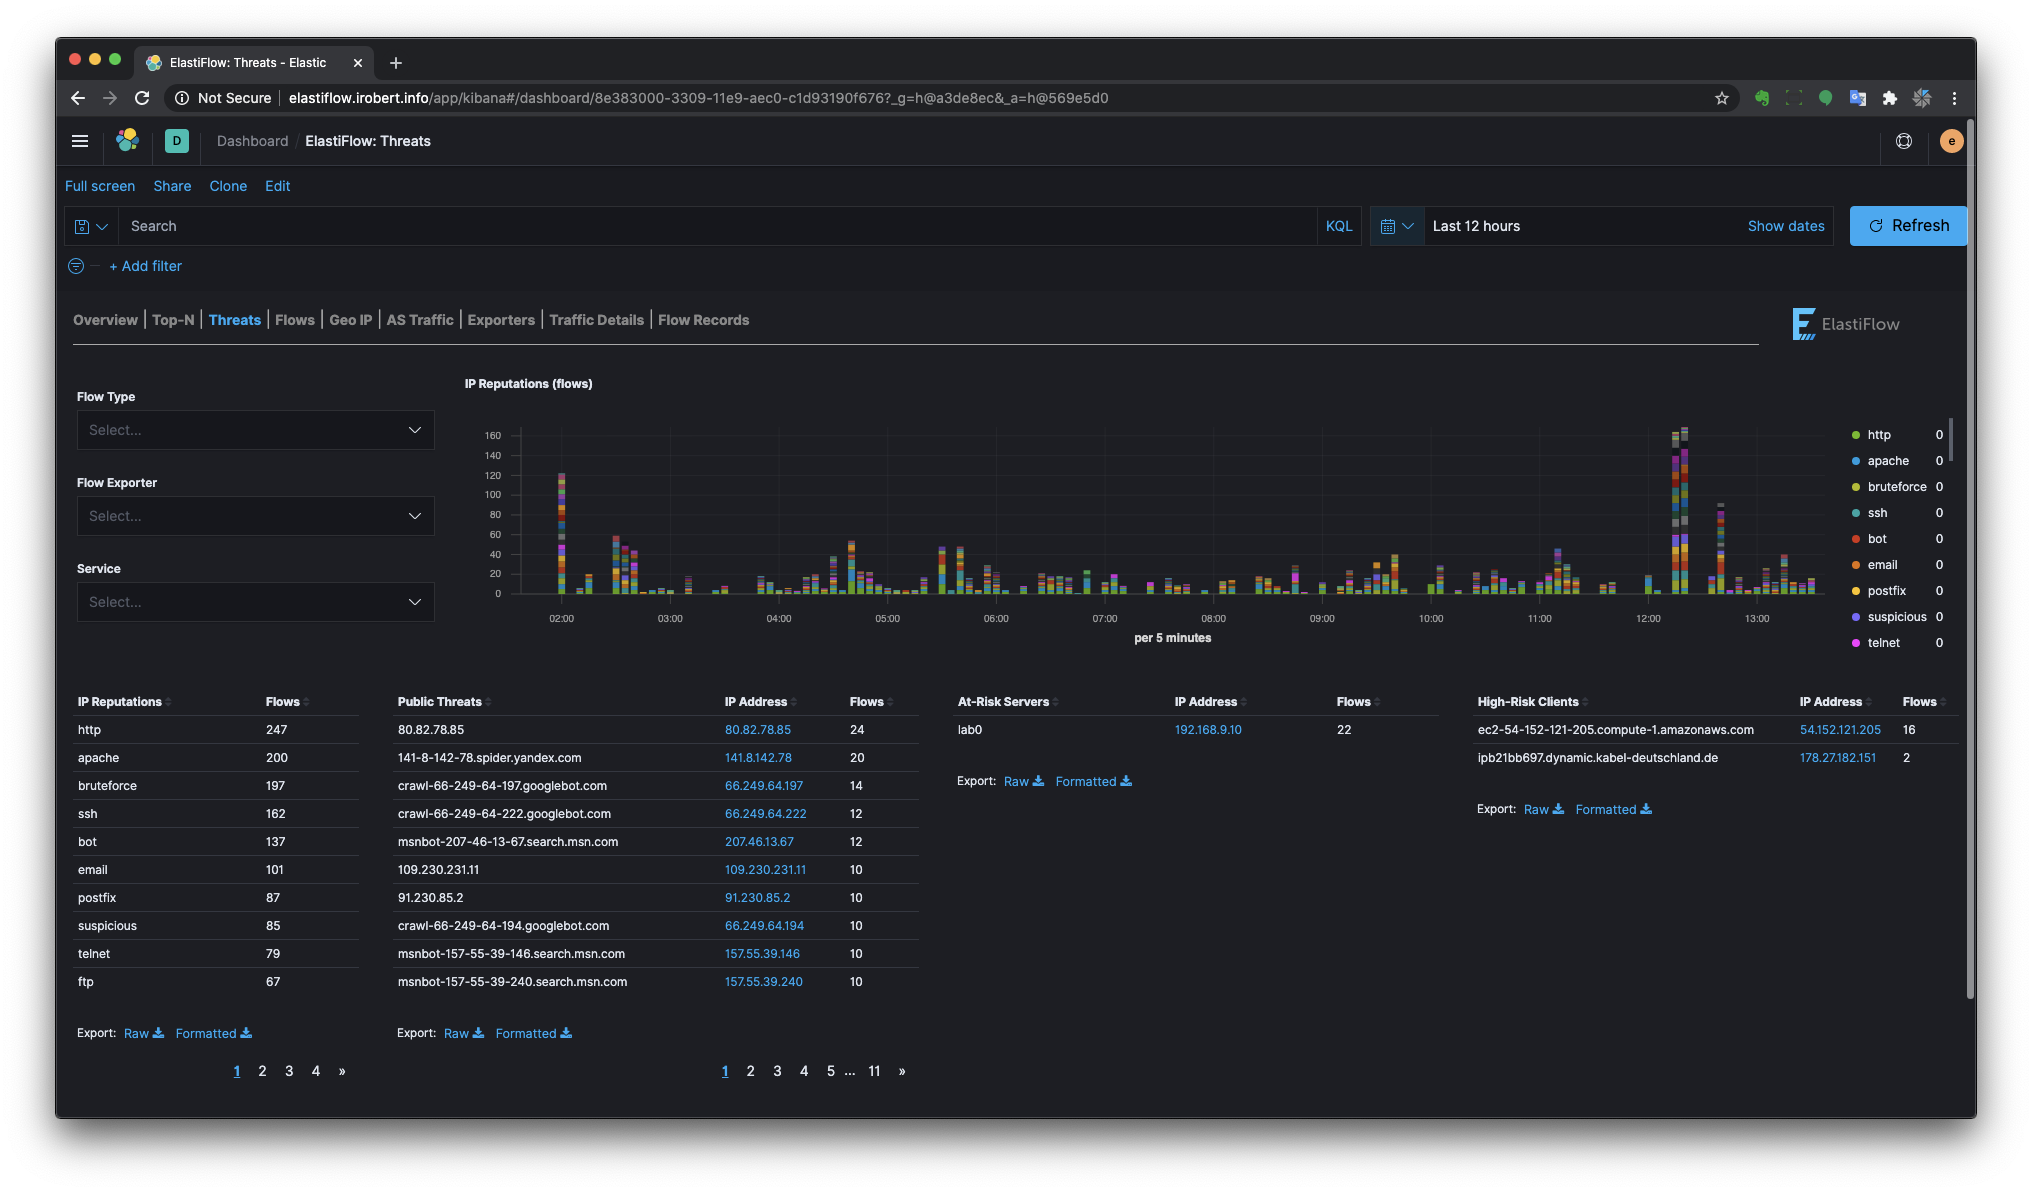
Threats
ElastiFlow™ includes a dictionary of public IP addresses that are known to have a poor reputation. This dictionary is built from many OSINT data sources, normalized to a common taxonomy. The Threats dashboard uses this IP reputation information to highlight three threat/risk types.
- Public Threats - Public clients with a poor IP reputation that are reaching private addresses.
- At-Risk Servers - Private Servers that are being reached by clients with a poor IP reputation.
- High-Risk Clients - Private clients that are accessing public servers which have a poor reputation.
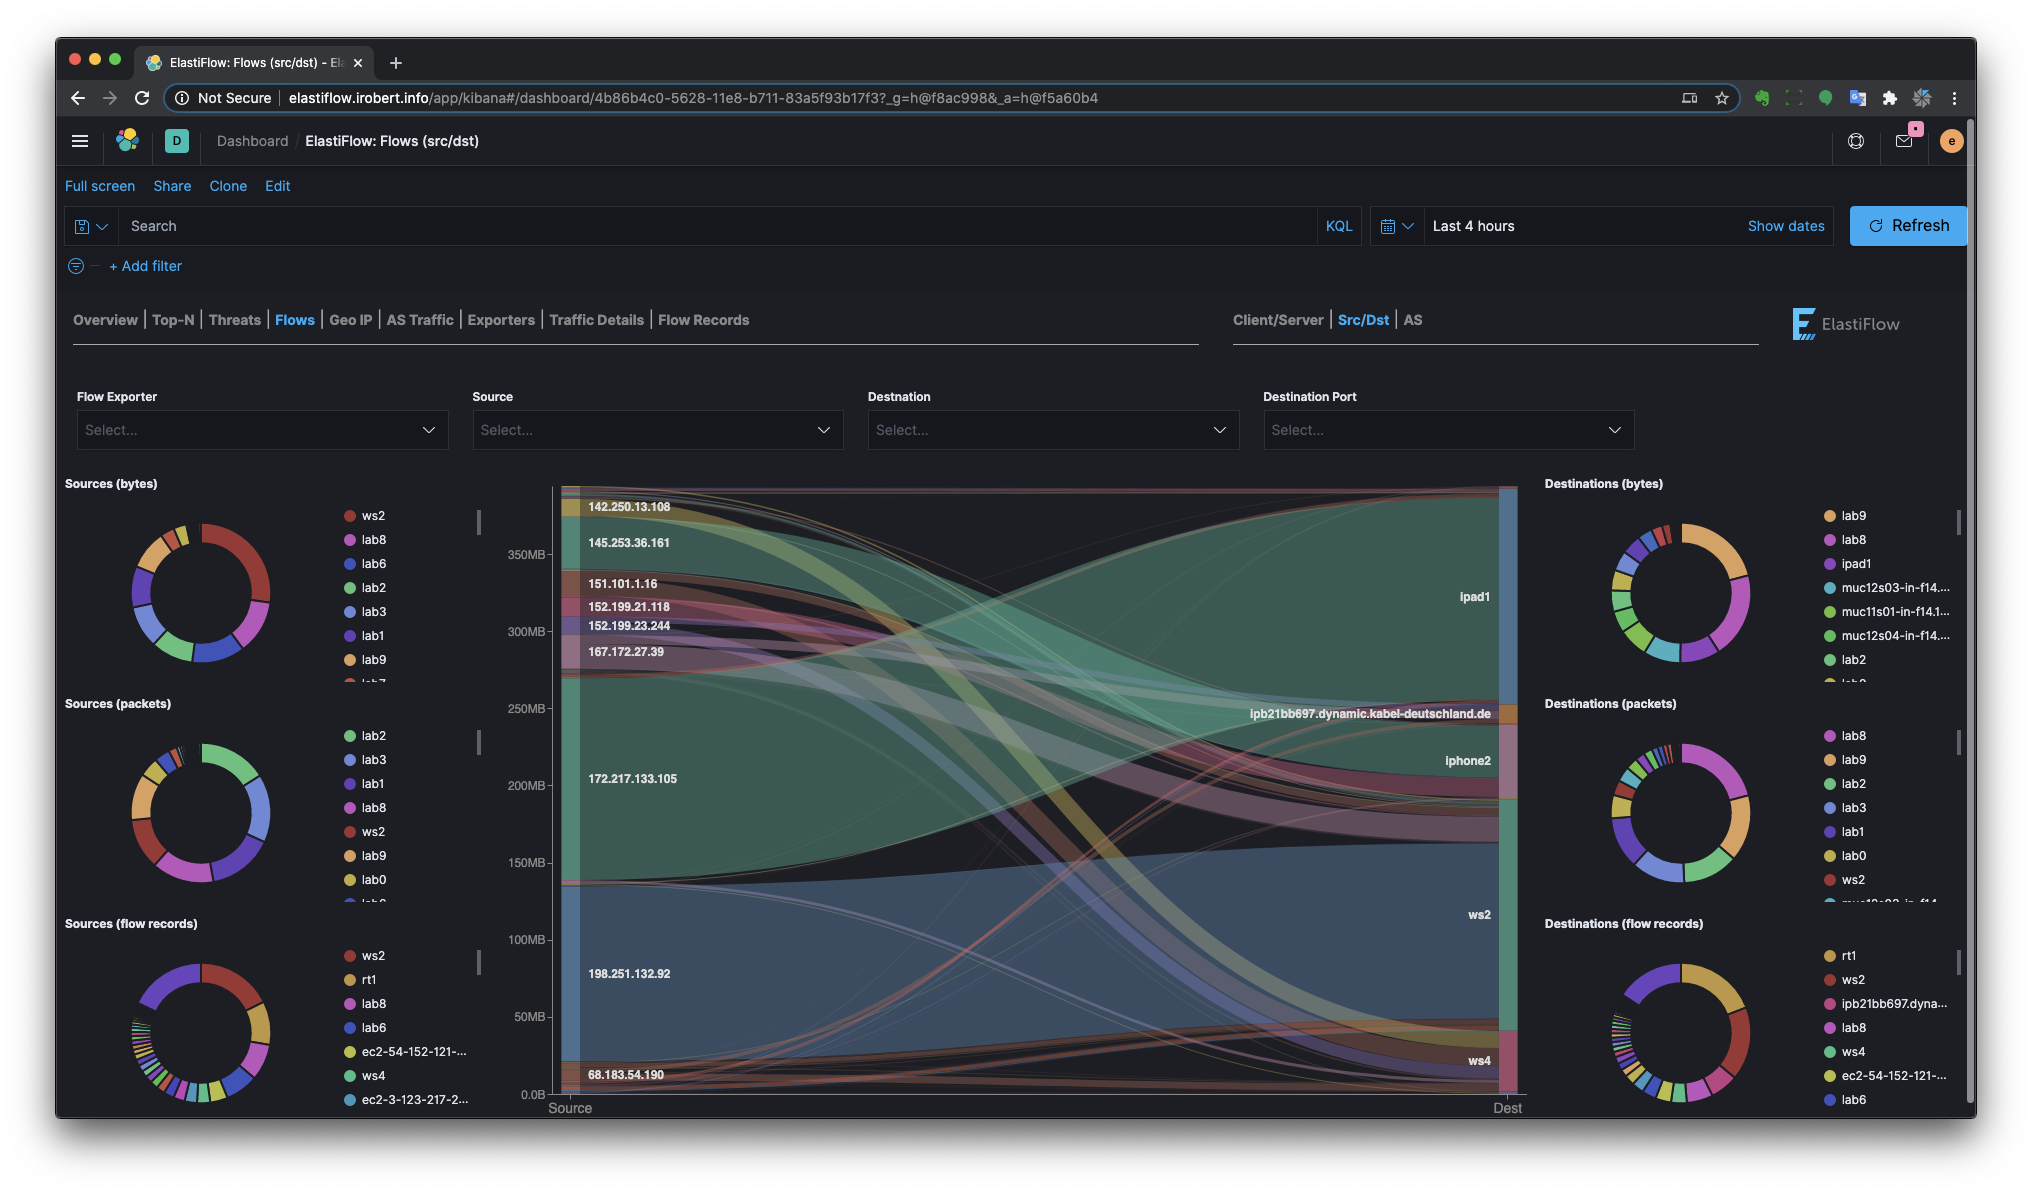
Flows
There are separate Sankey dashboards for Client/Server, Source/Destination and Autonomous System perspectives. The sankey visualizations are built using the new Vega visualization plugin.
Client/Server Flows

Source/Destination Flows
Autonomous System Flows

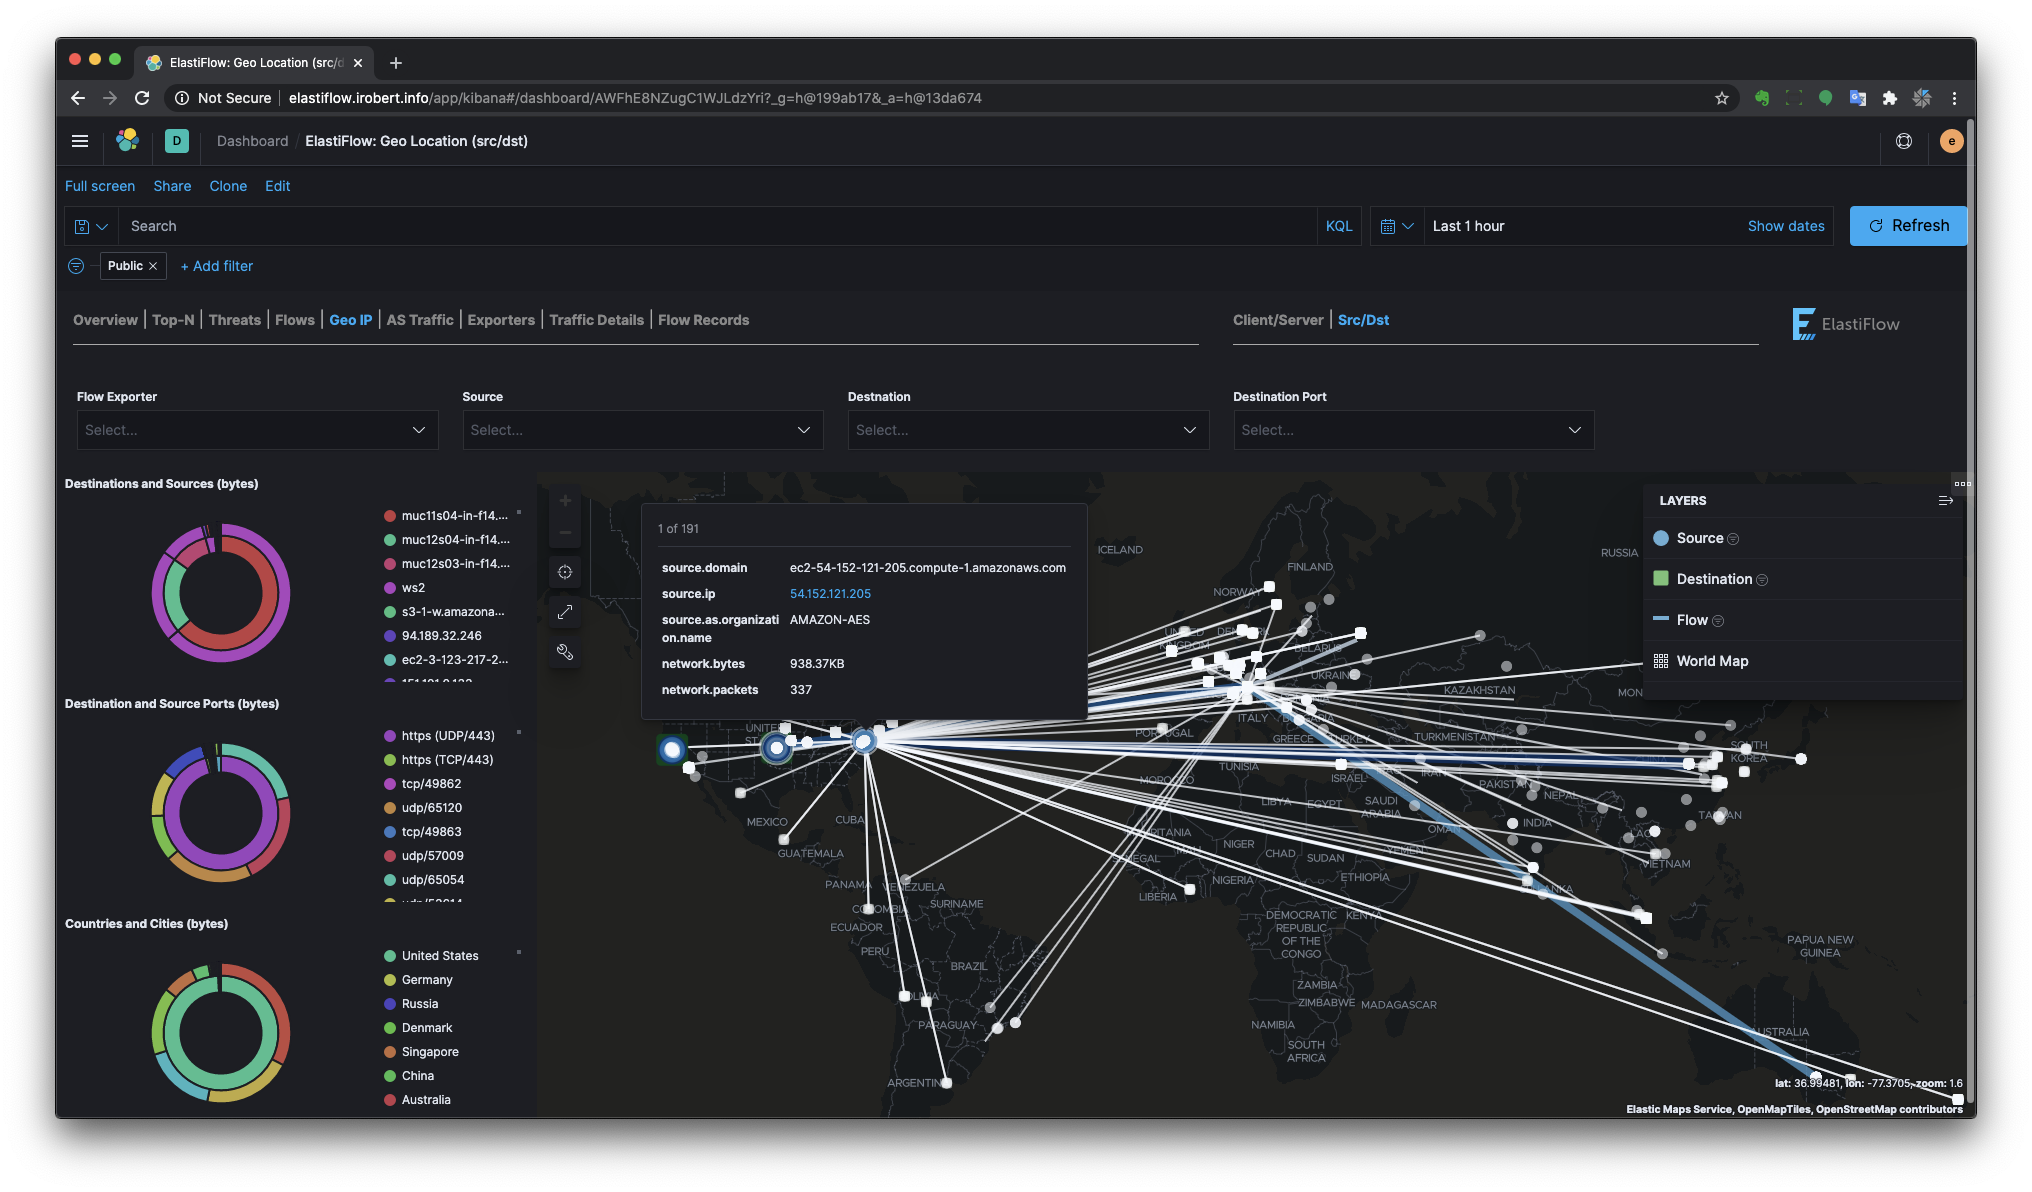
Geo IP
There are separate Geo Location dashboards for Client/Server and Source/Destination perspectives.
Client/Server Geo IP

Source/Destination Geo IP
AS Traffic
Provides a view of traffic to and from Autonomous Systems (public IP ranges)

Flow Exporters

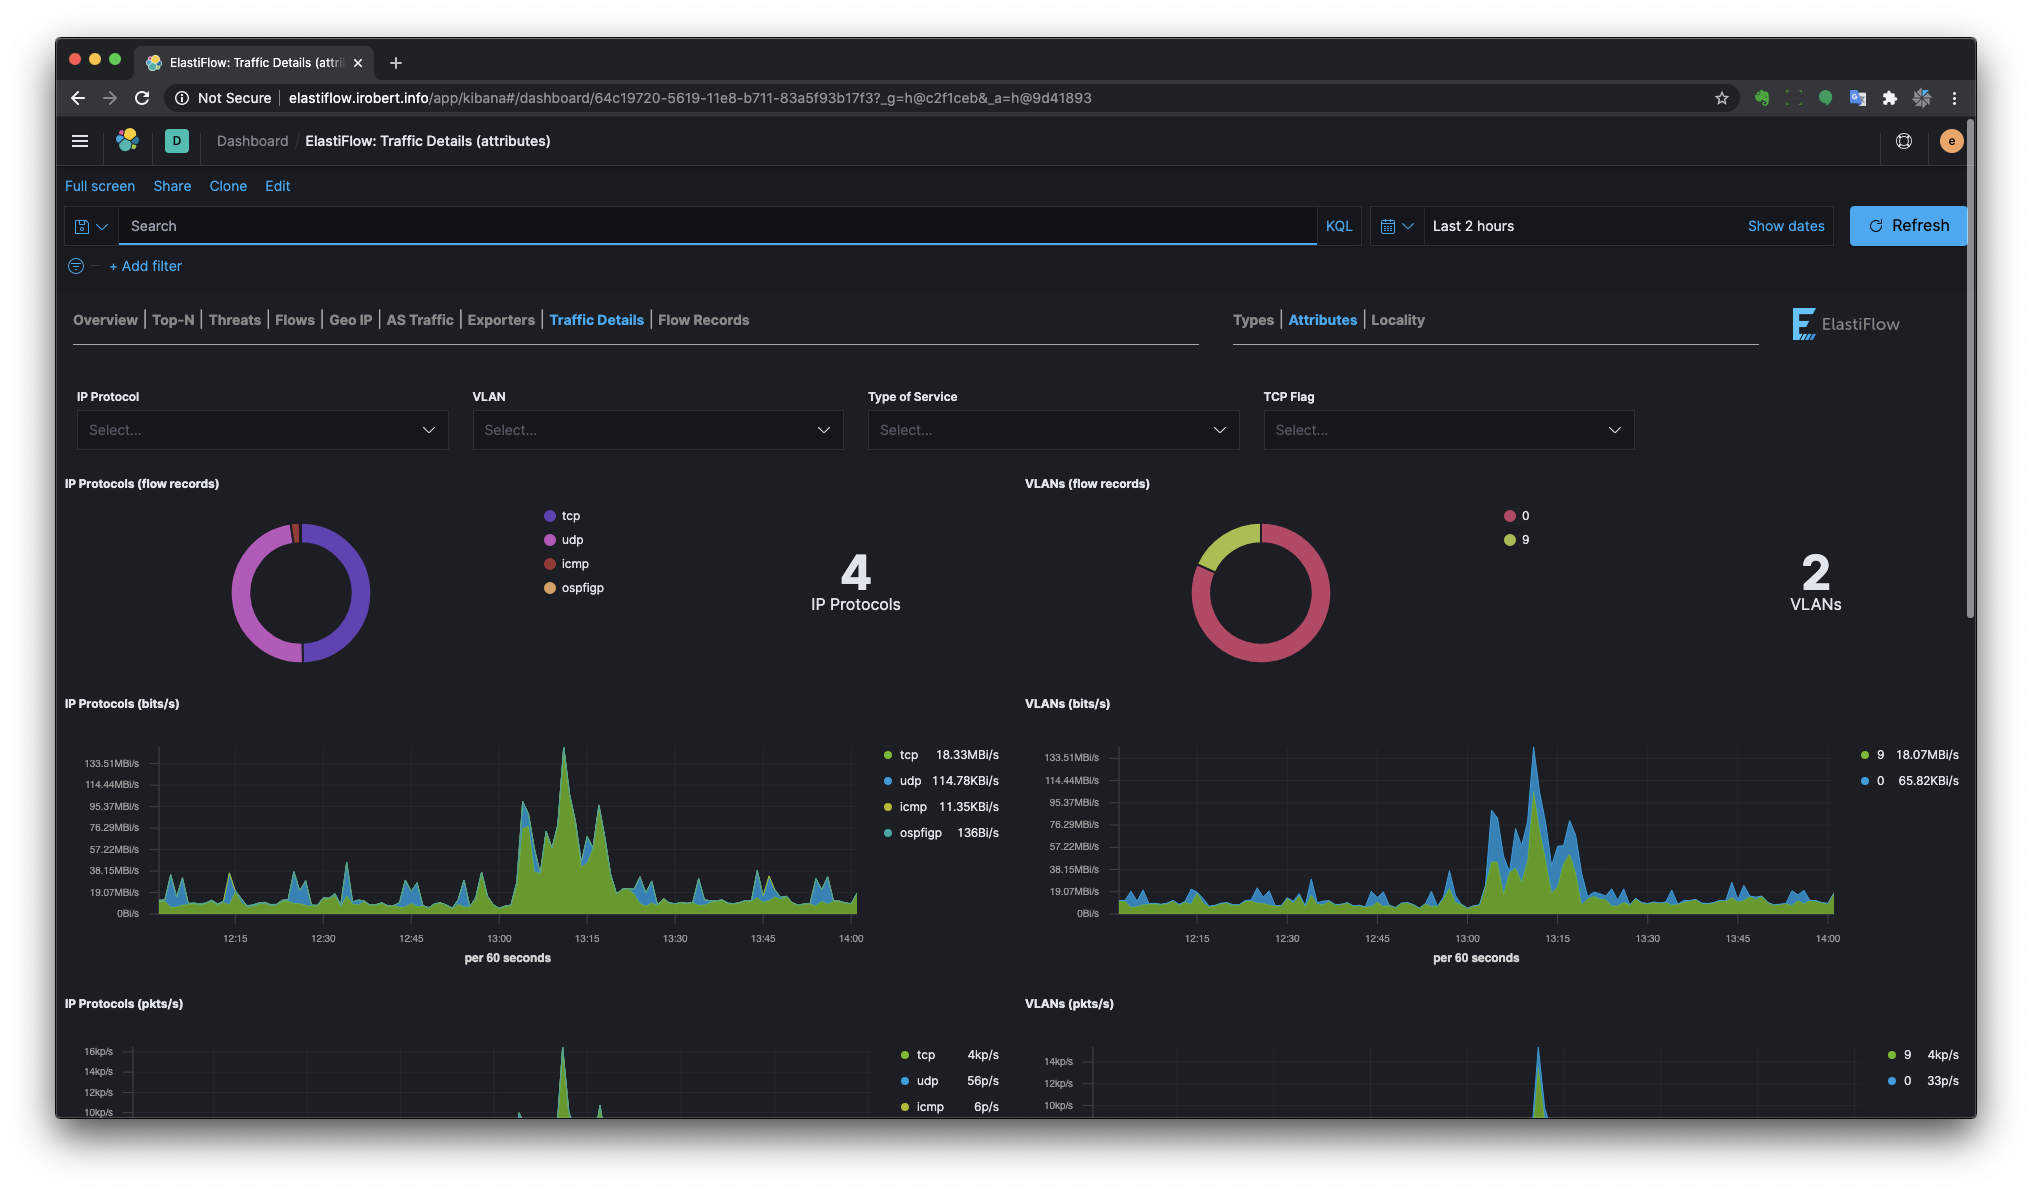
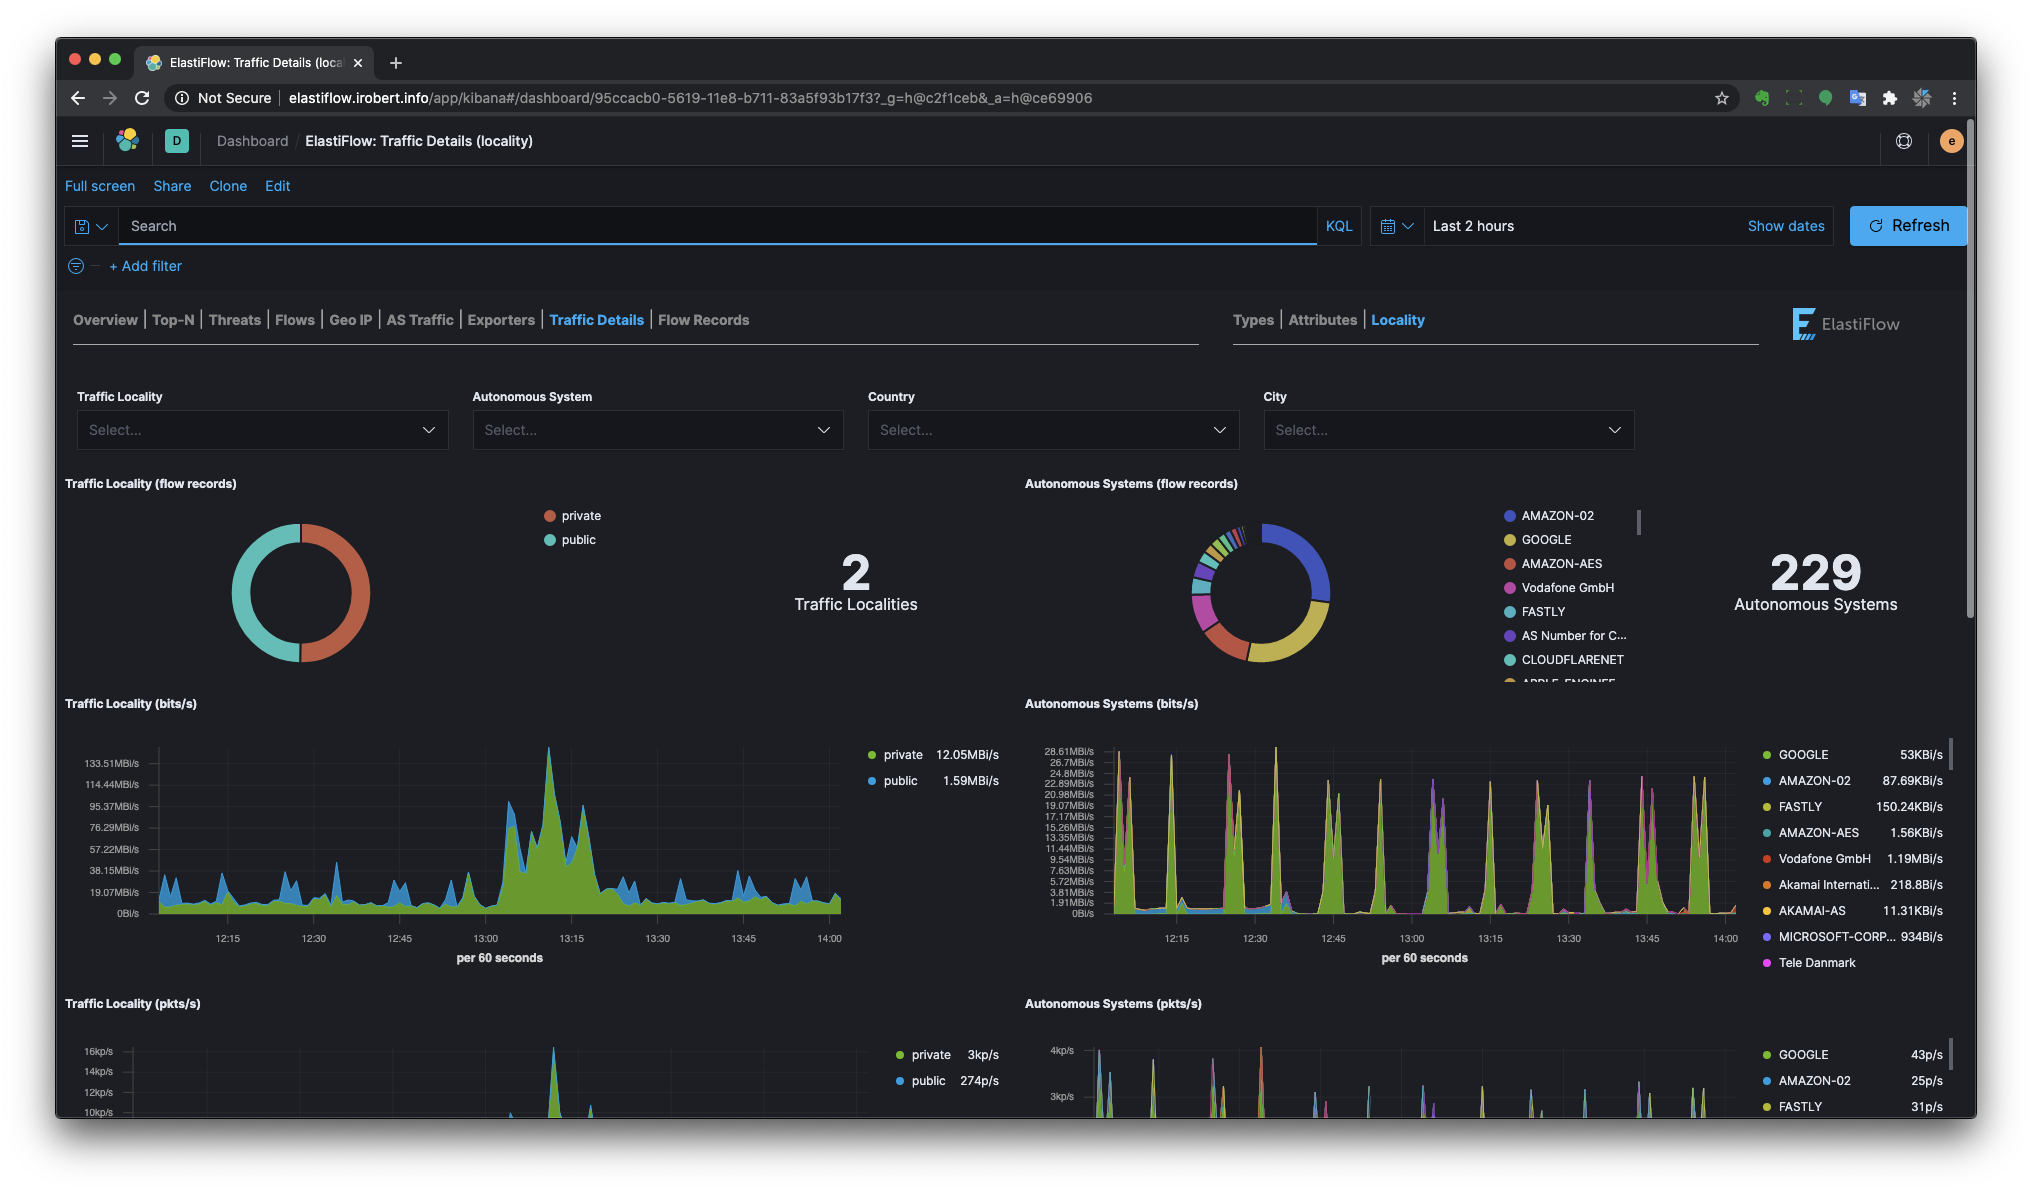
Traffic Details
Provides more detailed breakdown of various network traffic characteristics.
Traffic Types

Traffic Attributes
Traffic Locality
Flow Records
Client/Server

Source/Destination

Ziften ZFlow
ElastiFlow™ v3.4.0 added support for IPFIX records from Ziften's ZFlow agent. In addition to being fully integrated with the standard dashboards, a stand-alone ZFlow dashboards displays network traffic based on user and command data provided by ZFlow.

Attribution
This product includes GeoLite2 data created by MaxMind, available from (http://www.maxmind.com)
Top Related Projects
BCC - Tools for BPF-based Linux IO analysis, networking, monitoring, and more
:tropical_fish: Beats - Lightweight shippers for Elasticsearch & Logstash
Web-based Traffic and Security Network Traffic Monitoring
Agent for collecting, processing, aggregating, and writing metrics, logs, and other arbitrary data.
The Prometheus monitoring system and time series database.
Convert designs to code with AI
Introducing Visual Copilot: A new AI model to turn Figma designs to high quality code using your components.
Try Visual Copilot