 AAChartCore
📈📊☕️☕️☕️An elegant modern declarative data visualization chart framework for Android. Extremely powerful, supports line, spline, area, areaspline, column, bar, pie, scatter, angular gauges, arearange, areasplinerange, columnrange, bubble, box plot, error bars, funnel, waterfall and polar chart types.极其精美而又强大的 Android 数据可视化图表框架,支持柱状图、条形图、折线图、曲线图、折线填充图、曲线填充图、气泡图、扇形图、环形图、散点图、雷达图、混合图等各种类型的多达几十种的信息图图表,完全满足工作所需.
Top Related Projects

Highcharts JS, the JavaScript charting framework

Simple HTML5 Charts using the <canvas> tag

Bring data to life with SVG, Canvas and HTML. :bar_chart::chart_with_upwards_trend::tada:

JavaScript 3D Library.

Open-source JavaScript charting library behind Plotly and Dash

Apache ECharts is a powerful, interactive charting and data visualization library for browser
Quick Overview
AAChartCore is a powerful and highly customizable iOS/Swift/macOS/tvOS/WatchOS chart library, which is based on the popular JavaScript charting library, Highcharts. It provides a wide range of chart types, including line, area, column, bar, pie, scatter, and more, and allows for extensive customization of the chart's appearance and behavior.
Pros
- Extensive Charting Capabilities: AAChartCore supports a wide range of chart types, allowing developers to create visually appealing and informative data visualizations.
- Highly Customizable: The library offers a vast array of customization options, enabling developers to tailor the charts to their specific needs.
- Cross-Platform Compatibility: AAChartCore can be used on iOS, Swift, macOS, tvOS, and WatchOS, making it a versatile choice for developers working across multiple platforms.
- Active Development and Community: The project has an active development team and a growing community of contributors, ensuring ongoing support and improvements.
Cons
- Learning Curve: The library's extensive customization options can make it challenging for beginners to get started, as there is a learning curve involved.
- Dependency on Objective-C: While the library is primarily written in Swift, it has some dependencies on Objective-C, which may be a concern for developers working in a pure Swift environment.
- Limited Documentation: The project's documentation, while generally good, could be more comprehensive, especially for more advanced use cases.
- Performance Concerns: Some users have reported performance issues with the library, particularly when dealing with large datasets or complex chart configurations.
Code Examples
Here are a few examples of how to use AAChartCore in your Swift projects:
- Creating a Basic Line Chart:
let chartView = AAChartView()
let chartModel = AAChartModel()
    .chartType(.line)
    .title("Basic Line Chart")
    .series([
        AASeriesElement()
            .name("Tokyo")
            .data([7.0, 6.9, 9.5, 14.5, 18.2, 21.5, 25.2, 26.5, 23.3, 18.3, 13.9, 9.6])
    ])
chartView.aa_drawChartWithChartModel(chartModel)
- Customizing the Chart Appearance:
let chartModel = AAChartModel()
    .chartType(.column)
    .title("Customized Column Chart")
    .subtitle("With Gradient Fill")
    .xAxisCategories(["Jan", "Feb", "Mar", "Apr", "May", "Jun"])
    .yAxisTitle("Precipitation (mm)")
    .series([
        AASeriesElement()
            .name("Tokyo")
            .data([49.9, 71.5, 106.4, 129.2, 144.0, 176.0])
            .color(AAGradientColor.linearGradient(
                startColor: "#007bff",
                endColor: "#6c757d"
            ))
    ])
- Handling User Interactions:
let chartView = AAChartView()
chartView.delegate = self

// Implement the delegate method to handle user interactions
extension YourViewController: AAChartViewDelegate {
    func aaChartView(_ aaChartView: AAChartView, didSelectDataSeriesElement dataSeries: AASeriesElement, atIndex index: Int) {
        print("You clicked on the data point at index: \(index)")
    }
}
- Integrating with SwiftUI:
struct ChartView: UIViewRepresentable {
    func makeUIView(context: Context) -> AAChartView {
        let chartView = AAChartView()
        let chartModel = AAChartModel()
            .chartType(.column)
            .title("SwiftUI Integration")
            .series([
                AASeriesElement()
                    .name("Tokyo")
                    .data([49.9, 71.5, 106.4, 129.
Competitor Comparisons
Highcharts JS, the JavaScript charting framework
Pros of Highcharts
- More extensive documentation and examples
- Wider range of chart types and customization options
- Larger community and ecosystem
Cons of Highcharts
- Commercial license required for most use cases
- Steeper learning curve due to more complex API
- Larger file size, potentially impacting load times
Code Comparison
AAChartCore:
val aaChartModel = AAChartModel()
    .chartType(AAChartType.Area)
    .title("Title")
    .subtitle("Subtitle")
    .dataLabelsEnabled(true)
    .series(arrayOf(
        AASeriesElement()
            .name("Tokyo")
            .data(arrayOf(7.0, 6.9, 9.5, 14.5, 18.2, 21.5, 25.2, 26.5, 23.3, 18.3, 13.9, 9.6))
    ))
Highcharts:
Highcharts.chart('container', {
    chart: { type: 'area' },
    title: { text: 'Title' },
    subtitle: { text: 'Subtitle' },
    plotOptions: { series: { dataLabels: { enabled: true } } },
    series: [{
        name: 'Tokyo',
        data: [7.0, 6.9, 9.5, 14.5, 18.2, 21.5, 25.2, 26.5, 23.3, 18.3, 13.9, 9.6]
    }]
});
Both libraries offer similar functionality for creating charts, but AAChartCore provides a more fluent API in Kotlin, while Highcharts uses a JavaScript object-based configuration. Highcharts offers more advanced features and customization options, but AAChartCore provides a simpler, more straightforward approach for basic charting needs.
Simple HTML5 Charts using the <canvas> tag
Pros of Chart.js
- Larger community and ecosystem, with more plugins and extensions available
- More comprehensive documentation and examples
- Supports a wider range of chart types out-of-the-box
Cons of Chart.js
- Steeper learning curve for complex customizations
- Larger file size, which may impact page load times
- Less native support for 3D charts and animations
Code Comparison
Chart.js:
new Chart(ctx, {
    type: 'bar',
    data: {
        labels: ['Red', 'Blue', 'Yellow', 'Green', 'Purple', 'Orange'],
        datasets: [{
            label: '# of Votes',
            data: [12, 19, 3, 5, 2, 3]
        }]
    }
});
AAChartCore:
AAChartModel()
    .chartType(AAChartType.Bar)
    .title("Bar Chart")
    .categories(arrayOf("Red", "Blue", "Yellow", "Green", "Purple", "Orange"))
    .series(arrayOf(
        AASeriesElement()
            .name("Votes")
            .data(arrayOf(12, 19, 3, 5, 2, 3))
    ))
Both libraries offer easy-to-use APIs for creating charts, but Chart.js uses a more JavaScript-centric approach, while AAChartCore provides a Kotlin-friendly interface. Chart.js offers more flexibility in data structure, while AAChartCore focuses on a more streamlined, declarative syntax.
Bring data to life with SVG, Canvas and HTML. :bar_chart::chart_with_upwards_trend::tada:
Pros of d3
- Highly flexible and customizable, allowing for complex and unique visualizations
- Large and active community, extensive documentation, and numerous examples
- Supports a wide range of chart types and data visualization techniques
Cons of d3
- Steeper learning curve, especially for beginners
- Requires more code and setup for basic charts compared to AAChartCore
- Lower-level API, which can be time-consuming for simple visualizations
Code Comparison
AAChartCore:
AAChartModel aaChartModel = new AAChartModel()
    .chartType(AAChartType.Area)
    .title("Chart Title")
    .subtitle("Chart Subtitle")
    .dataLabelsEnabled(true)
    .series(new AASeriesElement[]{
        new AASeriesElement()
            .name("Tokyo")
            .data(new Object[]{7.0, 6.9, 9.5, 14.5, 18.2, 21.5, 25.2, 26.5, 23.3, 18.3, 13.9, 9.6})
    });
d3:
const svg = d3.select("body").append("svg")
    .attr("width", width + margin.left + margin.right)
    .attr("height", height + margin.top + margin.bottom)
  .append("g")
    .attr("transform", `translate(${margin.left},${margin.top})`);

d3.csv("data.csv").then(function(data) {
  // Chart creation code here
});
JavaScript 3D Library.
Pros of three.js
- More comprehensive 3D rendering capabilities
- Larger community and ecosystem
- Supports a wider range of platforms and browsers
Cons of three.js
- Steeper learning curve
- Larger file size and potentially higher performance overhead
- May be overkill for simple charting needs
Code Comparison
AAChartCore (Java):
AAChartModel aaChartModel = new AAChartModel()
    .chartType(AAChartType.Area)
    .title("Chart Title")
    .subtitle("Chart Subtitle")
    .dataLabelsEnabled(true)
    .series(new AASeriesElement[]{
        new AASeriesElement()
            .name("Tokyo")
            .data(new Object[]{7.0, 6.9, 9.5, 14.5, 18.2, 21.5, 25.2, 26.5, 23.3, 18.3, 13.9, 9.6})
    });
three.js (JavaScript):
const scene = new THREE.Scene();
const camera = new THREE.PerspectiveCamera(75, window.innerWidth / window.innerHeight, 0.1, 1000);
const renderer = new THREE.WebGLRenderer();
renderer.setSize(window.innerWidth, window.innerHeight);
document.body.appendChild(renderer.domElement);
AAChartCore is specifically designed for creating charts in Android applications, offering a simpler API for common chart types. three.js, on the other hand, is a full-fledged 3D library that can create complex 3D scenes and visualizations, but requires more setup and knowledge of 3D graphics concepts.
Open-source JavaScript charting library behind Plotly and Dash
Pros of plotly.js
- More extensive and feature-rich library with a wide range of chart types
- Strong community support and regular updates
- Highly customizable with advanced interactivity options
Cons of plotly.js
- Larger file size and potentially slower load times
- Steeper learning curve due to its extensive API
- May be overkill for simple charting needs
Code Comparison
AAChartCore (Java):
AAChartModel aaChartModel = new AAChartModel()
    .chartType(AAChartType.Area)
    .title("Title")
    .subtitle("Subtitle")
    .dataLabelsEnabled(true)
    .series(new AASeriesElement[]{
        new AASeriesElement()
            .name("Tokyo")
            .data(new Object[]{7.0, 6.9, 9.5, 14.5, 18.2, 21.5, 25.2, 26.5, 23.3, 18.3, 13.9, 9.6})
    });
plotly.js (JavaScript):
var trace = {
  x: [1, 2, 3, 4],
  y: [10, 15, 13, 17],
  type: 'scatter'
};

var data = [trace];
var layout = {title: 'Simple Scatter Plot'};

Plotly.newPlot('myDiv', data, layout);
Both libraries offer easy-to-use APIs for creating charts, but plotly.js provides more flexibility and options for advanced visualizations. AAChartCore focuses on simplicity and ease of use, making it a good choice for basic charting needs in Android applications.
Apache ECharts is a powerful, interactive charting and data visualization library for browser
Pros of ECharts
- More comprehensive and feature-rich charting library
- Supports a wider range of chart types and customization options
- Larger community and more extensive documentation
Cons of ECharts
- Steeper learning curve due to its complexity
- Larger file size, which may impact load times for web applications
Code Comparison
AAChartCore (Java):
AAChartModel aaChartModel = new AAChartModel()
    .chartType(AAChartType.Area)
    .title("Title")
    .subtitle("Subtitle")
    .dataLabelsEnabled(true)
    .series(new AASeriesElement[]{
        new AASeriesElement()
            .name("Tokyo")
            .data(new Object[]{7.0, 6.9, 9.5, 14.5, 18.2, 21.5, 25.2, 26.5, 23.3, 18.3, 13.9, 9.6})
    });
ECharts (JavaScript):
var option = {
    title: { text: 'Title', subtext: 'Subtitle' },
    xAxis: { type: 'category', data: ['Jan', 'Feb', 'Mar', 'Apr', 'May', 'Jun', 'Jul', 'Aug', 'Sep', 'Oct', 'Nov', 'Dec'] },
    yAxis: { type: 'value' },
    series: [{
        name: 'Tokyo',
        type: 'line',
        data: [7.0, 6.9, 9.5, 14.5, 18.2, 21.5, 25.2, 26.5, 23.3, 18.3, 13.9, 9.6]
    }]
};
Both libraries offer easy-to-use APIs for creating charts, but ECharts provides more flexibility and options for customization. AAChartCore focuses on simplicity and ease of use for Android development, while ECharts is a more versatile solution for web-based charting across various platforms.
Convert  designs to code with AI

Introducing Visual Copilot: A new AI model to turn Figma designs to high quality code using your components.
Try Visual CopilotREADME
![]()
AAChartCore
![]()
![]()
![]()
![]()
![]()


![]()
![]()
English Document ð¬ð§ | ç®ä½ä¸æææ¡£ ð¨ð³
There is the link of Kotlin version of AAChartCore as follow
https://github.com/AAChartModel/AAChartCore-Kotlin
Preface
AAChartCore is the Java language version of AAChartKit which is object-oriented, a set of easy-to-use, extremely elegant graphics drawing controls,based on the popular open source front-end chart library Highcharts. It makes it very fast to add interactive charts to your mobile projects. It supports single touch-drag for data inspection, multi-touch for zooming, and advanced responsiveness for your apps .
Features
-
ð Environment friendly. Support all Android platforms. Totally support
Javalanguage, and there are more types version such asKotlinlanguage version AAInfographicsãSwiftlanguage version AAChartKit-Swift ãObjective-clanguage version AAChartKit . To get more details you can see the source code links list. -
ð Powerful and easy to use. It supports
column chart,bar chart,area chart,areaspline chart,line chart,spline chart,radar chart,polar chart,pie chart,bubble chart,pyramid chart,funnel chart,columnrange chart,arearange chart,mixed chartand other graphics. Support for more chart types is planned. -
ð Modern Declarative Syntax. Unlike previous imperative programming techniques, drawing any custom chart in AAChartKit, you don't need to care about the inner implementation details which is annoying && boring. Describe what you want, you will get what you described.
-
ð® Interactive and animated. The charts
animationeffect is exquisite, delicate, smooth and beautiful. -
â Chain programming. Supports concise
chain programming syntax. -
ð¦ Minimalist.
AAChartView + AAChartModel = Chart. The AAChartKit follows a minimalist formula: Chart view + Chart model = The chart you want, just like the powerful and beautiful charts lib AAInfographics. -
ð± Interaction event callback. Support for monitoring user click events and single finger move over events, which can be used to achieve double charts linked-working and even multiple charts linkage, as well as other more complex custom user interaction effects.
Appreciation


Installation
JitPack (Recommend)
allprojects {
    repositories {
        ...
        maven { url 'https://jitpack.io' }
    }
}
dependencies {
    ...
    implementation 'com.github.AAChartModel:AAChartCore:-SNAPSHOT'
}
Usage
- Creat the instance object of chart view:
AAChartView
<com.github.AAChartModel.AAChartCore.AAChartCreator.AAChartView
    android:id="@+id/AAChartView"
    android:layout_width="match_parent"
    android:layout_height="match_parent" />
aaChartView = findViewById(R.id.AAChartView)
- Configure the properties of chart model:
AAChartModel
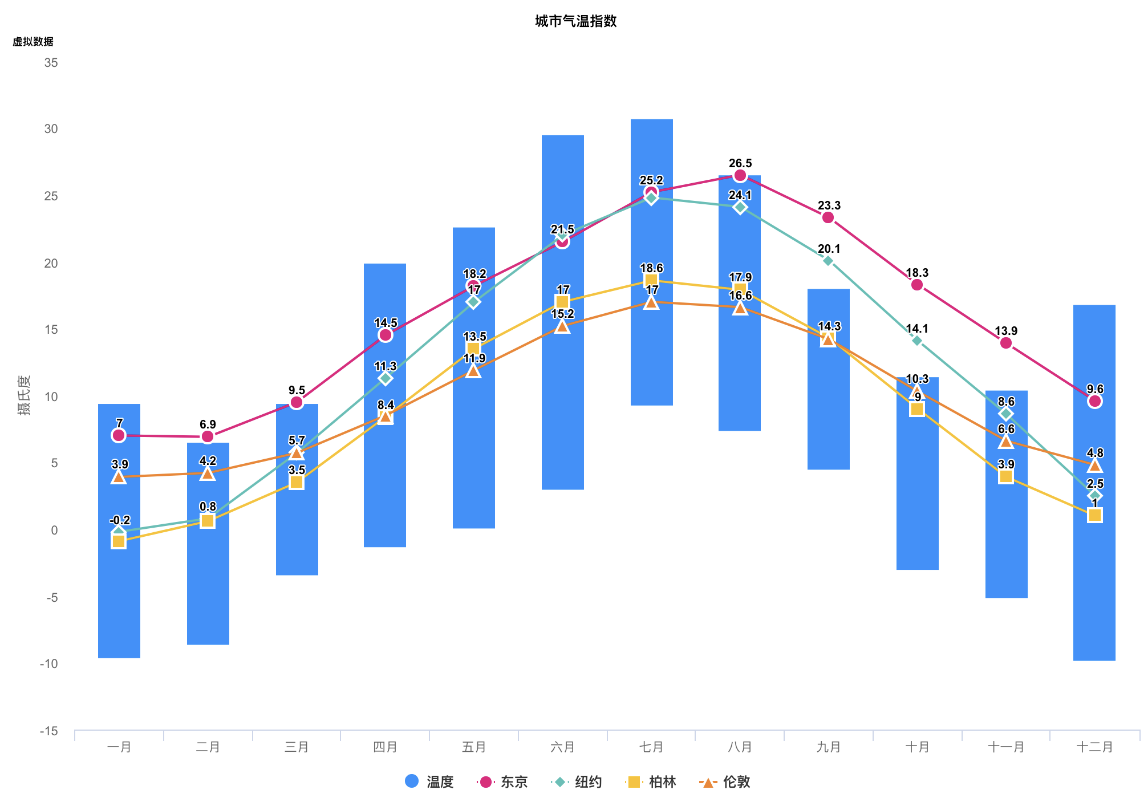
AAChartModel aaChartModel = new AAChartModel()
.chartType(AAChartType.Area)
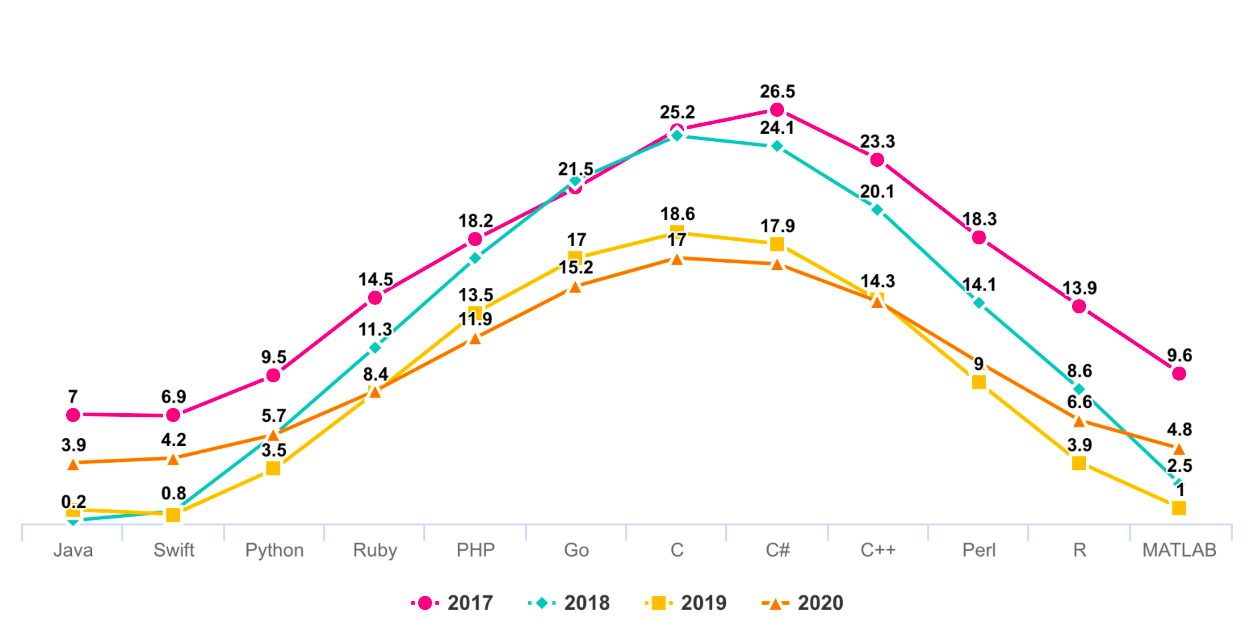
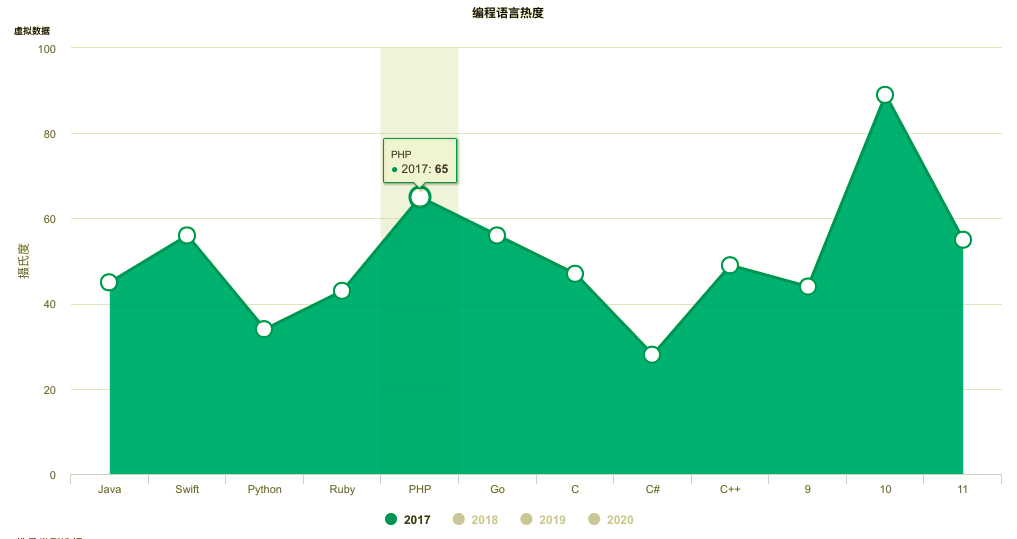
.title("THE HEAT OF PROGRAMMING LANGUAGE")
.subtitle("Virtual Data")
.backgroundColor("#4b2b7f")
.categories(new String[]{"Java", "Swift", "Python", "Ruby", "PHP", "Go", "C", "C#", "C++"})
.dataLabelsEnabled(false)
.yAxisGridLineWidth(0f)
.series(new AASeriesElement[]{
new AASeriesElement()
.name("Tokyo")
.data(new Object[]{7.0, 6.9, 9.5, 14.5, 18.2, 21.5, 25.2, 26.5, 23.3, 18.3, 13.9, 9.6}),
new AASeriesElement()
.name("NewYork")
.data(new Object[]{0.2, 0.8, 5.7, 11.3, 17.0, 22.0, 24.8, 24.1, 20.1, 14.1, 8.6, 2.5}),
new AASeriesElement()
.name("London")
.data(new Object[]{0.9, 0.6, 3.5, 8.4, 13.5, 17.0, 18.6, 17.9, 14.3, 9.0, 3.9, 1.0}),
new AASeriesElement()
.name("Berlin")
.data(new Object[]{3.9, 4.2, 5.7, 8.5, 11.9, 15.2, 17.0, 16.6, 14.2, 10.3, 6.6, 4.8})
});
- Draw the chart(This method is called only for the first time after you create an AAChartView instance object)
        //The chart view object calls the instance object of AAChartModel and draws the final graphic
        aaChartView.aa_drawChartWithChartModel(aaChartModel)
ð¹ð¹ð¹Congratulations! Everything was done!!! You will get what you want!!!
Update chart content
if you want to refresh chart content,you should do something as follow.According to your actual needs, select the function that fits you.
- Only refresh the chart data(This method is recommended to be called for updating the series data dynamically)
        //Only refresh the chart series data
        aaChartView.aa_onlyRefreshTheChartDataWithChartModelSeries(chartModelSeriesArray)
- Refresh the chart, minus the chart data (this method is recommended for subsequent refreshes after the first drawing of graphics has completed. If you want to update the chart data only, you should use the function
aa_onlyRefreshTheChartDataWithChartModelSeries)
        //Refresh the chart after the AAChartModel whole content is updated
        aaChartView.aa_refreshChartWholeContentWithChartModel(aaChartModel)
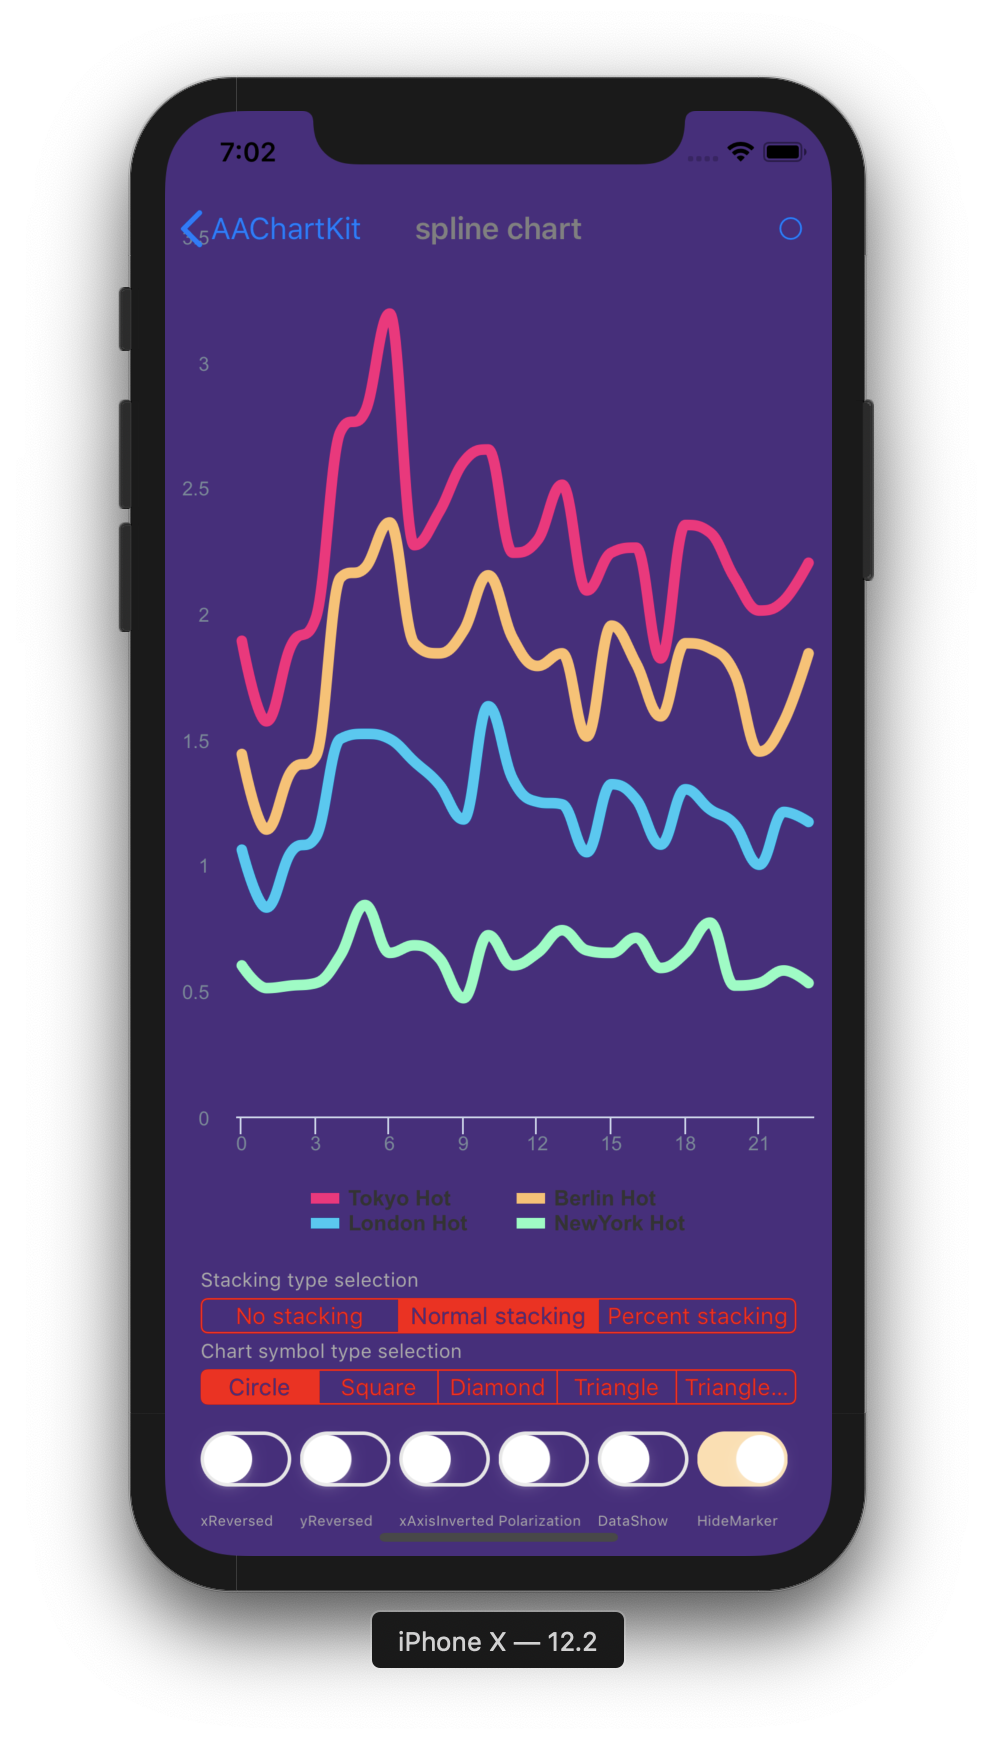
Infographics sample
-
line chart
-
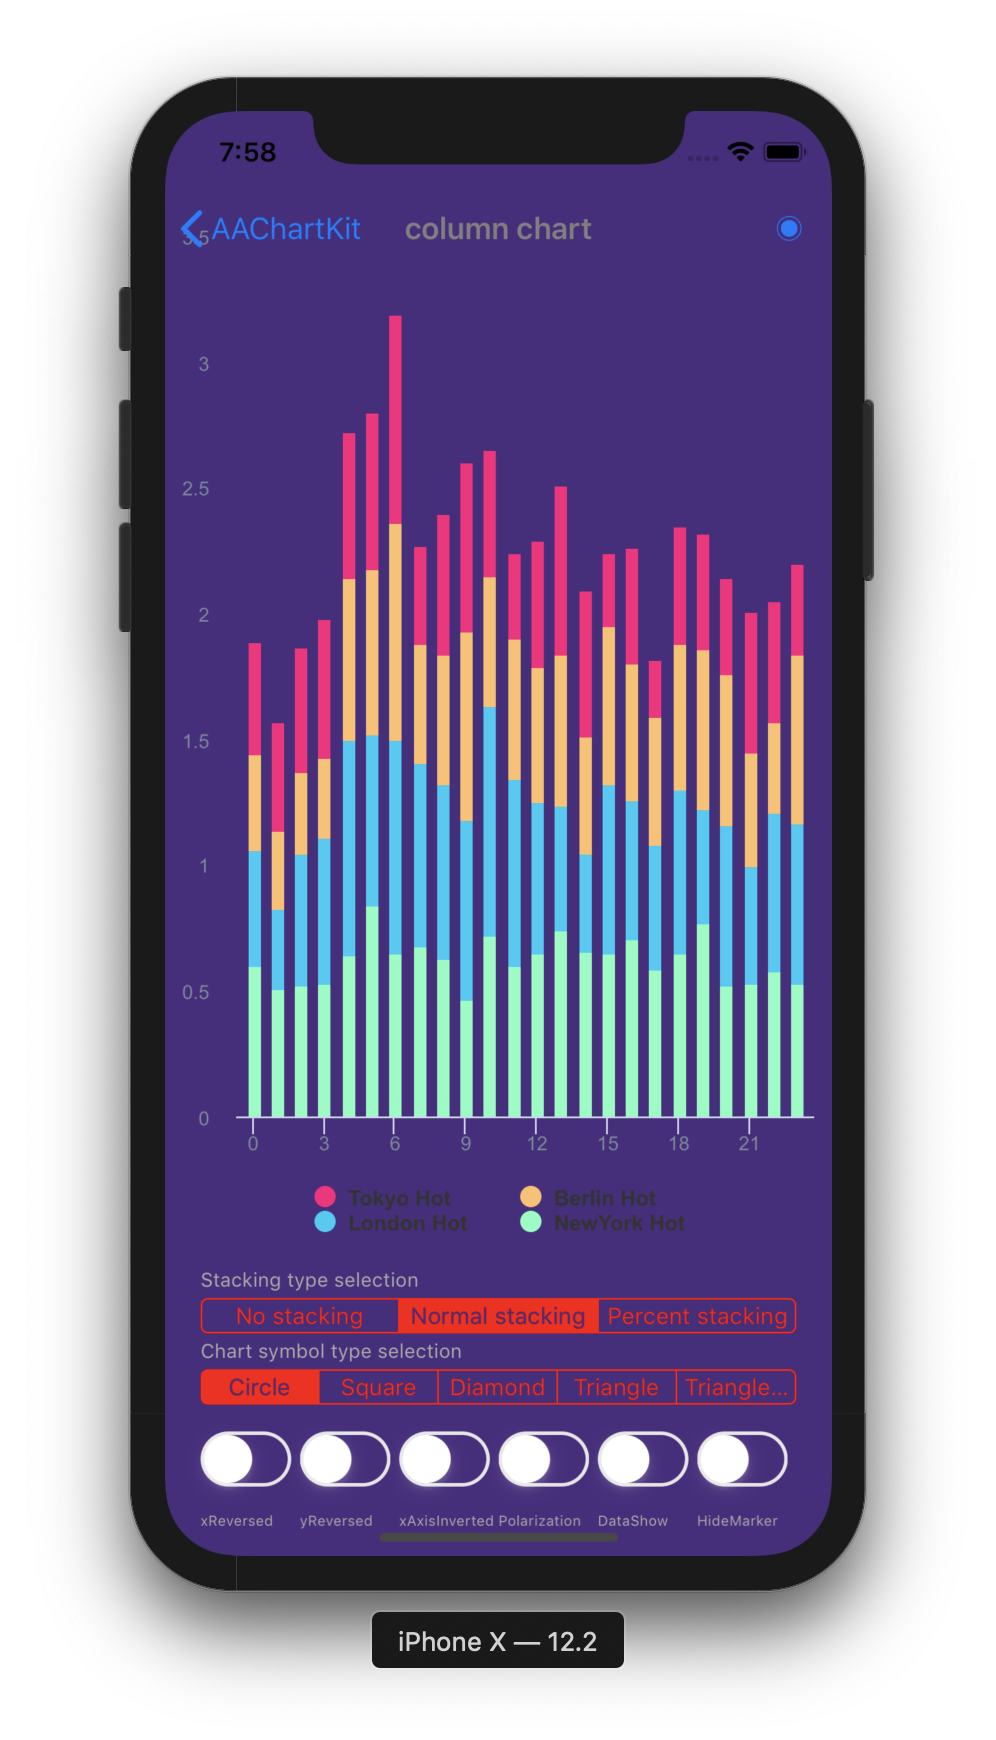
column chart
-
bar chart
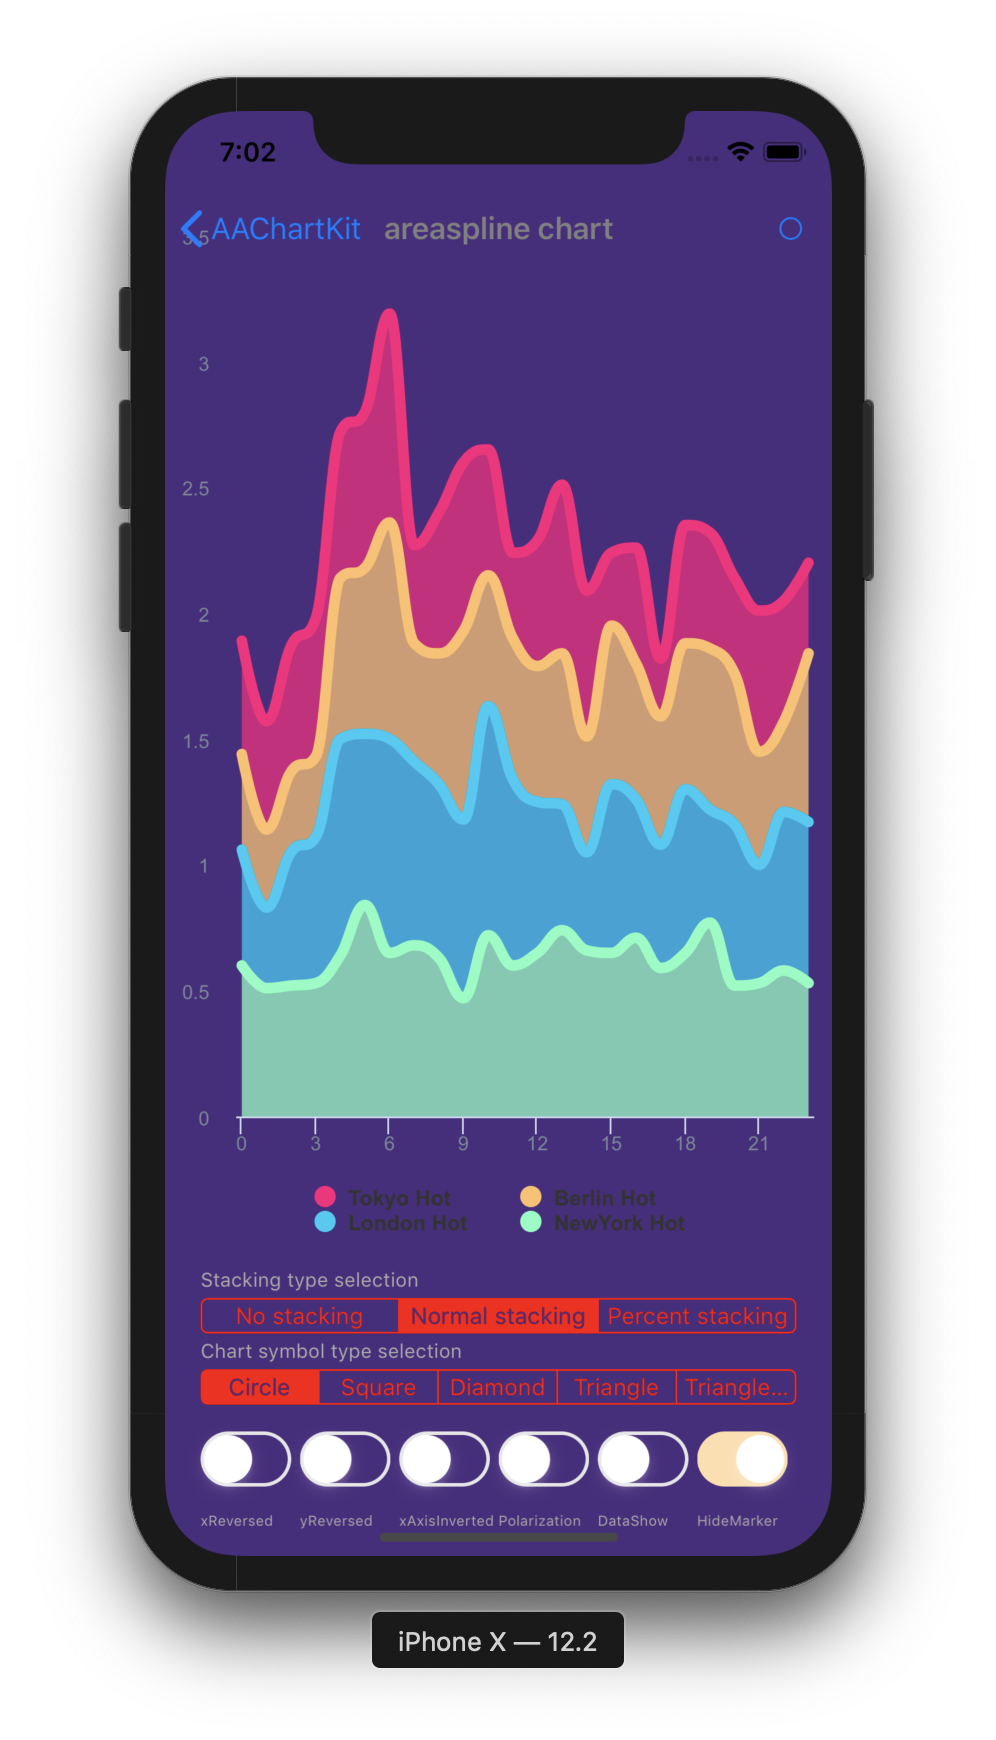
-
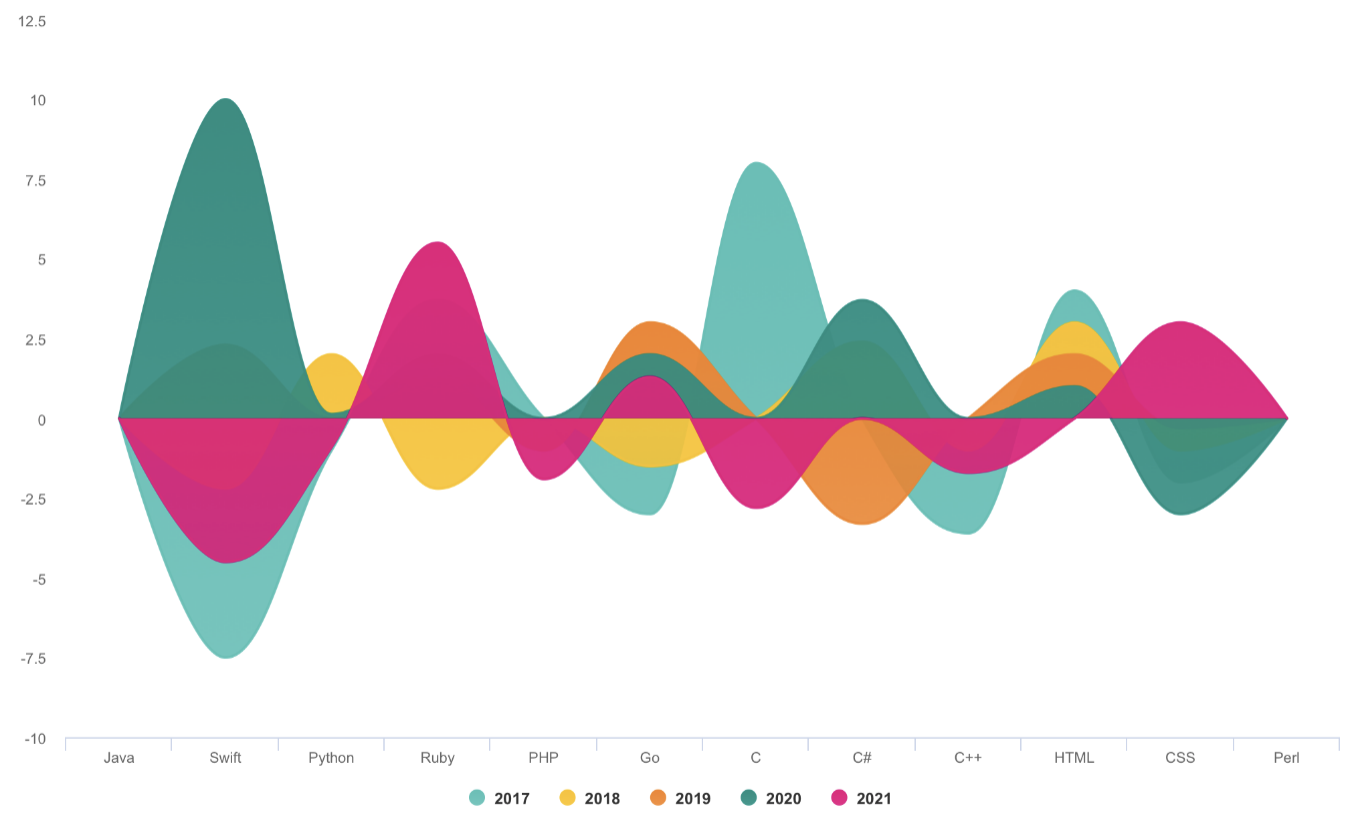
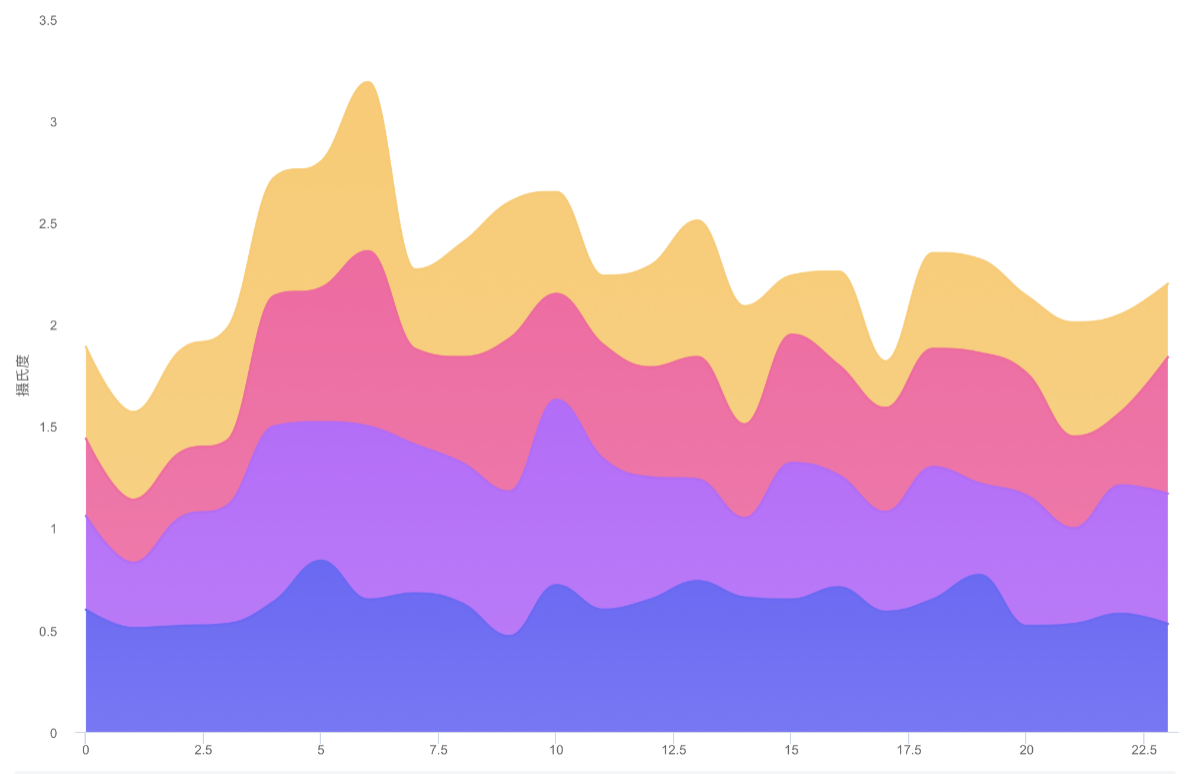
special area chart one
-
special area chart two
-
special area chart three
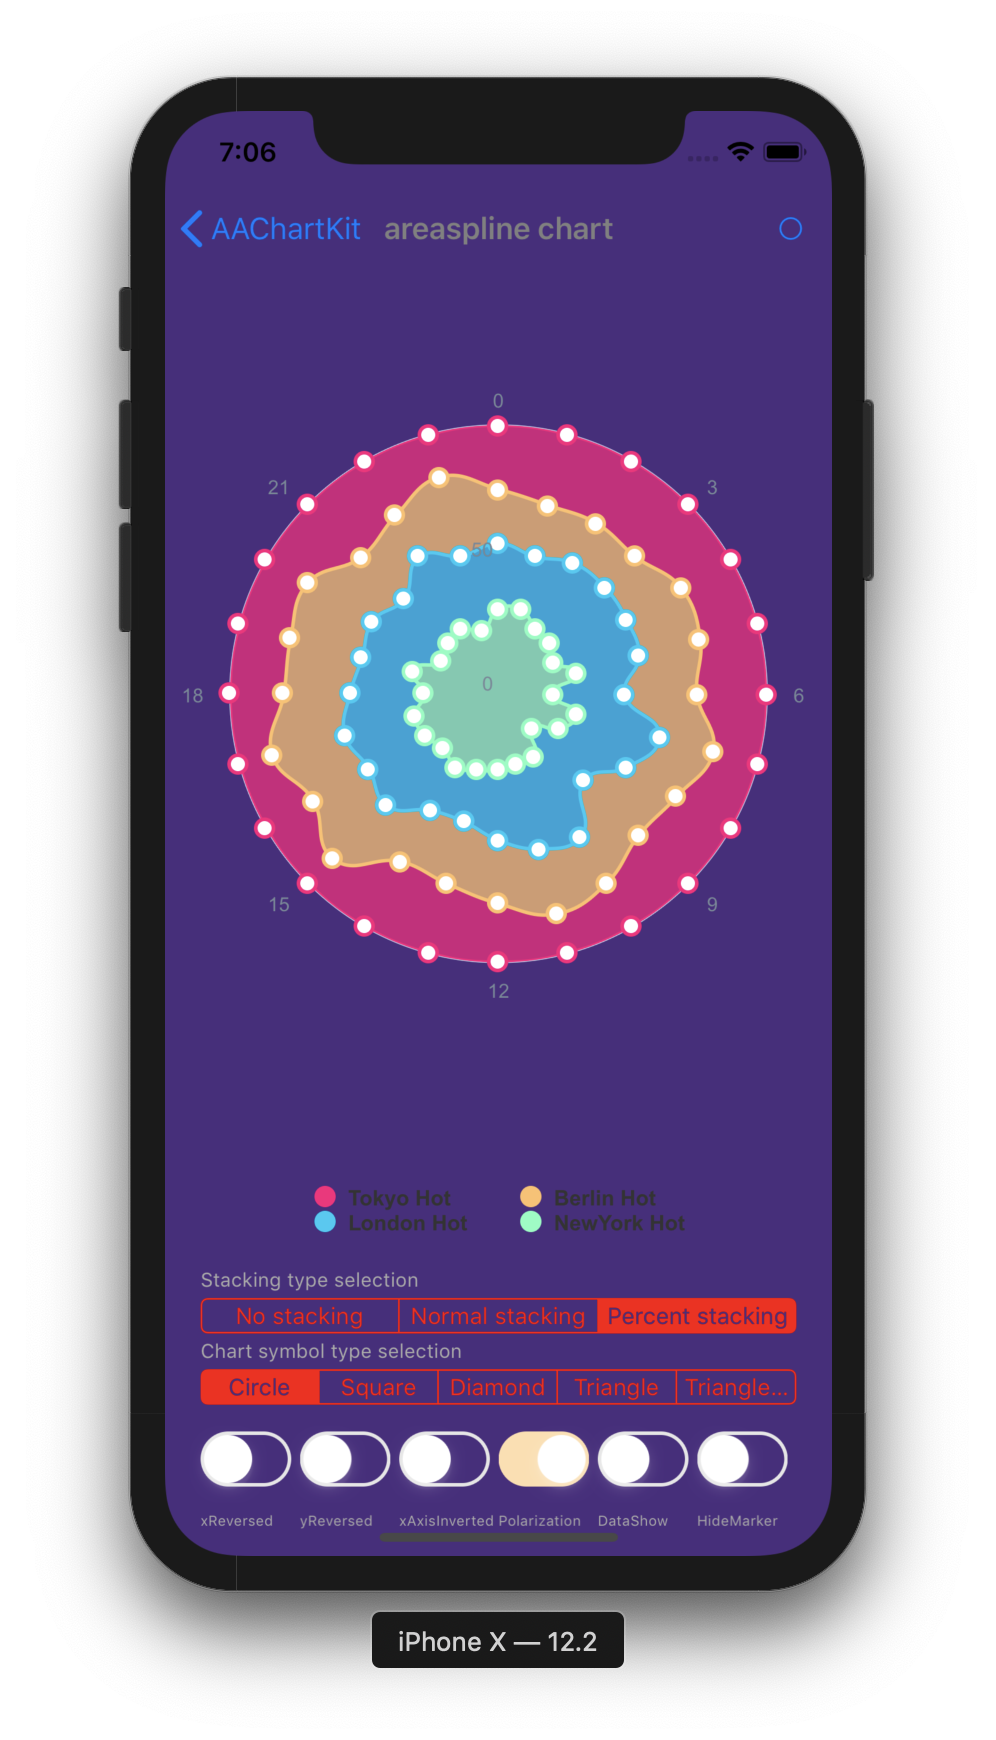
-
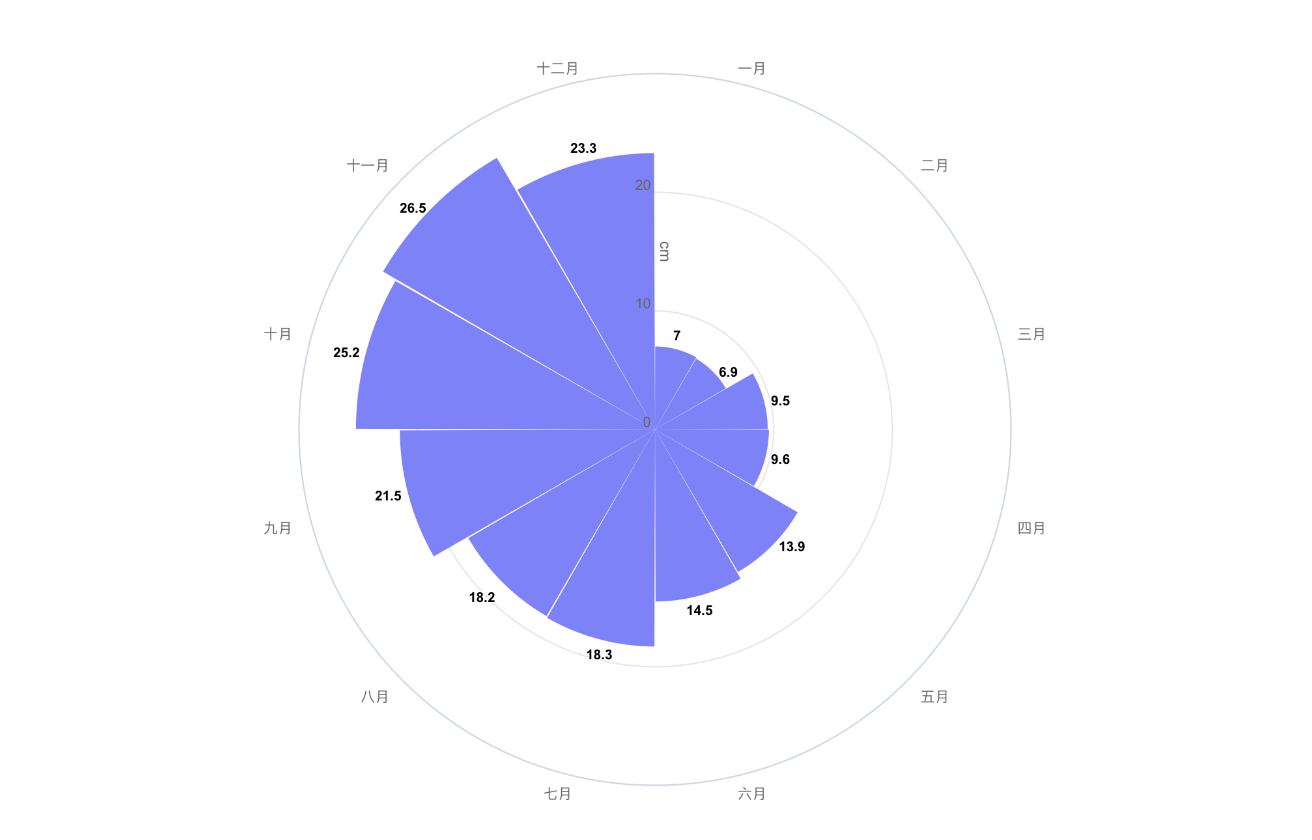
polar chart
-
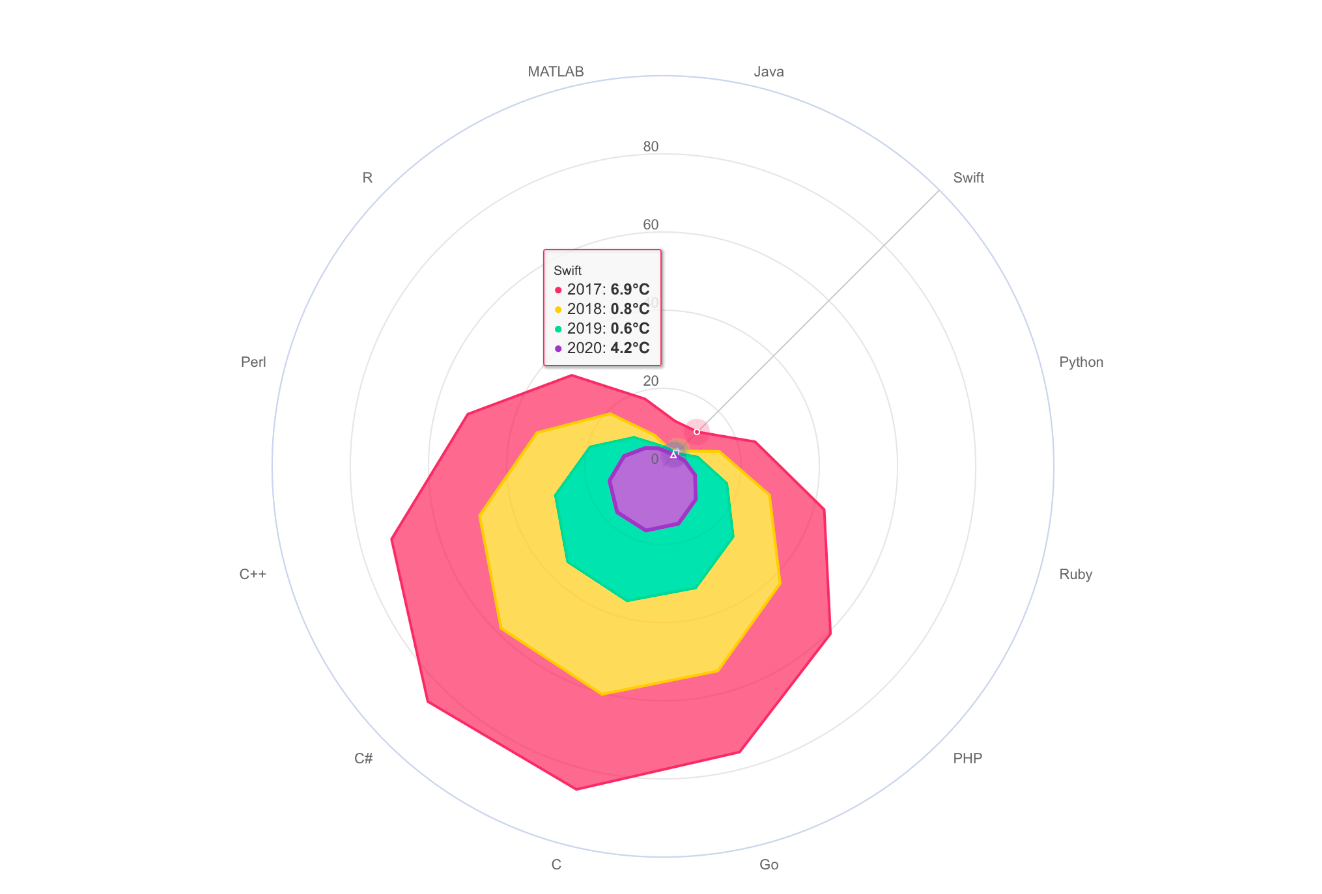
radar chart
-
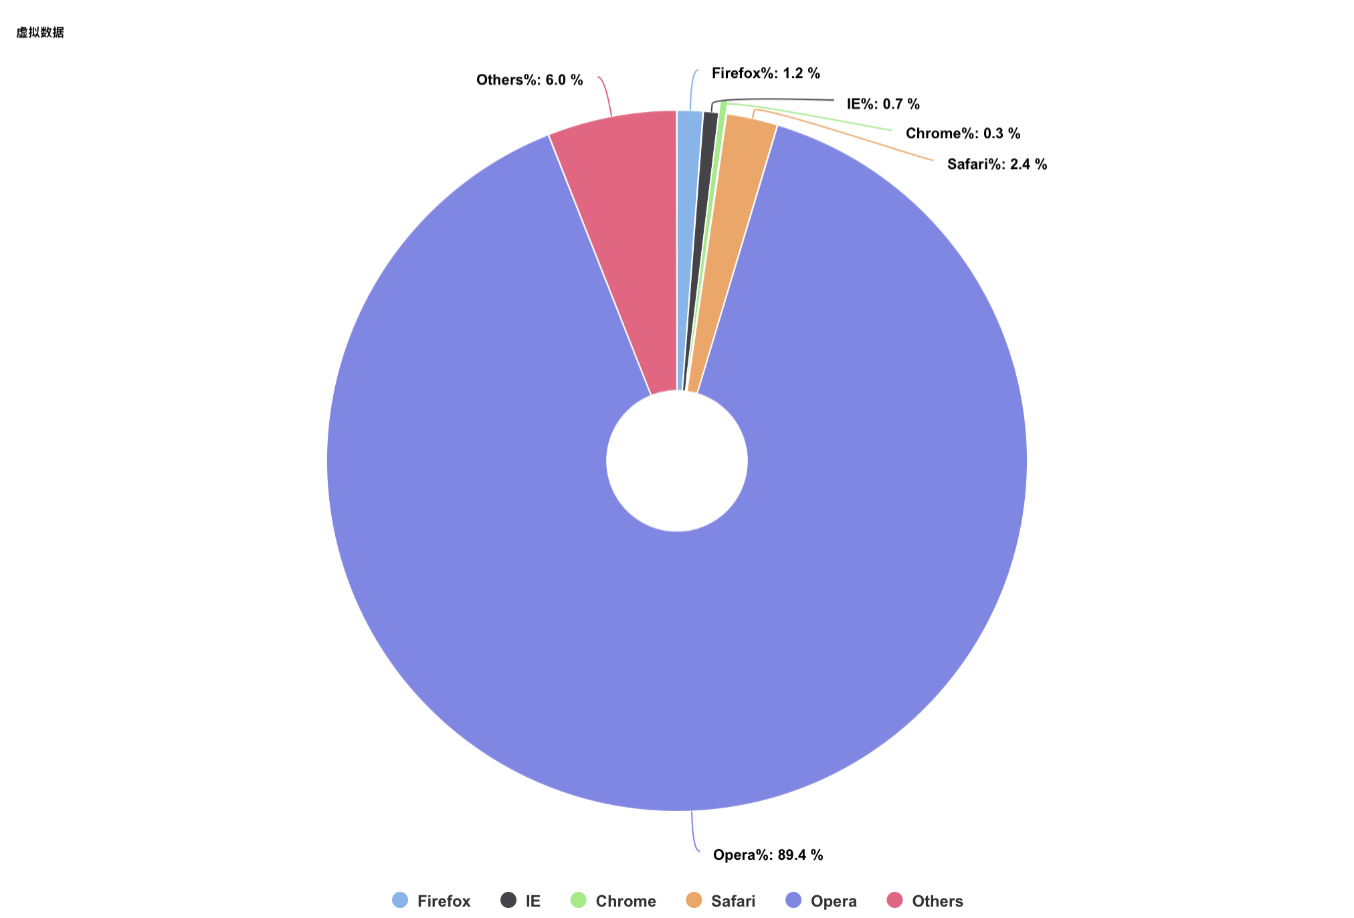
pie chart
-
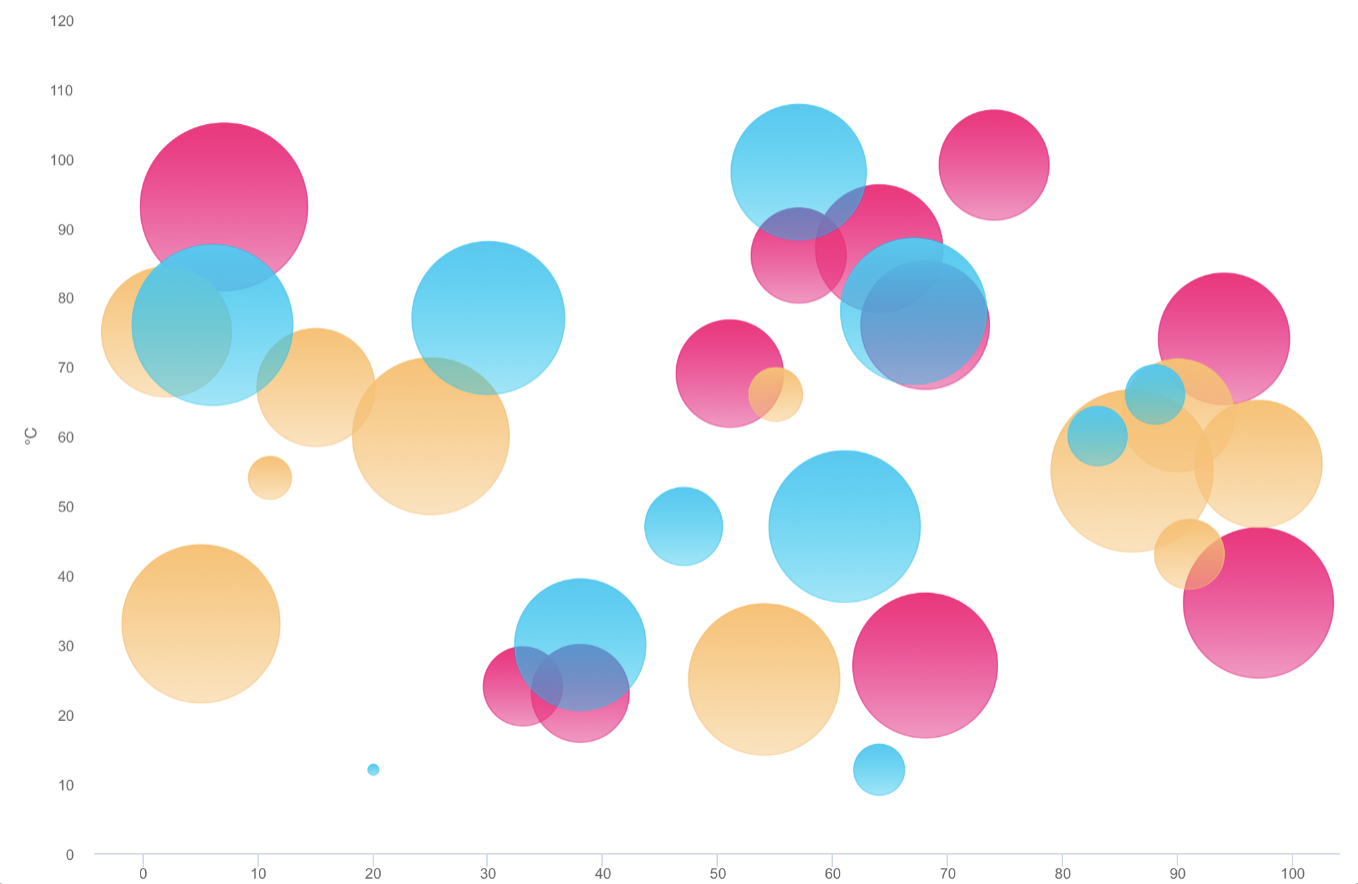
bubble chart
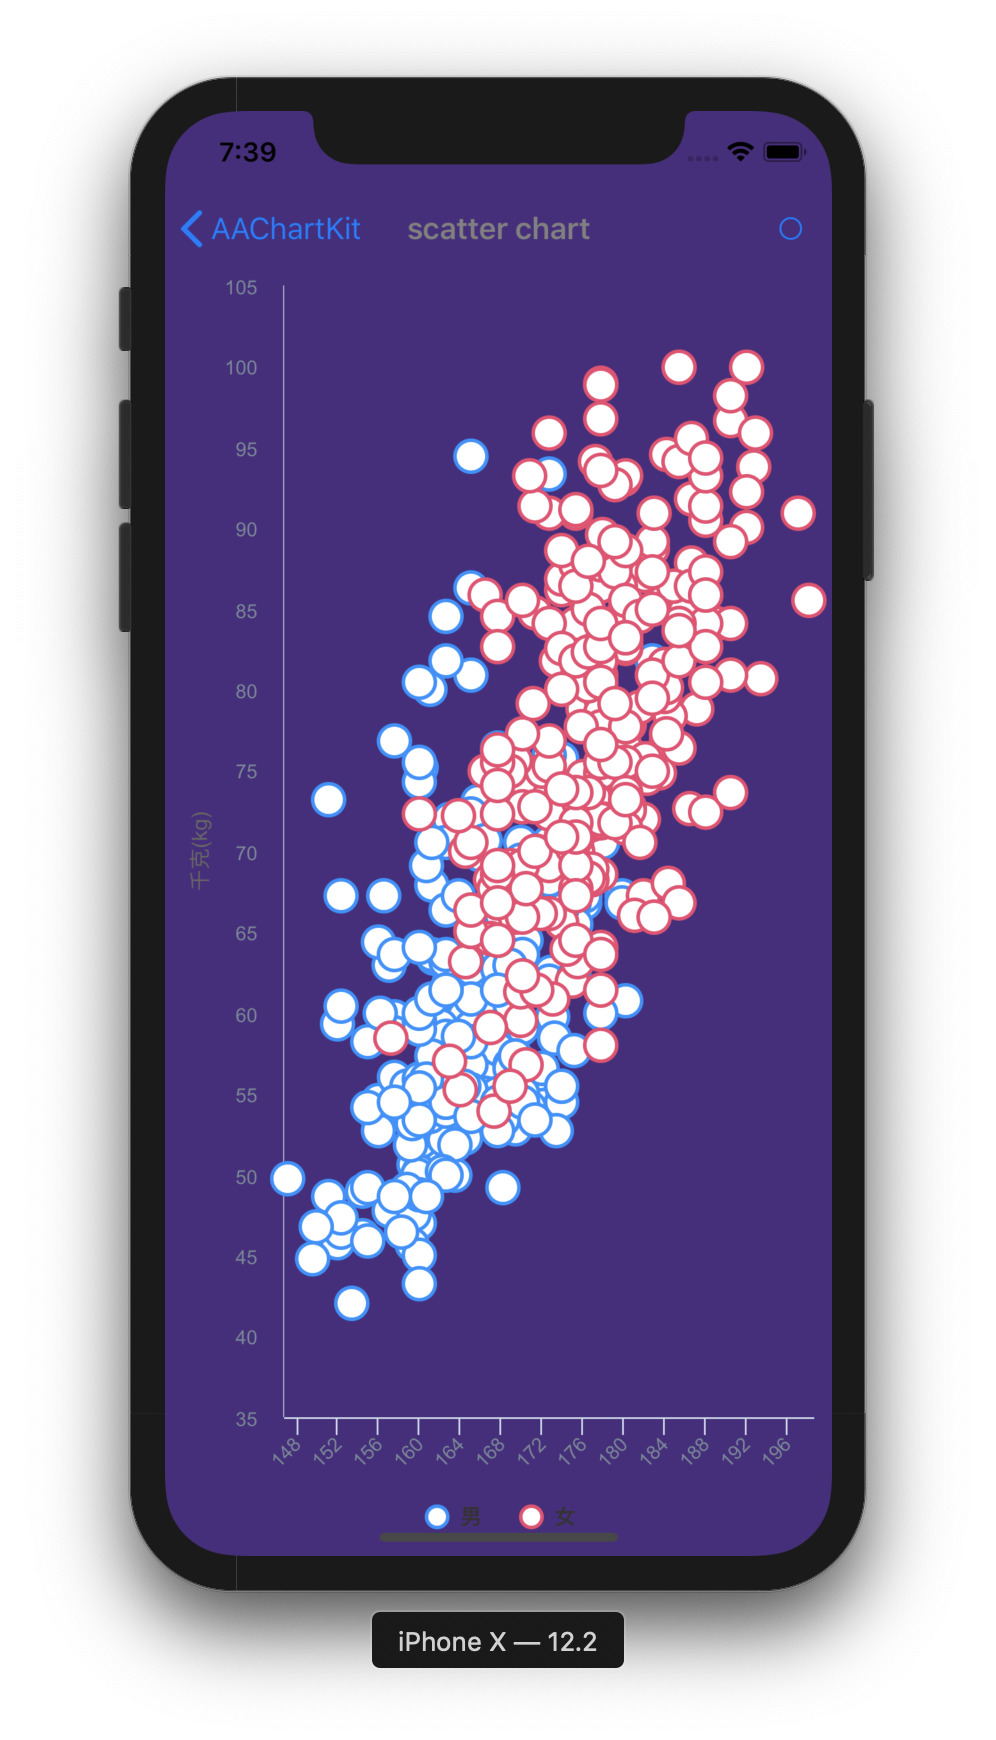
-
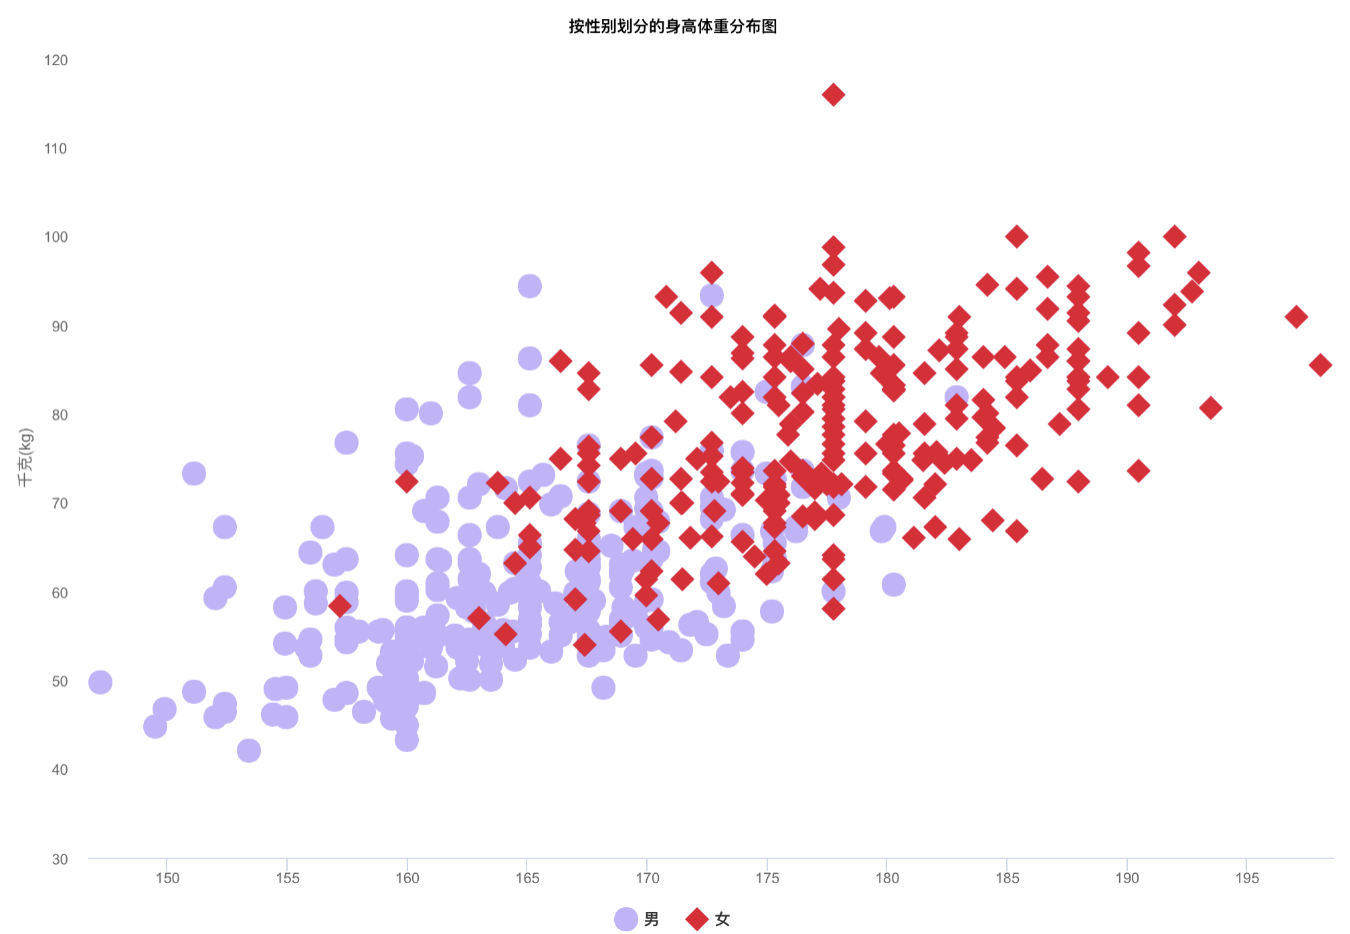
scatter chart
-
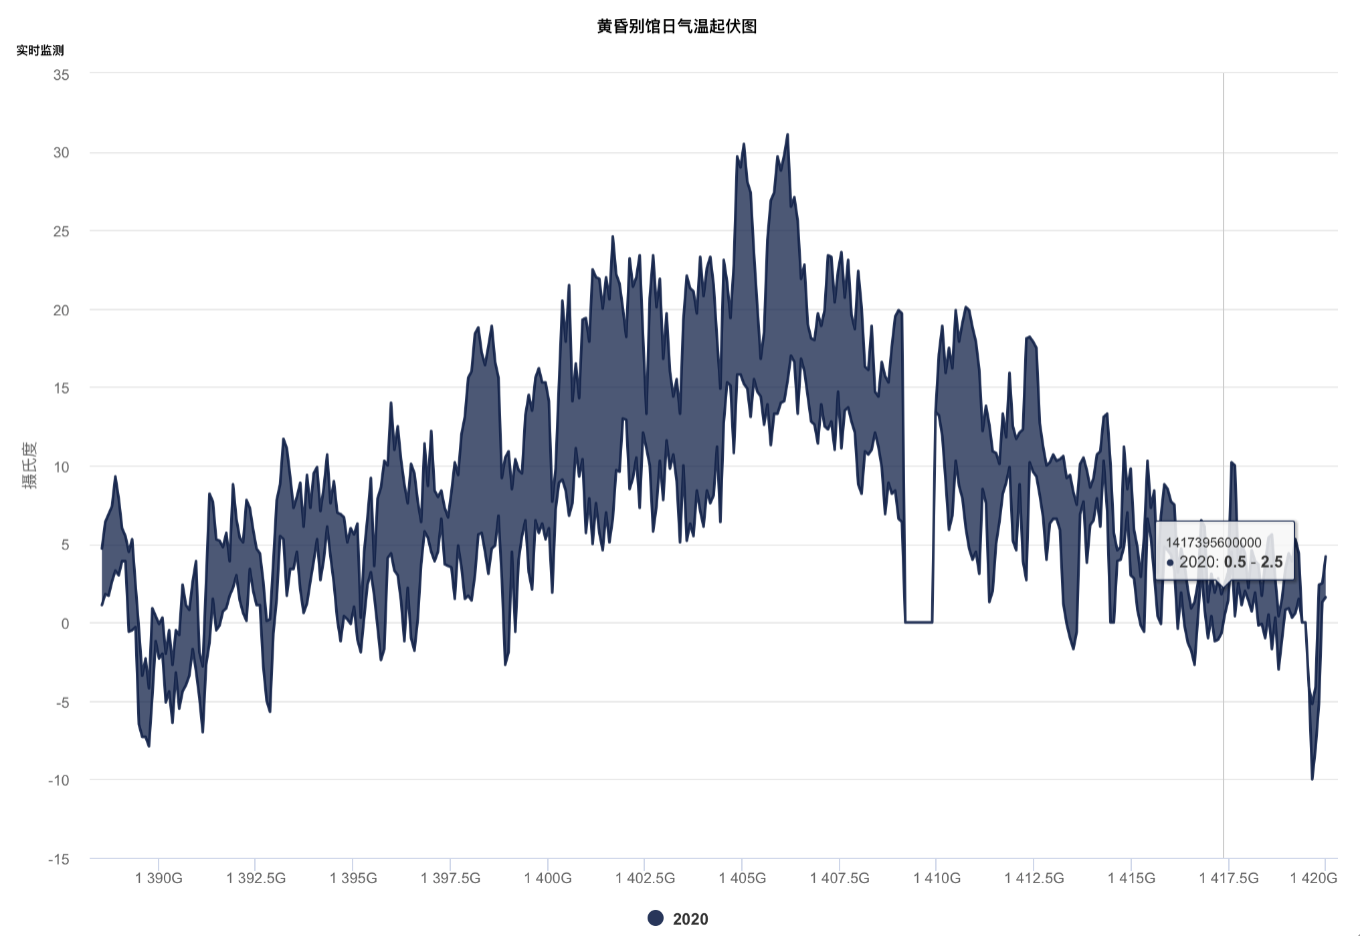
arearange chart
-
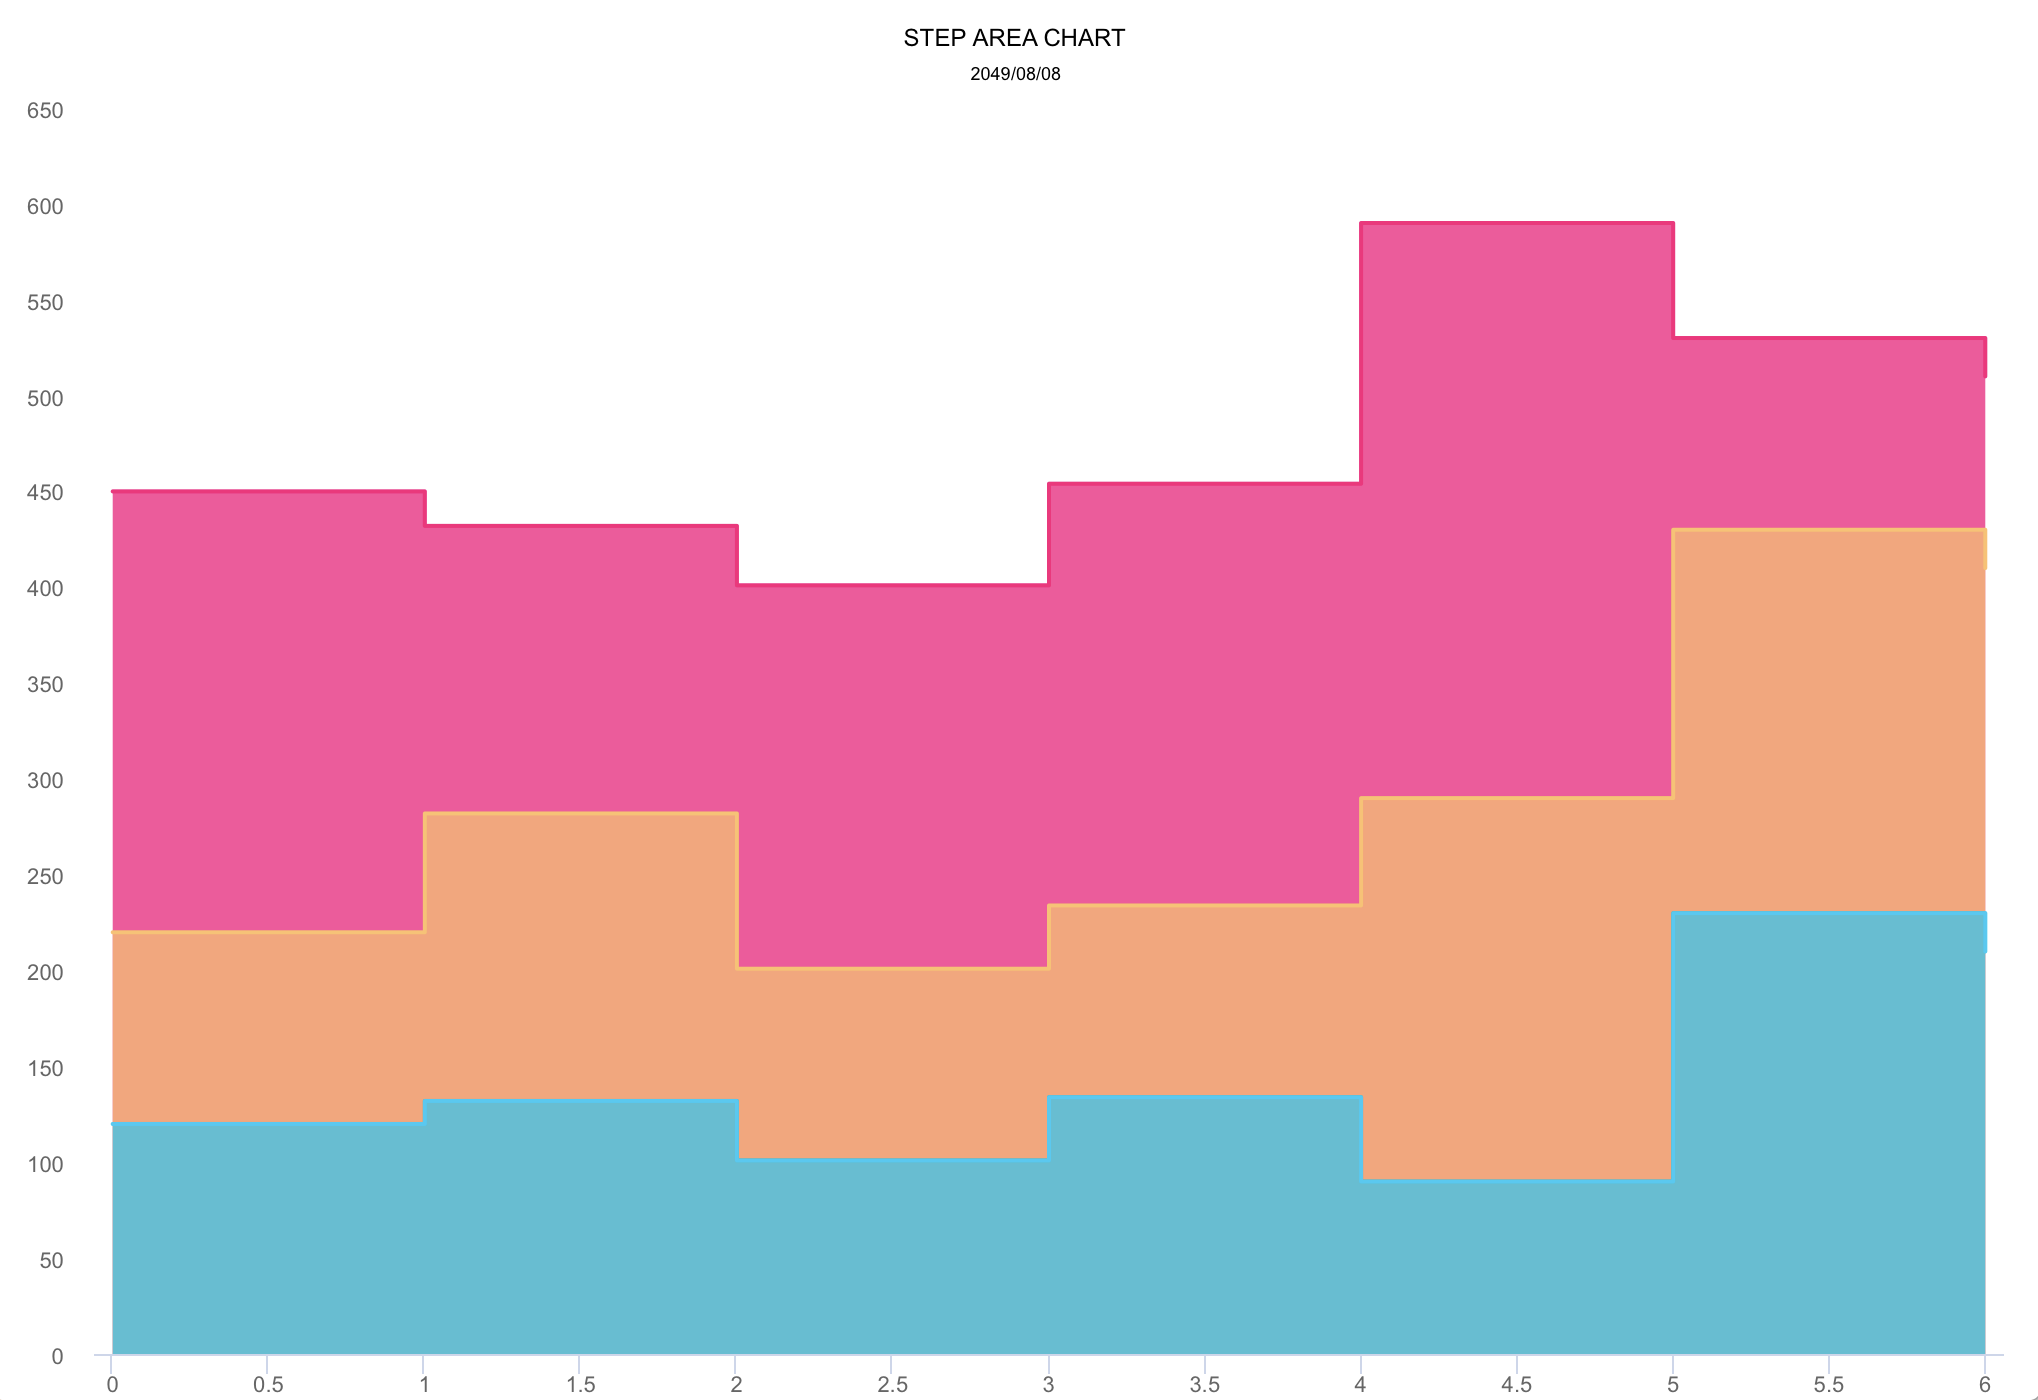
step area chart
-
mixed chart
More graphics
- Note: The following
DEMO pictureis aGIF dynamic picturewhich has a size of around 6M. If you don't see any dynamic preview, then this is because the picture resources were not fully loaded. In such a case please be patient and wait for the contents to finish loading. Maybe you need to reload this page.
Special instructions
Support user click events and move over events
you can monitor the user touch events message through implementing delegate function for AAChartView instance object
      public interface AAChartViewCallBack {
        void chartViewMoveOverEventMessage(AAChartView aaChartView, AAMoveOverEventMessageModel messageModel);
    }
The received touch events message contain following content
public class AAMoveOverEventMessageModel {
    public String name;
    public Double x;
    public Double y;
    public String category;
    public LinkedTreeMap offset;
    public Double index;
}
Support for custom the style of chart AATooltip through JavaScript function
As we all know, AAInfographics support using HTML String. Most of time, the headerFormat ãpointFormatãfooterFormat HTML string is enough for customizing chart tooltip string content, However, sometimes the needs of APP is so weird to satified, in this time, you can even customize the chart tooltip style through JavaScript function.
For example, configuring AATooltip instance object properties as follow:
AATooltip aaTooltip = new AATooltip()
.useHTML(true)
.formatter(" function () {\n" +
" return ' ð ð ð ð ð ð ð ð <br/> '\n" +
" + ' Support JavaScript Function Just Right Now !!! <br/> '\n" +
" + ' The Gold Price For <b>2020 '\n" +
" + this.x\n" +
" + ' </b> Is <b> '\n" +
" + this.y\n" +
" + ' </b> Dollars ';\n" +
" }")
.valueDecimals(2)
.backgroundColor("#000000")
.borderColor("#000000")
.style(new AAStyle()
.color("#FFD700")
.fontSize("12 px")
);
you can get the customized tooltip style chart like thisð

Support value range segmentation
-
chart with value range segmentation
bands ð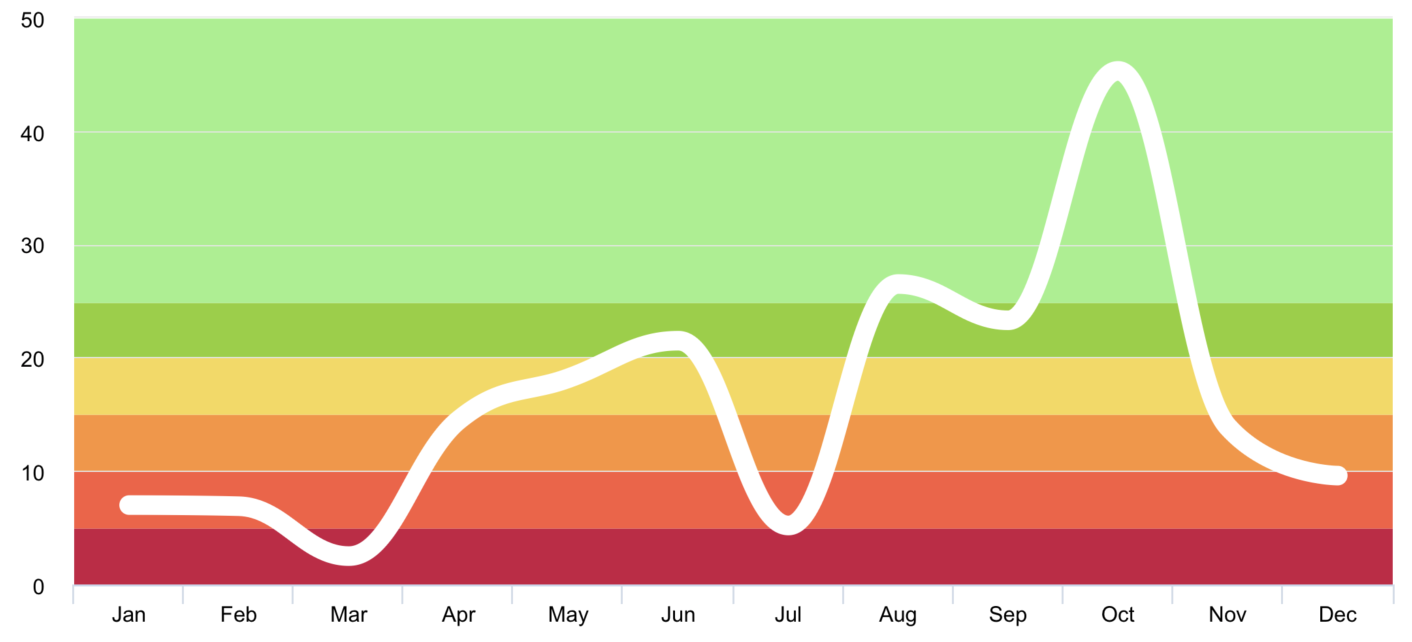
-
chart with value range segmentation
lines ð§¶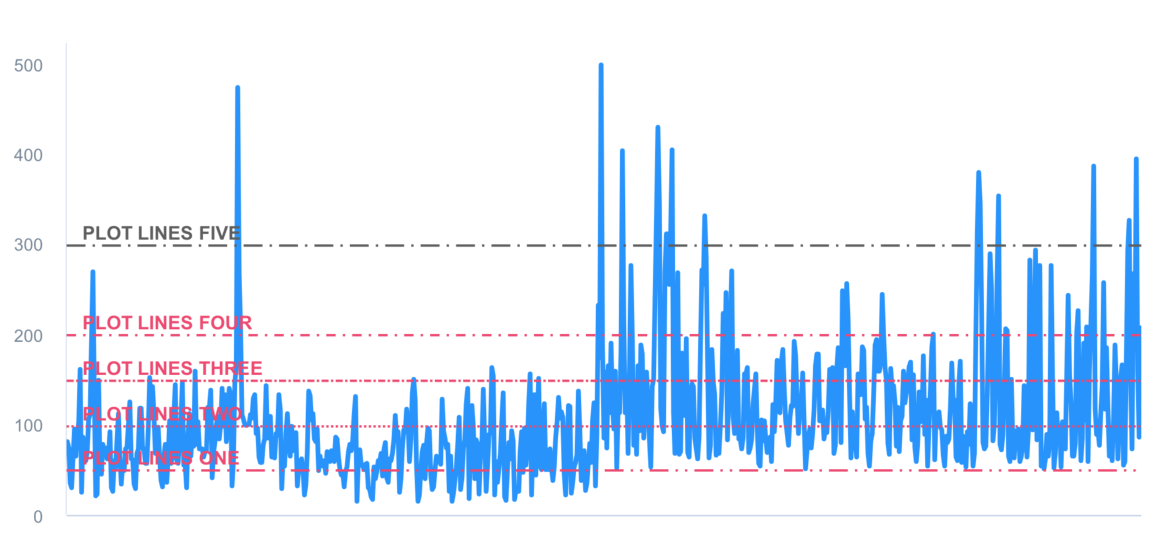
-
chart with value range segmentation
zones ð§±
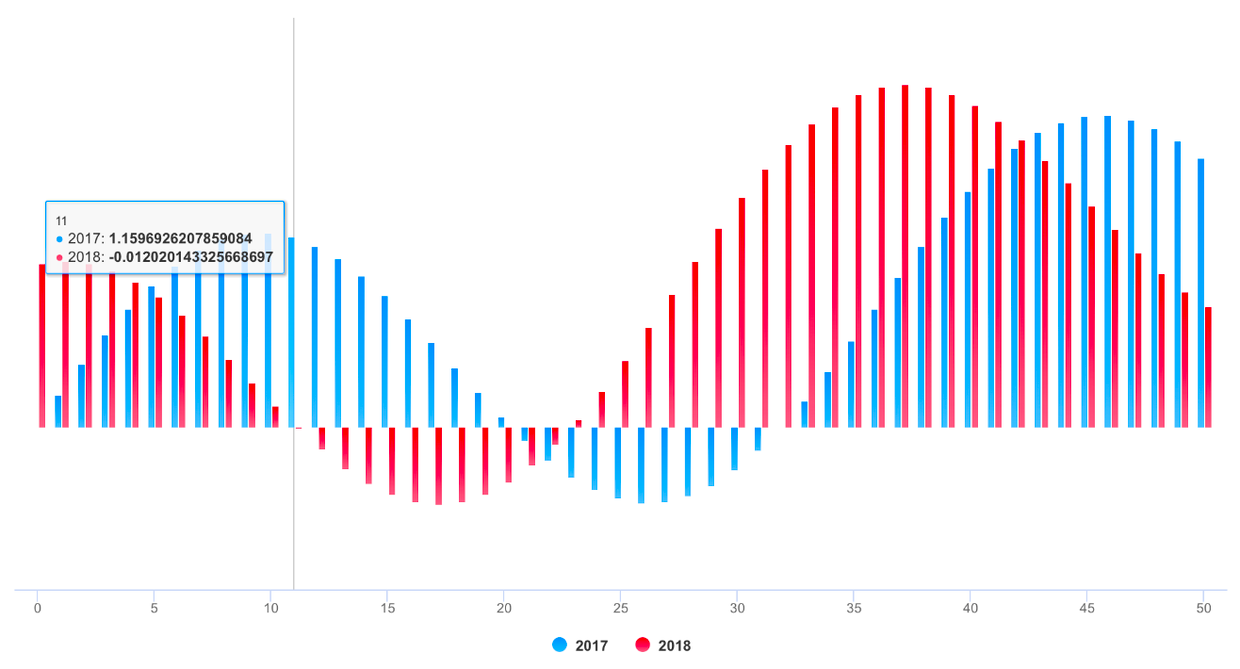
Support scrolling update chart data

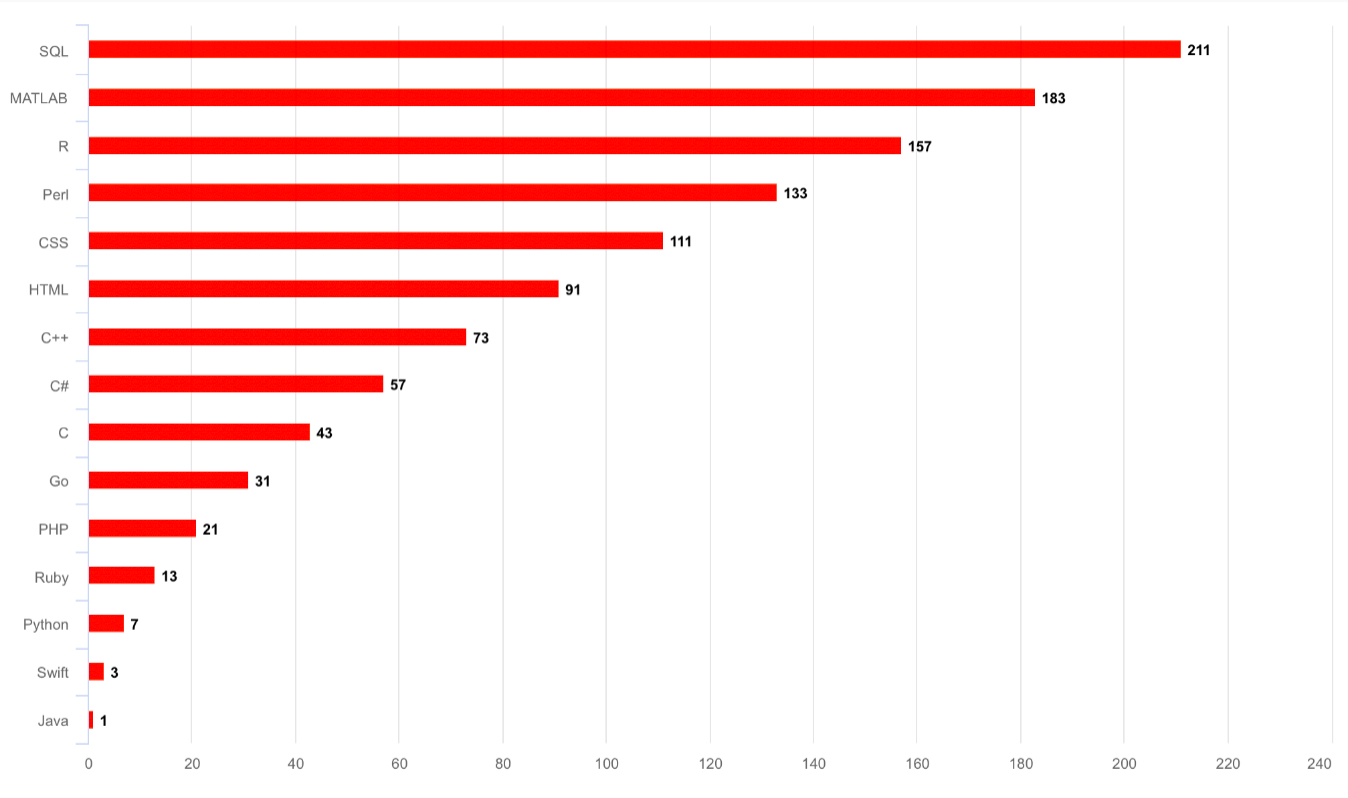
Support data sorting with animation effect
Supported chart type for now
public interface AAChartType {
String Column = "column";
String Bar = "bar";
String Area = "area";
String AreaSpline = "areaspline";
String Line = "line";
String Spline = "spline";
String Scatter = "scatter";
String Pie = "pie";
String Bubble = "bubble";
String Pyramid = "pyramid";
String Funnel = "funnel";
String Columnrange = "columnrange";
String Arearange = "arearange";
String Areasplinerange = "areasplinerange";
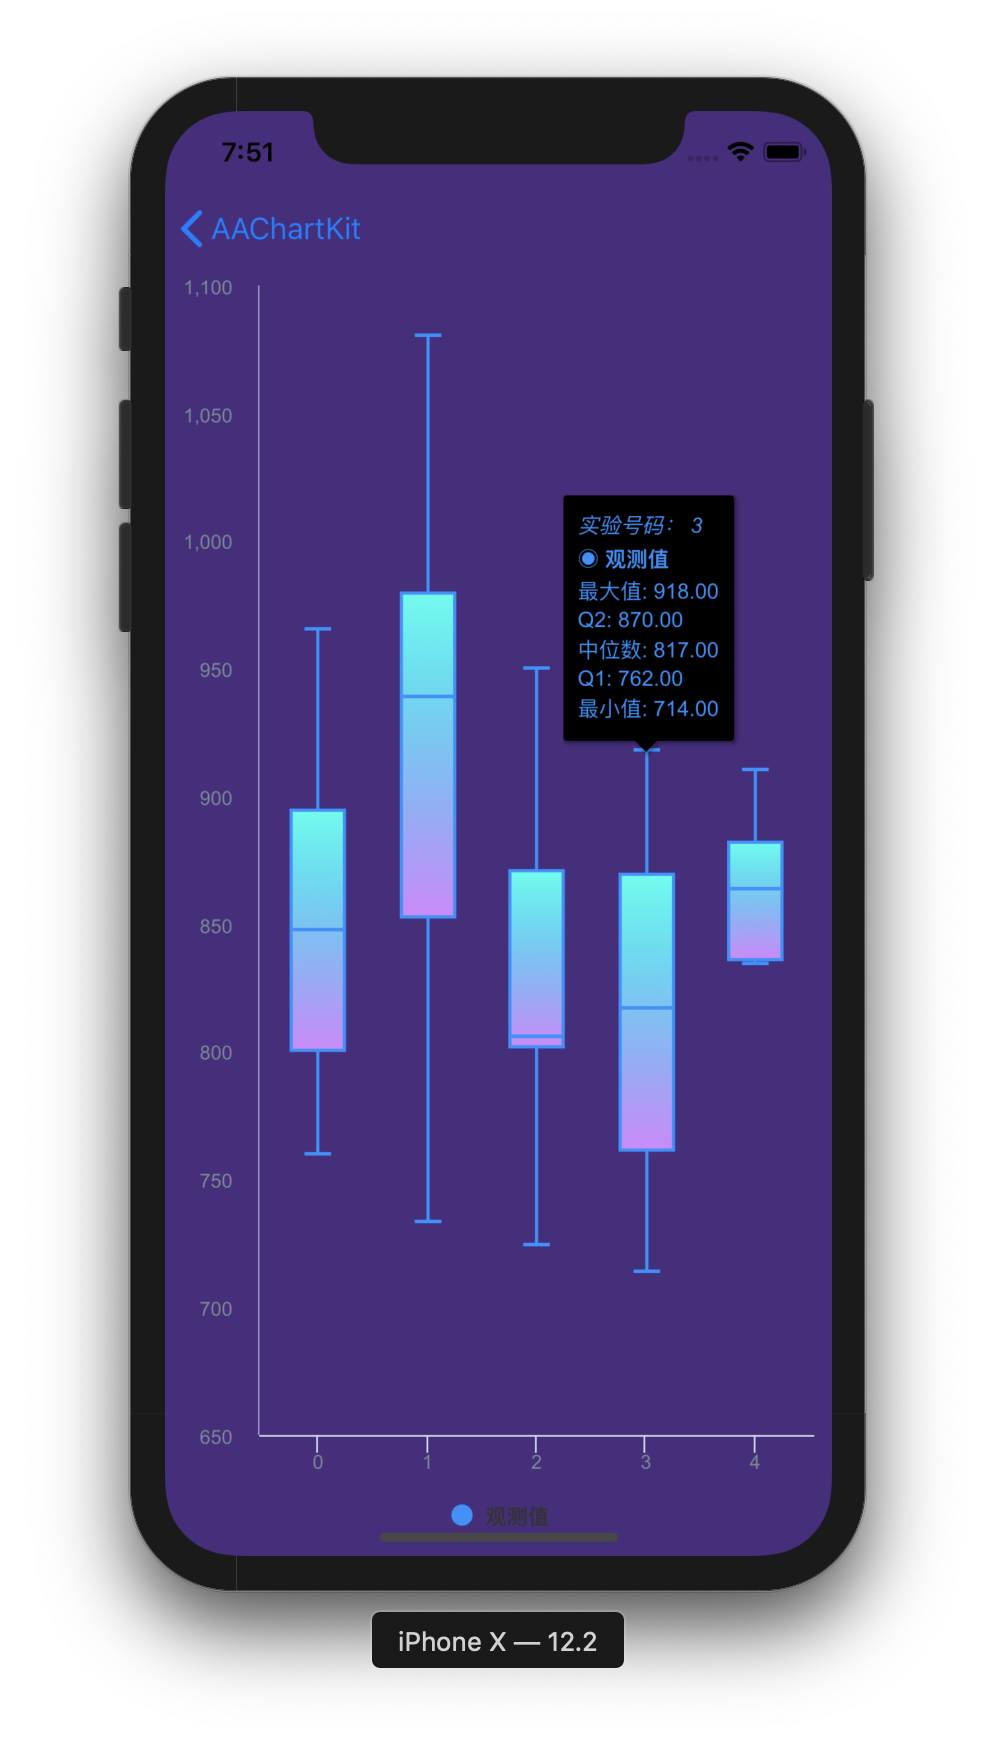
String Boxplot = "boxplot";
String Waterfall = "waterfall";
}
Supported zoom guesture types for now
    public interface AAChartZoomType {
        String None = "none";
        String X  = "x";
        String Y  = "y";
        String XY = "xy";
    }
Supported animation type for now
   public interface AAChartAnimationType {
        String EaseInQuad     = "easeInQuad";
        String EaseOutQuad    = "easeOutQuad";
        String EaseInOutQuad  = "easeInOutQuad";
        String EaseInCubic    = "easeInCubic";
        String EaseOutCubic   = "easeOutCubic";
        String EaseInOutCubic = "easeInOutCubic";
        String EaseInQuart    = "easeInQuart";
        String EaseOutQuart   = "easeOutQuart";
        String EaseInOutQuart = "easeInOutQuart";
        String EaseInQuint    = "easeInQuint";
        String EaseOutQuint   = "easeOutQuint";
        String EaseInOutQuint = "easeInOutQuint";
        String EaseInSine     = "easeInSine";
        String EaseOutSine    = "easeOutSine";
        String EaseInOutSine  = "easeInOutSine";
        String EaseInExpo     = "easeInExpo";
        String EaseOutExpo    = "easeOutExpo";
        String EaseInOutExpo  = "easeInOutExpo";
        String EaseInCirc     = "easeInCirc";
        String EaseOutCirc    = "easeOutCirc";
        String EaseInOutCirc  = "easeInOutCirc";
        String EaseOutBounce  = "easeOutBounce";
        String EaseInBack     = "easeInBack";
        String EaseOutBack    = "easeOutBack";
        String EaseInOutBack  = "easeInOutBack";
        String Elastic        = "elastic";
        String SwingFromTo    = "swingFromTo";
        String SwingFrom      = "swingFrom";
        String SwingTo        = "swingTo";
        String Bounce         = "bounce";
        String BouncePast     = "bouncePast";
        String EaseFromTo     = "easeFromTo";
        String EaseFrom       = "easeFrom";
        String EaseTo         = "easeTo";
    }
Here are the ten concrete animation types of AAInfographics
| Back | Bounce | Circ | Cubic | Elastic |
|---|---|---|---|---|
 |  |  |  |  |
| Expo | Quad | Quart | Quint | Sine |
|---|---|---|---|---|
 |  |  |  |  |
About AAChartModel
-
AAChartModel:chart basic properties instruction
| Property name | Description | Value Range |
|---|---|---|
| title | The chart title | Any valid string |
| subtitle | The chart subtitle | Any valid string |
| chartType | The default series type for the chart. Can be any of the chart types listed under AAChartType. | AAChartType.Column, AAChartType.Bar, AAChartType.Area, AAChartType.AreaSpline, AAChartType.Line, AAChartType.Spline, AAChartType.Pie, AAChartType.Bubble, AAChartType.Scatter, AAChartType.Pyramid, AAChartType.Funnel, AAChartType.Arearange, AAChartType.Columnrange |
| stacking | Whether to stack the values of each series on top of each other. Possible values are null to disable, "normal" to stack by value or "percent". When stacking is enabled, data must be sorted in ascending X order | AAChartStackingType.None, AAChartStackingType.Normal, AAChartStackingType.Percent |
| symbol | A predefined shape or symbol for the marker. When null, the symbol is pulled from options.symbols. Other possible values are "circle", "square", "diamond", "triangle" and "triangle-down" | AAChartSymbolType.Circle, AAChartSymbolType.Square, AAChartSymbolType.Diamond, AAChartSymbolType.Triangle, AAChartSymbolType.TriangleDown |
| colorsTheme | the colors theme of chart style | default value is new String[]{"#fe117c","#ffc069","#06caf4","#7dffc0"} |
| series | the series data of chart | a list made of AASeriesElement instance objects ,every AASeriesElement has its own type ãnameãdataãcolorãopacity value ect |
-
AAChartModel:chart all properties list
public String  animationType;
public Integer animationDuration;
public String  title;
public String  subtitle;
public String  chartType;
public String  stacking;
public String  symbol;
public String  symbolStyle;
public String  zoomType;
public Boolean pointHollow;
public Boolean inverted;
public Boolean xAxisReversed;
public Boolean yAxisReversed;
public Boolean tooltipEnabled;
public String  tooltipValueSuffix;
public Boolean tooltipCrosshairs;
public Boolean gradientColorEnable;
public Boolean polar;
public Float   marginLeft;
public Float   marginRight;
public Boolean dataLabelEnabled;
public Boolean xAxisLabelsEnabled;
public String[]categories;
public Integer xAxisGridLineWidth;
public Boolean xAxisVisible;
public Boolean yAxisVisible;
public Boolean yAxisLabelsEnabled;
public String  yAxisTitle;
public Float   yAxisLineWidth;

public Integer yAxisGridLineWidth;
public Object[]colorsTheme;
public Boolean legendEnabled;
public String  legendLayout;
public String  legendAlign;
public String  legendVerticalAlign;
public String  backgroundColor;
public Boolean options3dEnable;
public Integer options3dAlphaInt;
public Integer options3dBetaInt;
public Integer options3dDepth;
public Integer borderRadius;
public Integer markerRadius;
public AASeriesElement[] series;
public String  titleColor;
public String  subTitleColor;
public String  axisColor;
Created By

"CODE IS FAR AWAY FROM BUG WITH THE ANIMAL PROTECTING"
* ##2 ##2
* â-##1ã â-##1
* â_â â»---ââ_â»âââ
* âããã âãããã
* âãã âã âããã
* â @^ã @^ âãã
* âãããããã â
* âãã â»ããã â
* â_ããããã _â
* âââãããâââ
* ããâãããâç¥å
½ä¿ä½
* ããâãããâæ°¸æ BUGï¼
* ããâãããâââââ----|
* ããâããããããã â£â}}}
* ããâããããããã ââ
* ããââ&&&â-â&&&âââ-|
* ãããââ«â«ã ââ«â«
* ãããââ»âã ââ»â
*
*
"CODE IS FAR AWAY FROM BUG WITH THE ANIMAL PROTECTING"
Source Codeâ
| Language Version | Project Name | Target Platform | Source Code Link |
|---|---|---|---|
| Kotlin | AAInfographics | Android | https://github.com/AAChartModel/AAChartCore-Kotlin |
| Java | AAChartCore | Android | https://github.com/AAChartModel/AAChartCore |
| Swift | AAInfographics | iOS | https://github.com/AAChartModel/AAChartKit-Swift |
| Objective C | AAChartKit | iOS | https://github.com/AAChartModel/AAChartKit |
LICENSE
![]()
AAInfographics is available under the MIT license. See the LICENSE file for more information.
Contact
- ð ð ð ð WARM TIPS!!! ð ð ð ð
- Please contact me on GitHub,if there are any problems encountered in use.
- GitHub Issues : https://github.com/AAChartModel/AAChartCore/issues
- And if you want to contribute for this project, please contact me as well
- GitHub : https://github.com/AAChartModel
- StackOverflow : https://stackoverflow.com/users/7842508/codeforu
- JianShu : http://www.jianshu.com/u/f1e6753d4254
- SegmentFault : https://segmentfault.com/u/huanghunbieguan
Todo list
- Support for the user to add delegate events after the graphics content loading was completed
- Support graphics to refresh global content dynamically
- Support graphics to refresh pure data (
series) content dynamically - Support color layer gradient effects
- Support horizontal screen (full screen) effect
- Support setting graphics rendering animation freely
- Support for users to configure
AAOptionsmodel object properties freely - Support stacking the graphics
- Support reversing the graphics axis
- Support rendering the scatter chart
- Support rendering the column range map
- Support rendering the area range graph
- Support rendering the polar chart
- Support rendering the step line chart
- Support rendering the step area chart
- Support rendering the rectangular tree hierarchy diagrams
- Support rendering the circular progress bar chart
- Support adding clicked event callbacks for graphics
- Support graphics to refresh pure data in real time and scroll dynamically
- Support rendered graphics to generate image files
- Support generating image files saved to the system album
Top Related Projects
Highcharts JS, the JavaScript charting framework
Simple HTML5 Charts using the <canvas> tag
Bring data to life with SVG, Canvas and HTML. :bar_chart::chart_with_upwards_trend::tada:
JavaScript 3D Library.
Open-source JavaScript charting library behind Plotly and Dash
Apache ECharts is a powerful, interactive charting and data visualization library for browser
Convert designs to code with AI
Introducing Visual Copilot: A new AI model to turn Figma designs to high quality code using your components.
Try Visual Copilot