
Top Related Projects

A terminal based graphical activity monitor inspired by gtop and vtop

A monitor of resources

Glances an Eye on your system. A top/htop alternative for GNU/Linux, BSD, Mac OS and Windows operating systems.

Yet another cross-platform graphical process/system monitor.

Terminal-based CPU stress and monitoring utility
Quick Overview
gtop is a system monitoring dashboard for terminal, written in JavaScript. It provides a visually appealing and interactive way to monitor system resources such as CPU, memory, disk, network, and processes directly from the command line.
Pros
- Attractive and intuitive graphical interface in the terminal
- Real-time updates of system metrics
- Customizable layout and color schemes
- Cross-platform support (Linux, macOS, Windows)
Cons
- Requires Node.js to be installed
- May consume more system resources compared to simpler monitoring tools
- Limited configuration options compared to more advanced monitoring solutions
Getting Started
To install and run gtop, follow these steps:
# Install gtop globally using npm
npm install gtop -g

# Run gtop
gtop
Once installed, you can customize gtop by creating a configuration file:
# Create a config file
mkdir -p ~/.config/gtop
touch ~/.config/gtop/gtop.json

# Edit the config file with your preferred settings
nano ~/.config/gtop/gtop.json
Example configuration:
{
  "theme": "monokai",
  "updateInterval": 1000,
  "disableColors": false
}
After configuring, simply run gtop in your terminal to start monitoring your system resources.
Competitor Comparisons
A terminal based graphical activity monitor inspired by gtop and vtop
Pros of gotop
- Written in Go, potentially offering better performance and cross-platform compatibility
- More customizable with various color schemes and layouts
- Supports mouse input for interactive usage
Cons of gotop
- Larger binary size due to being compiled from Go
- May have a steeper learning curve for users unfamiliar with Go
Code Comparison
gtop (JavaScript):
const si = require('systeminformation');
const blessed = require('blessed');
const contrib = require('blessed-contrib');

// ... (code to create and update dashboard)
gotop (Go):
package main

import (
    "github.com/xxxserxxx/gotop/v4/devices"
    "github.com/xxxserxxx/gotop/v4/widgets"
)

// ... (code to initialize and run gotop)
Key Differences
- Language: gtop is written in JavaScript and runs on Node.js, while gotop is written in Go
- Dependencies: gtop relies on external libraries like blessed and systeminformation, whereas gotop uses its own custom widgets and device information gathering
- Customization: gotop offers more built-in customization options, while gtop may require modifying the source code for extensive customization
Use Cases
- gtop: Ideal for users familiar with JavaScript and Node.js, or those who prefer a lighter-weight solution
- gotop: Better suited for users who need a standalone binary with more built-in features and customization options
A monitor of resources
Pros of btop
- More comprehensive system monitoring, including detailed CPU, memory, network, and processes information
- Customizable interface with themes and layout options
- Cross-platform support (Linux, macOS, FreeBSD, OpenBSD)
Cons of btop
- Higher resource usage due to more extensive features
- Steeper learning curve with more complex configuration options
Code comparison
gtop:
const si = require('systeminformation');
const blessed = require('blessed');
const contrib = require('blessed-contrib');

// Main rendering logic
btop:
#include <vector>
#include <string>
#include <memory>
#include "btop_config.hpp"
#include "btop_theme.hpp"

// Main rendering logic
Key differences
- gtop is written in JavaScript and uses Node.js, while btop is written in C++
- btop offers more granular control over displayed information and appearance
- gtop has a simpler interface and is easier to set up for basic monitoring needs
- btop provides more detailed system statistics and process information
Use cases
- gtop: Quick and simple system monitoring for Node.js developers
- btop: Advanced system monitoring for power users and system administrators who need detailed information and customization options
Glances an Eye on your system. A top/htop alternative for GNU/Linux, BSD, Mac OS and Windows operating systems.
Pros of Glances
- More comprehensive system monitoring, including network, disk I/O, and sensors
- Cross-platform support (Linux, macOS, Windows)
- Extensible plugin system for custom metrics
Cons of Glances
- Heavier resource usage due to more features
- Steeper learning curve with more complex interface
Code Comparison
Glances (Python):
from glances_api import GlancesApi

glances = GlancesApi(host='localhost', port=61208)
cpu_percent = glances.getCpu()['total']
print(f"CPU Usage: {cpu_percent}%")
gtop (JavaScript):
const si = require('systeminformation');

si.currentLoad().then(data => {
  console.log(`CPU Usage: ${data.currentLoad.toFixed(2)}%`);
});
Summary
Glances offers a more feature-rich system monitoring solution with cross-platform support and extensibility. However, it comes at the cost of higher resource usage and complexity. gtop, on the other hand, provides a simpler, lightweight alternative focused on real-time terminal-based monitoring, primarily for Unix-like systems. The choice between the two depends on the specific monitoring needs and system constraints of the user.
Yet another cross-platform graphical process/system monitor.
Pros of bottom
- Written in Rust, offering better performance and memory safety
- More customizable with themes and layout options
- Supports more advanced features like process management and disk I/O monitoring
Cons of bottom
- Larger binary size due to Rust compilation
- Steeper learning curve with more complex configuration options
- May have higher CPU usage on some systems
Code Comparison
gtop (JavaScript):
const si = require('systeminformation');
const blessed = require('blessed');
const contrib = require('blessed-contrib');

// Main rendering loop
function render() {
  // Update components
}
bottom (Rust):
use crossterm::event::{self, Event, KeyCode};
use tui::Terminal;
use tui::backend::CrosstermBackend;

fn main() -> Result<(), Box<dyn std::error::Error>> {
    // Initialize terminal and run main loop
}
Both projects aim to provide system monitoring functionality in the terminal, but they differ in implementation languages and features. gtop is simpler and lighter, while bottom offers more advanced capabilities at the cost of increased complexity.
Terminal-based CPU stress and monitoring utility
Pros of s-tui
- More detailed CPU information, including per-core frequency and usage
- Stress testing capabilities built-in
- Customizable graph colors and layout
Cons of s-tui
- Limited to terminal-based interface, less visually appealing
- Focuses primarily on CPU and temperature, less comprehensive system overview
- Steeper learning curve for configuration and advanced features
Code Comparison
s-tui (Python):
def get_cpu_freq(self):
    """Get CPU frequency per core."""
    with open('/proc/cpuinfo', 'r') as f:
        lines = f.readlines()
    return [float(line.split(':')[1]) for line in lines if line.startswith('cpu MHz')]
gtop (JavaScript):
getCPUInfo() {
  const cpus = os.cpus();
  return cpus.map(cpu => ({
    model: cpu.model,
    speed: cpu.speed,
    times: cpu.times
  }));
}
Both projects aim to provide system monitoring tools, but they differ in their approach and focus. s-tui offers more detailed CPU information and stress testing capabilities, making it suitable for power users and system administrators. gtop, on the other hand, provides a more visually appealing and user-friendly interface with a broader overview of system resources. The code comparison shows that s-tui uses low-level file reading for CPU information, while gtop leverages Node.js's built-in os module for a more abstracted approach.
Convert  designs to code with AI

Introducing Visual Copilot: A new AI model to turn Figma designs to high quality code using your components.
Try Visual CopilotREADME
gtop
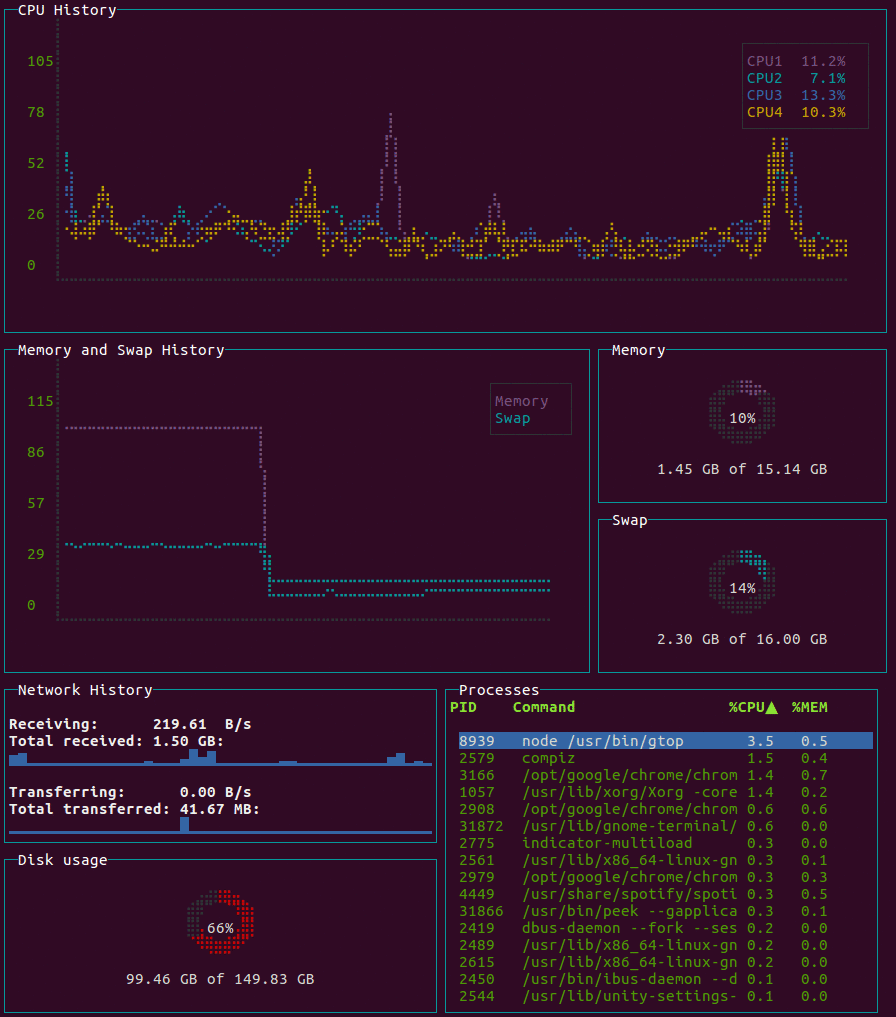
System monitoring dashboard for terminal.


![]()


Requirements
- Linux / OSX / Windows (partial support)
- Node.js >= v8
Installation
$ npm install gtop -g
Docker
You need to assign host net and pid to access the metrics in the host machine.
$ docker run --rm -it \
    --name gtop \
    --net="host" \
    --pid="host" \
    aksakalli/gtop
Usage
Start gtop with the gtop command
$ gtop
To stop gtop use q, or ctrl+c in most shell environments.
You can sort the process table by pressing
p: Process Idc: CPU usagem: Memory usage
Troubleshooting
If you see question marks or other different characters, try to run it with these environment variables:
$ LANG=en_US.utf8 TERM=xterm-256color gtop
License
Released under the MIT license.
Top Related Projects
A terminal based graphical activity monitor inspired by gtop and vtop
A monitor of resources
Glances an Eye on your system. A top/htop alternative for GNU/Linux, BSD, Mac OS and Windows operating systems.
Yet another cross-platform graphical process/system monitor.
Terminal-based CPU stress and monitoring utility
Convert designs to code with AI
Introducing Visual Copilot: A new AI model to turn Figma designs to high quality code using your components.
Try Visual Copilot