 django-debug-toolbar
A configurable set of panels that display various debug information about the current request/response.
Top Related Projects
A configurable set of panels that display various debug information about the current request/response.

This is a repository for collecting global custom management extensions for the Django Framework.
Quick Overview
Django Debug Toolbar is a configurable set of panels that display various debug information about the current request/response in Django applications. It provides insights into database queries, templates, HTTP headers, and more, making it an essential tool for Django developers during the development process.
Pros
- Comprehensive debug information in a user-friendly interface
- Easy to install and configure
- Highly customizable with the ability to add custom panels
- Minimal impact on application performance when not in debug mode
Cons
- Can slightly slow down page load times when active
- May expose sensitive information if accidentally left enabled in production
- Requires additional configuration for some features (e.g., AJAX requests)
- Learning curve for interpreting all the available information
Code Examples
- Basic installation and configuration:
INSTALLED_APPS = [
    # ...
    'debug_toolbar',
]

MIDDLEWARE = [
    # ...
    'debug_toolbar.middleware.DebugToolbarMiddleware',
]

INTERNAL_IPS = [
    '127.0.0.1',
]
- Adding a custom panel:
from debug_toolbar.panels import Panel

class CustomPanel(Panel):
    name = 'Custom'
    template = 'custom_panel.html'

    def nav_title(self):
        return 'Custom Panel'

    def title(self):
        return 'Custom Debug Info'

    def get_stats(self):
        return {'custom_stat': 'Some debug info'}
- Configuring panel options:
DEBUG_TOOLBAR_PANELS = [
    'debug_toolbar.panels.versions.VersionsPanel',
    'debug_toolbar.panels.timer.TimerPanel',
    'debug_toolbar.panels.settings.SettingsPanel',
    'debug_toolbar.panels.headers.HeadersPanel',
    'debug_toolbar.panels.request.RequestPanel',
    'debug_toolbar.panels.sql.SQLPanel',
    'debug_toolbar.panels.staticfiles.StaticFilesPanel',
    'debug_toolbar.panels.templates.TemplatesPanel',
    'debug_toolbar.panels.cache.CachePanel',
    'debug_toolbar.panels.signals.SignalsPanel',
    'debug_toolbar.panels.logging.LoggingPanel',
    'debug_toolbar.panels.redirects.RedirectsPanel',
    'debug_toolbar.panels.profiling.ProfilingPanel',
]
Getting Started
-
Install Django Debug Toolbar:
pip install django-debug-toolbar -
Add 'debug_toolbar' to INSTALLED_APPS in settings.py.
-
Add DebugToolbarMiddleware to MIDDLEWARE in settings.py.
-
Configure INTERNAL_IPS in settings.py to include '127.0.0.1'.
-
Add Debug Toolbar URLs to your project's urls.py:
if settings.DEBUG: import debug_toolbar urlpatterns = [ path('__debug__/', include(debug_toolbar.urls)), ] + urlpatterns -
Run your Django development server and access your site. The Debug Toolbar should appear on the right side of the page.
Competitor Comparisons
A configurable set of panels that display various debug information about the current request/response.
Pros of django-debug-toolbar
- More actively maintained with frequent updates
- Larger community support and contributions
- Extensive documentation and examples
Cons of django-debug-toolbar
- Potentially higher resource usage due to more features
- Steeper learning curve for new users
- May require additional configuration for complex setups
Code Comparison
django-debug-toolbar:
INSTALLED_APPS = [
    # ...
    'debug_toolbar',
]

MIDDLEWARE = [
    # ...
    'debug_toolbar.middleware.DebugToolbarMiddleware',
]
django-commons/django-debug-toolbar:
INSTALLED_APPS = [
    # ...
    'django_commons.debug_toolbar',
]

MIDDLEWARE = [
    # ...
    'django_commons.debug_toolbar.middleware.DebugToolbarMiddleware',
]
Both repositories provide similar functionality for Django debugging, but django-debug-toolbar is more widely used and maintained. The code comparison shows minor differences in import paths and configuration. django-debug-toolbar offers more features and regular updates, while django-commons/django-debug-toolbar may be simpler for basic debugging needs. Choose based on your project requirements and desired level of community support.
This is a repository for collecting global custom management extensions for the Django Framework.
Pros of django-extensions
- Broader scope with a wide range of management commands and utilities
- Includes development server with SSL support
- Provides additional template tags and admin extensions
Cons of django-extensions
- May include unnecessary features for some projects
- Requires more configuration and setup compared to django-debug-toolbar
- Less focused on debugging and performance analysis
Code Comparison
django-extensions:
from django_extensions.db.models import TimeStampedModel

class MyModel(TimeStampedModel):
    name = models.CharField(max_length=100)
django-debug-toolbar:
MIDDLEWARE = [
    # ...
    'debug_toolbar.middleware.DebugToolbarMiddleware',
    # ...
]

INSTALLED_APPS = [
    # ...
    'debug_toolbar',
]
django-extensions offers a broader set of tools and utilities for Django development, including management commands, model extensions, and admin improvements. It's more versatile but may include features not needed in every project. django-debug-toolbar focuses specifically on debugging and performance analysis, providing a visual toolbar in the browser.
django-extensions requires more setup and configuration, while django-debug-toolbar is easier to integrate for its specific purpose. The code comparison shows how django-extensions can extend model functionality, while django-debug-toolbar is typically configured in the project settings.
Choose django-extensions for a comprehensive set of development tools, or django-debug-toolbar for focused debugging and performance analysis.
Convert  designs to code with AI

Introducing Visual Copilot: A new AI model to turn Figma designs to high quality code using your components.
Try Visual CopilotREADME
===================================== Django Debug Toolbar |latest-version|
|build-status| |coverage| |docs| |python-support| |django-support|
.. |latest-version| image:: https://img.shields.io/pypi/v/django-debug-toolbar.svg :target: https://pypi.org/project/django-debug-toolbar/ :alt: Latest version on PyPI
.. |build-status| image:: https://github.com/django-commons/django-debug-toolbar/workflows/Test/badge.svg :target: https://github.com/django-commons/django-debug-toolbar/actions/workflows/test.yml :alt: Build Status
.. |coverage| image:: https://img.shields.io/badge/Coverage-94%25-green :target: https://github.com/django-commons/django-debug-toolbar/actions/workflows/test.yml?query=branch%3Amain :alt: Test coverage status
.. |docs| image:: https://img.shields.io/readthedocs/django-debug-toolbar/latest.svg :target: https://readthedocs.org/projects/django-debug-toolbar/ :alt: Documentation status
.. |python-support| image:: https://img.shields.io/pypi/pyversions/django-debug-toolbar :target: https://pypi.org/project/django-debug-toolbar/ :alt: Supported Python versions
.. |django-support| image:: https://img.shields.io/pypi/djversions/django-debug-toolbar :target: https://pypi.org/project/django-debug-toolbar/ :alt: Supported Django versions
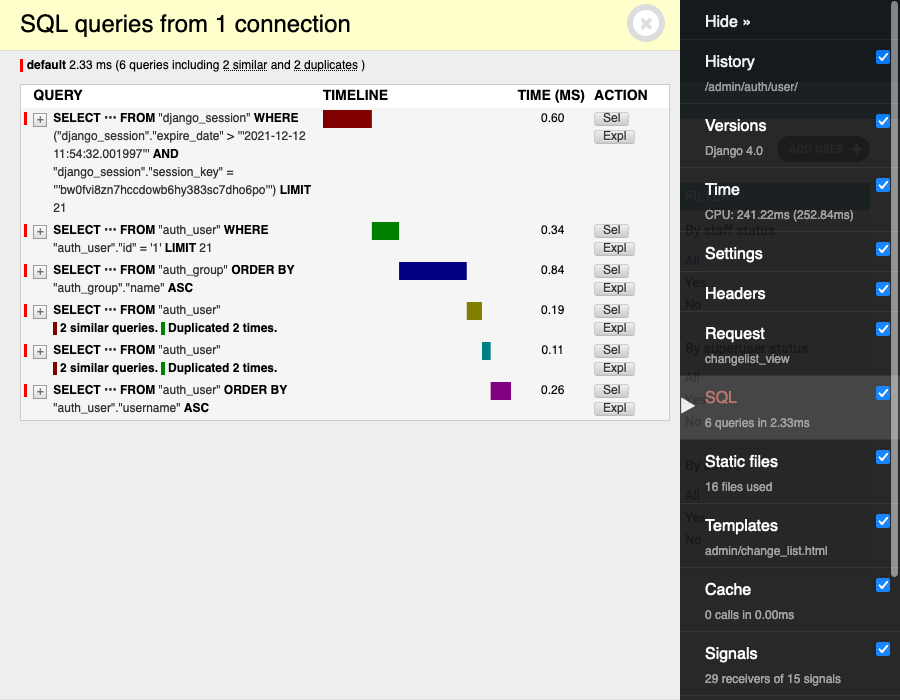
The Django Debug Toolbar is a configurable set of panels that display various debug information about the current request/response and when clicked, display more details about the panel's content.
Here's a screenshot of the toolbar in action:
.. image:: https://raw.github.com/django-commons/django-debug-toolbar/main/example/django-debug-toolbar.png :alt: Django Debug Toolbar screenshot
In addition to the built-in panels, a number of third-party panels are contributed by the community.
The current stable version of the Debug Toolbar is 5.2.0. It works on Django ⥠4.2.0.
The Debug Toolbar has experimental support for Django's asynchronous views <https://docs.djangoproject.com/en/dev/topics/async/>. Please note that
the Debug Toolbar still lacks the capability for handling concurrent requests.
If you find any issues, please report them on the issue tracker.
Documentation, including installation and configuration instructions, is available at https://django-debug-toolbar.readthedocs.io/.
The Django Debug Toolbar is released under the BSD license, like Django itself. If you like it, please consider contributing!
The Django Debug Toolbar was originally created by Rob Hudson rob@cogit8.org in August 2008 and was further developed by many contributors_.
.. _contributors: https://github.com/django-commons/django-debug-toolbar/graphs/contributors .. _issue tracker: https://github.com/django-commons/django-debug-toolbar/issues
Top Related Projects
A configurable set of panels that display various debug information about the current request/response.
This is a repository for collecting global custom management extensions for the Django Framework.
Convert designs to code with AI
Introducing Visual Copilot: A new AI model to turn Figma designs to high quality code using your components.
Try Visual Copilot