
Top Related Projects

Silky smooth profiling for Django
Quick Overview
Django-prometheus is a Django application that provides monitoring and metrics for Django projects using Prometheus. It automatically instruments Django applications to expose various metrics, such as request counts, database query times, and cache hit rates, making it easier to monitor and analyze the performance of Django-based web applications.
Pros
- Easy integration with Django projects
- Automatic instrumentation of key Django components
- Provides a wide range of pre-defined metrics out of the box
- Compatible with Prometheus monitoring system
Cons
- May introduce a small performance overhead
- Limited customization options for advanced use cases
- Requires additional setup for Prometheus server
- Documentation could be more comprehensive
Code Examples
- Adding django-prometheus to your Django project:
INSTALLED_APPS = [
    ...
    'django_prometheus',
    ...
]

MIDDLEWARE = [
    'django_prometheus.middleware.PrometheusBeforeMiddleware',
    ...
    'django_prometheus.middleware.PrometheusAfterMiddleware',
]
- Exposing metrics endpoint in urls.py:
from django.urls import path
from django_prometheus import exports

urlpatterns = [
    ...
    path('metrics/', exports.ExportToDjangoView.as_view(), name='prometheus-django-metrics'),
]
- Custom metric example:
from prometheus_client import Counter

api_requests_total = Counter('api_requests_total', 'Total count of API requests', ['endpoint'])

def my_view(request):
    api_requests_total.labels(endpoint='/my-endpoint').inc()
    # Your view logic here
Getting Started
-
Install django-prometheus:
pip install django-prometheus -
Add 'django_prometheus' to INSTALLED_APPS in settings.py.
-
Add PrometheusBeforeMiddleware and PrometheusAfterMiddleware to MIDDLEWARE in settings.py.
-
Add the metrics endpoint to urls.py:
from django.urls import path from django_prometheus import exports urlpatterns = [ ... path('metrics/', exports.ExportToDjangoView.as_view(), name='prometheus-django-metrics'), ] -
Restart your Django application and access the metrics at /metrics/ endpoint.
Competitor Comparisons
Silky smooth profiling for Django
Pros of django-silk
- Provides a detailed web interface for analyzing request data, including SQL queries, time spent, and profiling information
- Offers real-time request inspection and debugging capabilities
- Supports custom profiling of specific functions or code blocks
Cons of django-silk
- May have a higher performance overhead due to its comprehensive data collection
- Requires more setup and configuration compared to django-prometheus
- Not specifically designed for integration with monitoring systems like Prometheus
Code Comparison
django-silk:
from silk.profiling.profiler import silk_profile

@silk_profile(name='View Blog Post')
def post_detail(request, post_id):
    # View logic here
django-prometheus:
from django_prometheus.exports import ExportToDjangoView

urlpatterns = [
    path('metrics/', ExportToDjangoView, name='prometheus-django-metrics'),
]
django-silk focuses on detailed profiling and debugging, offering a rich web interface for developers. It's particularly useful during development and testing phases. django-prometheus, on the other hand, is more oriented towards production monitoring and metrics collection, with a focus on integration with Prometheus. The code examples show how django-silk allows for function-level profiling, while django-prometheus typically involves setting up metrics endpoints for Prometheus to scrape.
Convert  designs to code with AI

Introducing Visual Copilot: A new AI model to turn Figma designs to high quality code using your components.
Try Visual CopilotREADME
django-prometheus
Export Django monitoring metrics for Prometheus.io

![]()
![]()
![]()

Features
This library provides Prometheus metrics for Django related operations:
- Requests & Responses
- Database access done via Django ORM
- Cache access done via Django Cache framework
Usage
Requirements
- Django >= 4.2
- Python 3.9 and above.
Installation
Install with:
pip install django-prometheus
Or, if you're using a development version cloned from this repository:
python path-to-where-you-cloned-django-prometheus/setup.py install
This will install prometheus_client as a dependency.
Quickstart
In your settings.py:
INSTALLED_APPS = [
   ...
   'django_prometheus',
   ...
]

MIDDLEWARE = [
    'django_prometheus.middleware.PrometheusBeforeMiddleware',
    # All your other middlewares go here, including the default
    # middlewares like SessionMiddleware, CommonMiddleware,
    # CsrfViewmiddleware, SecurityMiddleware, etc.
    'django_prometheus.middleware.PrometheusAfterMiddleware',
]
In your urls.py:
urlpatterns = [
    ...
    path('', include('django_prometheus.urls')),
]
Configuration
Prometheus uses Histogram based grouping for monitoring latencies. The default buckets are:
PROMETHEUS_LATENCY_BUCKETS = (0.01, 0.025, 0.05, 0.075, 0.1, 0.25, 0.5, 0.75, 1.0, 2.5, 5.0, 7.5, 10.0, 25.0, 50.0, 75.0, float("inf"),)
You can define custom buckets for latency, adding more buckets decreases performance but increases accuracy: https://prometheus.io/docs/practices/histograms/
PROMETHEUS_LATENCY_BUCKETS = (.1, .2, .5, .6, .8, 1.0, 2.0, 3.0, 4.0, 5.0, 6.0, 7.5, 9.0, 12.0, 15.0, 20.0, 30.0, float("inf"))
You can have a custom namespace for your metrics:
PROMETHEUS_METRIC_NAMESPACE = "project"
This will prefix all metrics with project_ word like this:
project_django_http_requests_total_by_method_total{method="GET"} 1.0
Monitoring your databases
SQLite, MySQL, and PostgreSQL databases can be monitored. Just
replace the ENGINE property of your database, replacing
django.db.backends with django_prometheus.db.backends.
DATABASES = {
    'default': {
        'ENGINE': 'django_prometheus.db.backends.sqlite3',
        'NAME': os.path.join(BASE_DIR, 'db.sqlite3'),
    },
}
Monitoring your caches
Filebased, memcached, redis caches can be monitored. Just replace
the cache backend to use the one provided by django_prometheus
django.core.cache.backends with django_prometheus.cache.backends.
CACHES = {
    'default': {
        'BACKEND': 'django_prometheus.cache.backends.filebased.FileBasedCache',
        'LOCATION': '/var/tmp/django_cache',
    }
}
Monitoring your models
You may want to monitor the creation/deletion/update rate for your model. This can be done by adding a mixin to them. This is safe to do on existing models (it does not require a migration).
If your model is:
class Dog(models.Model):
    name = models.CharField(max_length=100, unique=True)
    breed = models.CharField(max_length=100, blank=True, null=True)
    age = models.PositiveIntegerField(blank=True, null=True)
Just add the ExportModelOperationsMixin as such:
from django_prometheus.models import ExportModelOperationsMixin

class Dog(ExportModelOperationsMixin('dog'), models.Model):
    name = models.CharField(max_length=100, unique=True)
    breed = models.CharField(max_length=100, blank=True, null=True)
    age = models.PositiveIntegerField(blank=True, null=True)
This will export 3 metrics, django_model_inserts_total{model="dog"},
django_model_updates_total{model="dog"} and
django_model_deletes_total{model="dog"}.
Note that the exported metrics are counters of creations, modifications and deletions done in the current process. They are not gauges of the number of objects in the model.
Starting with Django 1.7, migrations are also monitored. Two gauges
are exported, django_migrations_applied_by_connection and
django_migrations_unapplied_by_connection. You may want to alert if
there are unapplied migrations.
If you want to disable the Django migration metrics, set the
PROMETHEUS_EXPORT_MIGRATIONS setting to False.
Monitoring and aggregating the metrics
Prometheus is quite easy to set up. An example prometheus.conf to
scrape 127.0.0.1:8001 can be found in examples/prometheus.
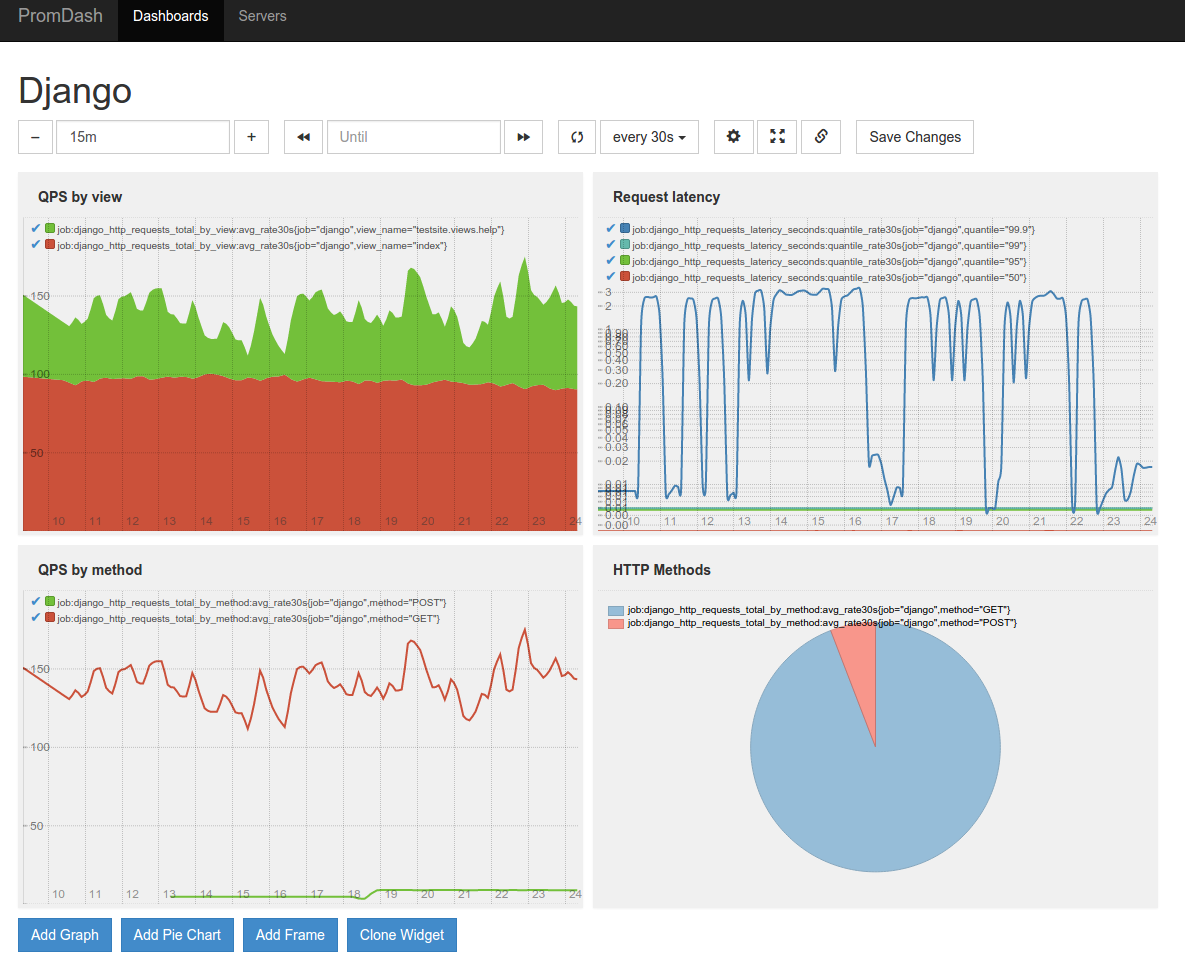
Here's an example of a PromDash displaying some of the metrics collected by django-prometheus:
Adding your own metrics
You can add application-level metrics in your code by using prometheus_client directly. The exporter is global and will pick up your metrics.
To add metrics to the Django internals, the easiest way is to extend django-prometheus' classes. Please consider contributing your metrics, pull requests are welcome. Make sure to read the Prometheus best practices on instrumentation and naming.
Importing Django Prometheus using only local settings
If you wish to use Django Prometheus but are not able to change the code base, it's possible to have all the default metrics by modifying only the settings.
First step is to inject prometheus' middlewares and to add django_prometheus in INSTALLED_APPS
MIDDLEWARE = \
    ['django_prometheus.middleware.PrometheusBeforeMiddleware'] + \
    MIDDLEWARE + \
    ['django_prometheus.middleware.PrometheusAfterMiddleware']

INSTALLED_APPS += ['django_prometheus']
Second step is to create the /metrics end point, for that we need another file (called urls_prometheus_wrapper.py in this example) that will wraps the apps URLs and add one on top:
from django.urls import include, path


urlpatterns = []

urlpatterns.append(path('prometheus/', include('django_prometheus.urls')))
urlpatterns.append(path('', include('myapp.urls')))
This file will add a "/prometheus/metrics" end point to the URLs of django that will export the metrics (replace myapp by your project name).
Then we inject the wrapper in settings:
ROOT_URLCONF = "graphite.urls_prometheus_wrapper"
Adding custom labels to middleware (request/response) metrics
You can add application specific labels to metrics reported by the django-prometheus middleware. This involves extending the classes defined in middleware.py.
- Extend the Metrics class and override the
register_metricmethod to add the application specific labels. - Extend middleware classes, set the metrics_cls class attribute to the the extended metric class and override the label_metric method to attach custom metrics.
See implementation example in the test app
Top Related Projects
Silky smooth profiling for Django
Convert designs to code with AI
Introducing Visual Copilot: A new AI model to turn Figma designs to high quality code using your components.
Try Visual Copilot