
Top Related Projects

A configurable set of panels that display various debug information about the current request/response.
Export Django monitoring metrics for Prometheus.io

This is a repository for collecting global custom management extensions for the Django Framework.
Dynamic Django settings.
Quick Overview
Django Silk is a profiling and inspection tool for Django applications. It provides detailed insights into HTTP requests and database queries, allowing developers to identify performance bottlenecks and optimize their Django projects. Silk offers a user-friendly web interface for analyzing collected data.
Pros
- Comprehensive profiling of HTTP requests, database queries, and Python functions
- Easy-to-use web interface for visualizing and analyzing performance data
- Minimal configuration required for basic usage
- Supports both development and production environments with configurable options
Cons
- Can introduce performance overhead, especially in production environments
- May require additional storage for collecting and storing profiling data
- Limited customization options for the web interface
- Potential security risks if enabled in production without proper access controls
Code Examples
- Basic setup in Django settings:
MIDDLEWARE = [
    ...
    'silk.middleware.SilkyMiddleware',
    ...
]

INSTALLED_APPS = [
    ...
    'silk',
    ...
]
- Profiling a specific view:
from silk.profiling.profiler import silk_profile

@silk_profile(name='My View')
def my_view(request):
    # Your view logic here
    return HttpResponse("Hello, World!")
- Profiling a database query:
from silk.profiling.profiler import silk_profile

with silk_profile(name='Get all users'):
    users = User.objects.all()
- Configuring Silk for production use:
SILKY_AUTHENTICATION = True
SILKY_AUTHORISATION = True
SILKY_MAX_RECORDED_REQUESTS = 10000
SILKY_MAX_RECORDED_REQUESTS_CHECK_PERCENT = 10
Getting Started
-
Install Django Silk:
pip install django-silk -
Add 'silk' to INSTALLED_APPS in settings.py:
INSTALLED_APPS = [ ... 'silk', ] -
Add SilkyMiddleware to MIDDLEWARE in settings.py:
MIDDLEWARE = [ ... 'silk.middleware.SilkyMiddleware', ... ] -
Include Silk URLs in your project's urls.py:
from django.urls import path, include urlpatterns = [ ... path('silk/', include('silk.urls', namespace='silk')), ] -
Run migrations:
python manage.py migrate -
Start your Django server and access the Silk interface at
/silk/.
Competitor Comparisons
A configurable set of panels that display various debug information about the current request/response.
Pros of Django Debug Toolbar
- More lightweight and easier to set up
- Provides a comprehensive set of panels for debugging various aspects of Django applications
- Integrates seamlessly with the Django admin interface
Cons of Django Debug Toolbar
- Limited profiling capabilities compared to Django Silk
- Less detailed request/response information
- Doesn't provide long-term storage of profiling data
Code Comparison
Django Debug Toolbar configuration:
INSTALLED_APPS = [
    # ...
    'debug_toolbar',
]

MIDDLEWARE = [
    # ...
    'debug_toolbar.middleware.DebugToolbarMiddleware',
]
Django Silk configuration:
INSTALLED_APPS = [
    # ...
    'silk',
]

MIDDLEWARE = [
    # ...
    'silk.middleware.SilkyMiddleware',
]
Both tools require similar configuration in Django settings, but Django Silk offers more advanced profiling options and data storage capabilities. Django Debug Toolbar is more focused on providing quick, in-browser debugging information, while Django Silk excels in detailed performance analysis and long-term profiling data storage.
Export Django monitoring metrics for Prometheus.io
Pros of django-prometheus
- Focuses on Prometheus-specific metrics and integration
- Provides more comprehensive system-level metrics (CPU, memory, etc.)
- Easier integration with existing Prometheus-based monitoring setups
Cons of django-prometheus
- Less detailed per-request profiling information
- Lacks built-in visualization tools for metrics
- May require additional setup for full Prometheus ecosystem
Code Comparison
django-prometheus:
from django_prometheus.exports import ExportToDjangoView

urlpatterns = [
    path('metrics/', ExportToDjangoView.as_view(), name='prometheus-django-metrics'),
]
django-silk:
from django.conf.urls import url
from silk.views.profile_detail import ProfilingDetailView

urlpatterns = [
    url(r'^silk/request/(?P<request_id>[a-zA-Z0-9\-]+)/$', ProfilingDetailView.as_view(), name='silk_request_detail'),
]
django-prometheus focuses on exporting metrics for Prometheus, while django-silk provides detailed profiling views. django-prometheus requires less configuration for basic metric collection, but django-silk offers more out-of-the-box visualizations for performance analysis. The choice between them depends on your existing monitoring infrastructure and specific needs for performance insights.
This is a repository for collecting global custom management extensions for the Django Framework.
Pros of django-extensions
- Broader scope with a wide range of management commands and utilities
- More established project with a larger community and longer history
- Includes development tools like shell_plus and notebook
Cons of django-extensions
- May introduce unnecessary complexity for projects that don't need all features
- Less focused on performance profiling compared to django-silk
- Requires more configuration to set up specific features
Code Comparison
django-extensions:
from django_extensions.db.models import TimeStampedModel

class MyModel(TimeStampedModel):
    name = models.CharField(max_length=100)
django-silk:
from django.db import models
from silk.profiling.profiler import silk_profile

@silk_profile(name='My View')
def my_view(request):
    # View logic here
django-extensions provides abstract models and utilities for common patterns, while django-silk focuses on request profiling and performance analysis. django-extensions offers a broader set of tools for Django development, whereas django-silk specializes in monitoring and debugging performance issues. The choice between them depends on the specific needs of your project, with django-extensions being more suitable for general development enhancements and django-silk for targeted performance optimization.
Dynamic Django settings.
Pros of django-constance
- Lightweight and focused on dynamic settings management
- Easy integration with Django's admin interface
- Supports multiple storage backends (database, Redis)
Cons of django-constance
- Limited to configuration management, lacks profiling capabilities
- No built-in visualization tools for settings
- Less comprehensive documentation compared to django-silk
Code Comparison
django-constance:
from constance import config

# Using a dynamic setting
max_items = config.MAX_ITEMS_PER_PAGE
django-silk:
from silk.profiling.profiler import silk_profile

@silk_profile(name='View Blog Post')
def post_detail(request, post_id):
    # View logic here
Key Differences
django-constance is primarily focused on managing dynamic settings for Django projects, allowing easy configuration changes without code deployments. It's lightweight and integrates well with Django's admin interface.
django-silk, on the other hand, is a comprehensive profiling and inspection tool for Django applications. It provides detailed insights into request/response data, SQL queries, and overall application performance.
While django-constance excels in configuration management, django-silk offers robust profiling and debugging capabilities, making it more suitable for performance optimization and troubleshooting complex Django applications.
Convert  designs to code with AI

Introducing Visual Copilot: A new AI model to turn Figma designs to high quality code using your components.
Try Visual CopilotREADME
Silk
![]()
![]()


![]()
Silk is a live profiling and inspection tool for the Django framework. Silk intercepts and stores HTTP requests and database queries before presenting them in a user interface for further inspection:
Contents
Requirements
Silk has been tested with:
- Django: 4.2, 5.1, 5.2
- Python: 3.9, 3.10, 3.11, 3.12, 3.13
Installation
Via pip into a virtualenv:
pip install django-silk
To including optional formatting of python snippets:
pip install django-silk[formatting]
In settings.py add the following:
MIDDLEWARE = [
    ...
    'silk.middleware.SilkyMiddleware',
    ...
]

TEMPLATES = [{
    ...
    'OPTIONS': {
        'context_processors': [
            ...
            'django.template.context_processors.request',
        ],
    },
}]


INSTALLED_APPS = (
    ...
    'silk'
)
Note: The order of middleware is sensitive. If any middleware placed before silk.middleware.SilkyMiddleware returns a response without invoking its get_response, the SilkyMiddleware wonât run. To avoid this, ensure that middleware preceding SilkyMiddleware does not bypass or return a response without calling its get_response. For further details, check out the Django documentation.
Note: If you are using django.middleware.gzip.GZipMiddleware, place that before silk.middleware.SilkyMiddleware, otherwise you will get an encoding error.
If you want to use custom middleware, for example you developed the subclass of silk.middleware.SilkyMiddleware, so you can use this combination of settings:
# Specify the path where is the custom middleware placed
SILKY_MIDDLEWARE_CLASS = 'path.to.your.middleware.MyCustomSilkyMiddleware'

# Use this variable in list of middleware
MIDDLEWARE = [
    ...
    SILKY_MIDDLEWARE_CLASS,
    ...
]
To enable access to the user interface add the following to your urls.py:
urlpatterns += [path('silk/', include('silk.urls', namespace='silk'))]
before running migrate:
python manage.py migrate

python manage.py collectstatic
Silk will automatically begin interception of requests and you can proceed to add profiling
if required. The UI can be reached at /silk/
Alternative Installation
Via github tags:
pip install git+https://github.com/jazzband/django-silk.git@<version>#egg=django_silk
You can install from master using the following, but please be aware that the version in master may not be working for all versions specified in requirements
pip install -e git+https://github.com/jazzband/django-silk.git#egg=django_silk
Features
Silk primarily consists of:
- Middleware for intercepting Requests/Responses
- A wrapper around SQL execution for profiling of database queries
- A context manager/decorator for profiling blocks of code and functions either manually or dynamically.
- A user interface for inspection and visualisation of the above.
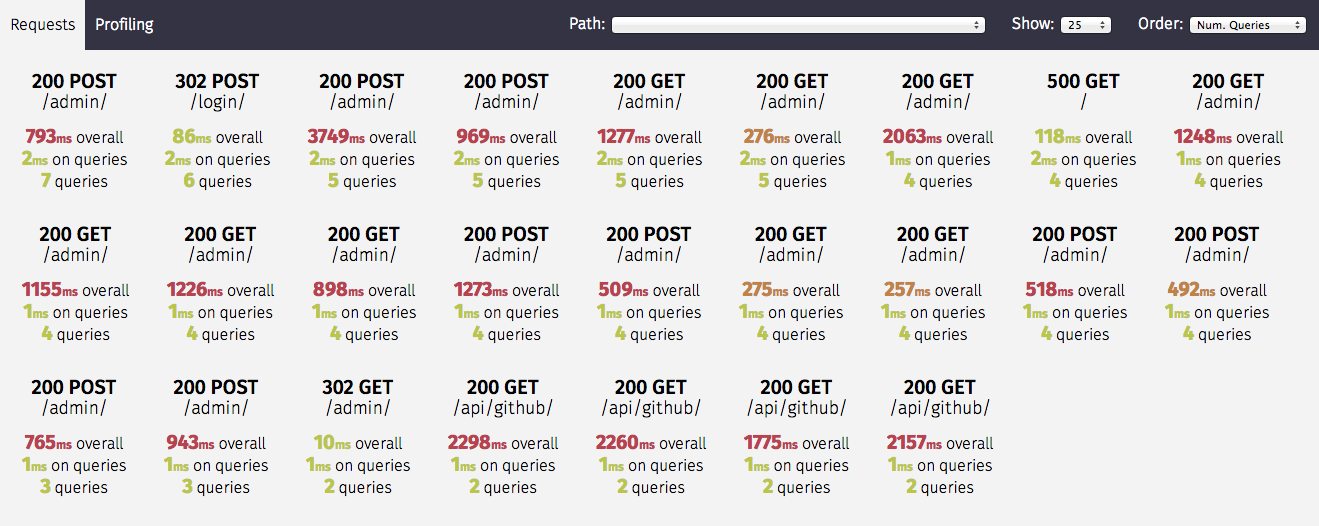
Request Inspection
The Silk middleware intercepts and stores requests and responses in the configured database. These requests can then be filtered and inspecting using Silk's UI through the request overview:
It records things like:
- Time taken
- Num. queries
- Time spent on queries
- Request/Response headers
- Request/Response bodies
and so on.
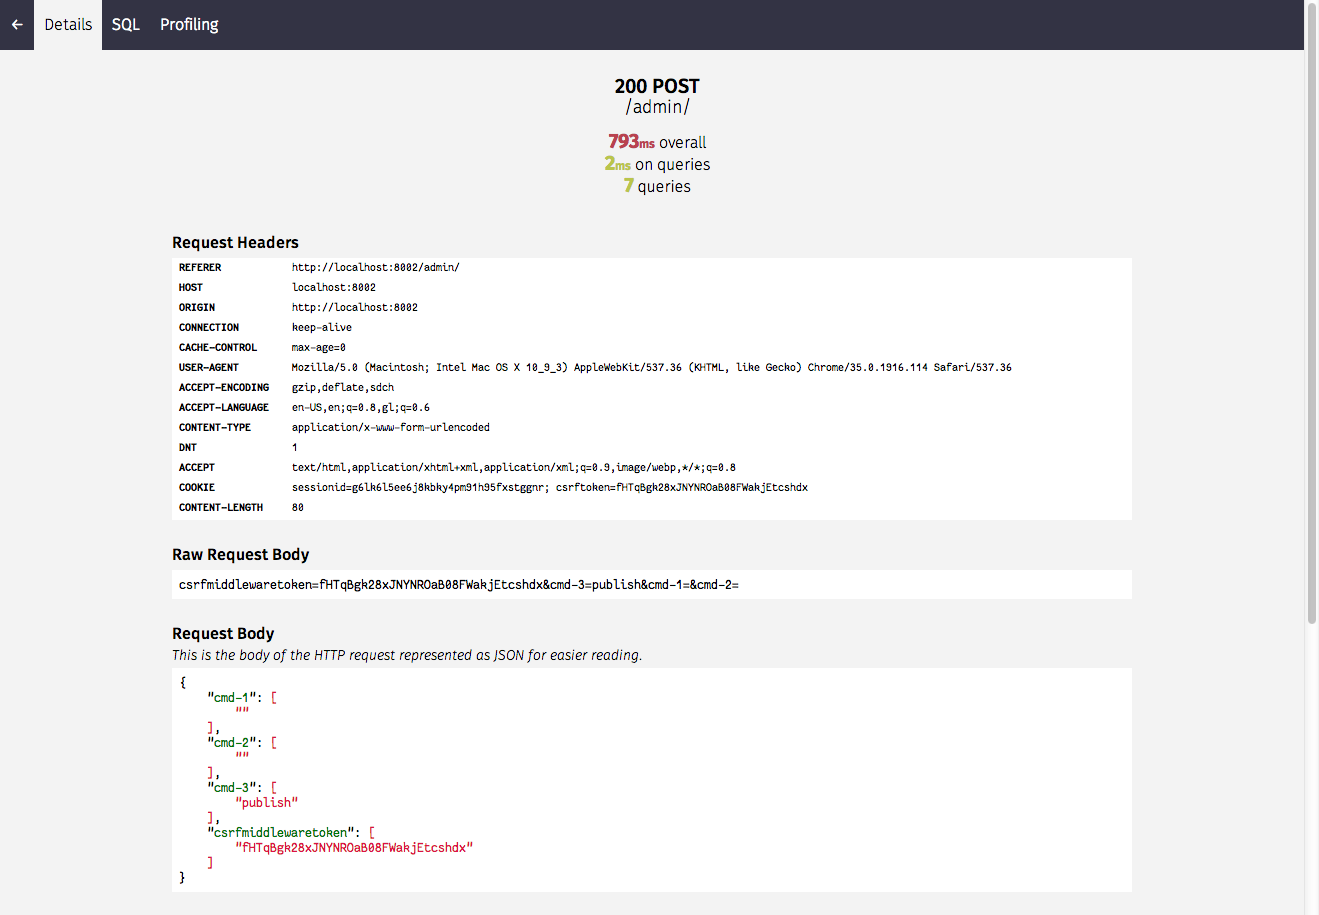
Further details on each request are also available by clicking the relevant request:
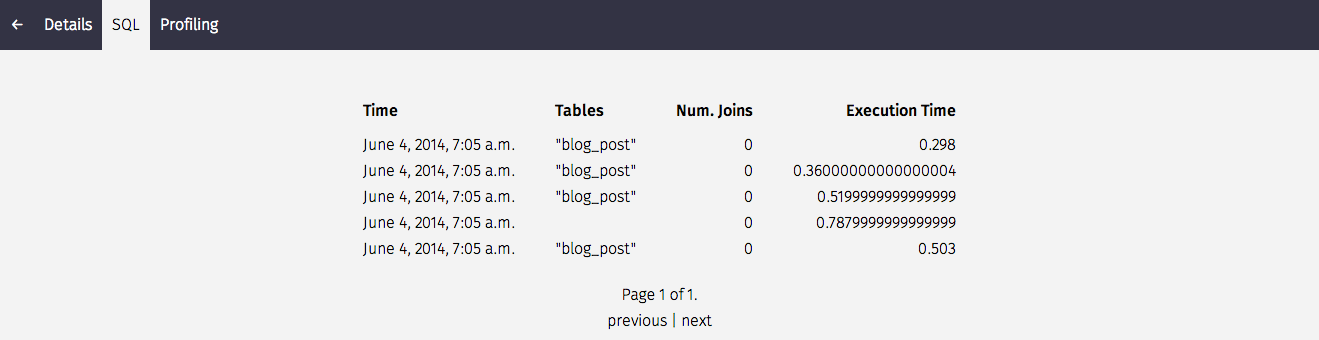
SQL Inspection
Silk also intercepts SQL queries that are generated by each request. We can get a summary on things like the tables involved, number of joins and execution time (the table can be sorted by clicking on a column header):
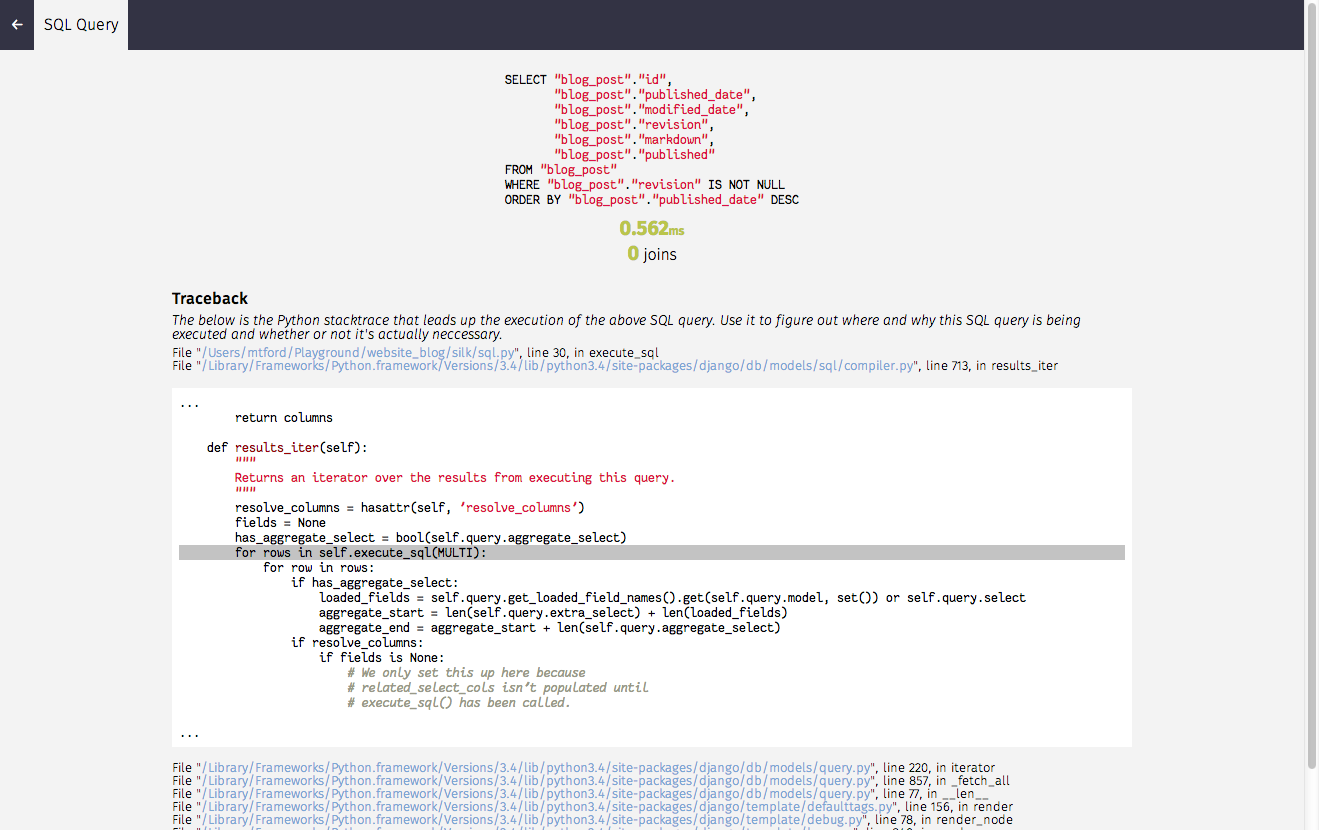
Before diving into the stack trace to figure out where this request is coming from:
Profiling
Turn on the SILKY_PYTHON_PROFILER setting to use Python's built-in cProfile profiler. Each request will be separately profiled and the profiler's output will be available on the request's Profiling page in the Silk UI. Note that as of Python 3.12, cProfile cannot run concurrently so django-silk under Python 3.12 and later will not profile if another profile is running (even its own profiler in another thread).
SILKY_PYTHON_PROFILER = True
If you would like to also generate a binary .prof file set the following:
SILKY_PYTHON_PROFILER_BINARY = True
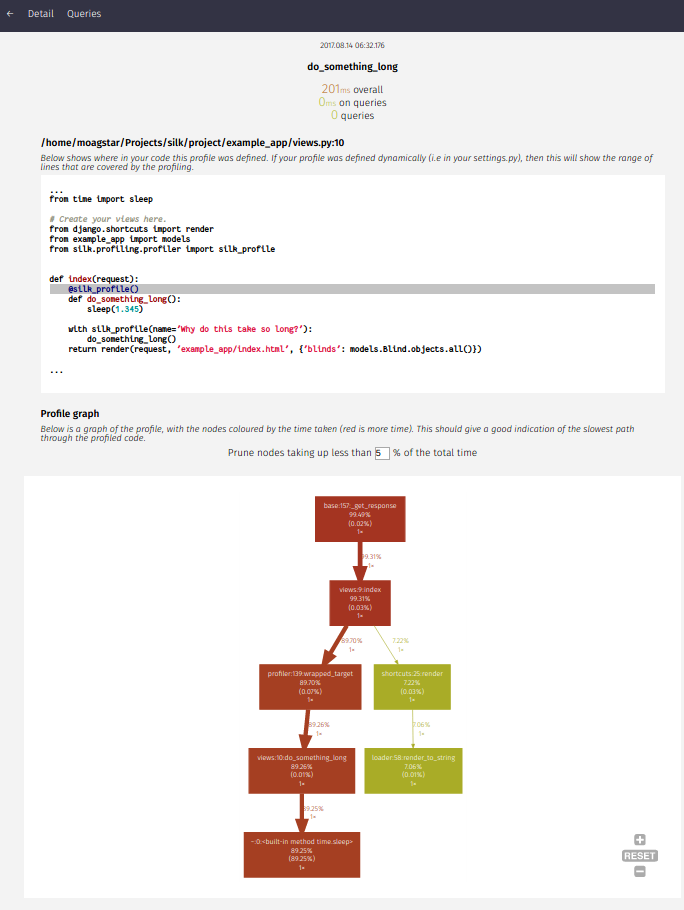
When enabled, a graph visualisation generated using gprof2dot and viz.js is shown in the profile detail page:
A custom storage class can be used for the saved generated binary .prof files:
# For Django >= 4.2 and Django-Silk >= 5.1.0:
# See https://docs.djangoproject.com/en/5.0/ref/settings/#std-setting-STORAGES
STORAGES = {
    'SILKY_STORAGE': {
        'BACKEND': 'path.to.StorageClass',
    },
    # ...
}

# For Django < 4.2 or Django-Silk < 5.1.0
SILKY_STORAGE_CLASS = 'path.to.StorageClass'
The default storage class is silk.storage.ProfilerResultStorage, and when using that you can specify a path of your choosing. You must ensure the specified directory exists.
# If this is not set, MEDIA_ROOT will be used.
SILKY_PYTHON_PROFILER_RESULT_PATH = '/path/to/profiles/'
A download button will become available with a binary .prof file for every request. This file can be used for further analysis using snakeviz or other cProfile tools
To retrieve which endpoint generates a specific profile file it is possible to add a stub of the request path in the file name with the following:
SILKY_PYTHON_PROFILER_EXTENDED_FILE_NAME = True
Silk can also be used to profile specific blocks of code/functions. It provides a decorator and a context manager for this purpose.
For example:
from silk.profiling.profiler import silk_profile


@silk_profile(name='View Blog Post')
def post(request, post_id):
    p = Post.objects.get(pk=post_id)
    return render(request, 'post.html', {
        'post': p
    })
Whenever a blog post is viewed we get an entry within the Silk UI:
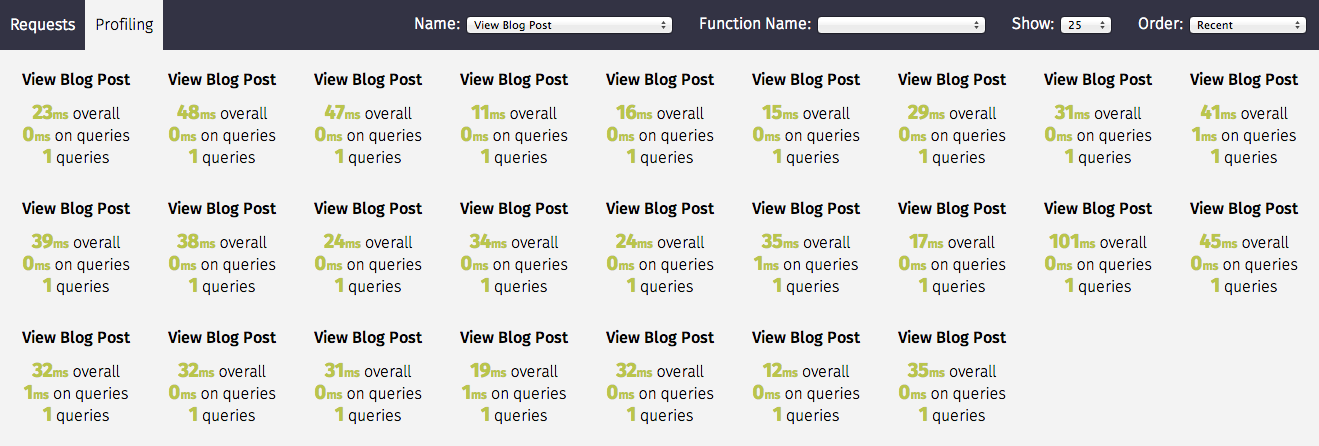
Silk profiling not only provides execution time, but also collects SQL queries executed within the block in the same fashion as with requests:

Decorator
The silk decorator can be applied to both functions and methods
from silk.profiling.profiler import silk_profile


# Profile a view function
@silk_profile(name='View Blog Post')
def post(request, post_id):
    p = Post.objects.get(pk=post_id)
    return render(request, 'post.html', {
        'post': p
    })


# Profile a method in a view class
class MyView(View):
    @silk_profile(name='View Blog Post')
    def get(self, request):
        p = Post.objects.get(pk=post_id)
        return render(request, 'post.html', {
            'post': p
        })
Context Manager
Using a context manager means we can add additional context to the name which can be useful for narrowing down slowness to particular database records.
def post(request, post_id):
    with silk_profile(name='View Blog Post #%d' % self.pk):
        p = Post.objects.get(pk=post_id)
        return render(request, 'post.html', {
            'post': p
        })
Dynamic Profiling
One of Silk's more interesting features is dynamic profiling. If for example we wanted to profile a function in a dependency to which we only have read-only access (e.g. system python libraries owned by root) we can add the following to settings.py to apply a decorator at runtime:
SILKY_DYNAMIC_PROFILING = [{
    'module': 'path.to.module',
    'function': 'MyClass.bar'
}]
which is roughly equivalent to:
class MyClass:
    @silk_profile()
    def bar(self):
        pass
The below summarizes the possibilities:
"""
Dynamic function decorator
"""

SILKY_DYNAMIC_PROFILING = [{
    'module': 'path.to.module',
    'function': 'foo'
}]

# ... is roughly equivalent to
@silk_profile()
def foo():
    pass

"""
Dynamic method decorator
"""

SILKY_DYNAMIC_PROFILING = [{
    'module': 'path.to.module',
    'function': 'MyClass.bar'
}]

# ... is roughly equivalent to
class MyClass:

    @silk_profile()
    def bar(self):
        pass

"""
Dynamic code block profiling
"""

SILKY_DYNAMIC_PROFILING = [{
    'module': 'path.to.module',
    'function': 'foo',
    # Line numbers are relative to the function as opposed to the file in which it resides
    'start_line': 1,
    'end_line': 2,
    'name': 'Slow Foo'
}]

# ... is roughly equivalent to
def foo():
    with silk_profile(name='Slow Foo'):
        print (1)
        print (2)
    print(3)
    print(4)
Note that dynamic profiling behaves in a similar fashion to that of the python mock framework in that we modify the function in-place e.g:
""" my.module """
from another.module import foo

# ...do some stuff
foo()
# ...do some other stuff
,we would profile foo by dynamically decorating my.module.foo as opposed to another.module.foo:
SILKY_DYNAMIC_PROFILING = [{
    'module': 'my.module',
    'function': 'foo'
}]
If we were to apply the dynamic profile to the functions source module another.module.foo after
it has already been imported, no profiling would be triggered.
Custom Logic for Profiling
Sometimes you may want to dynamically control when the profiler runs. You can write your own logic for when to enable the profiler. To do this add the following to your settings.py:
This setting is mutually exclusive with SILKY_PYTHON_PROFILER and will be used over it if present. It will work with SILKY_DYNAMIC_PROFILING.
def my_custom_logic(request):
    return 'profile_requests' in request.session

SILKY_PYTHON_PROFILER_FUNC = my_custom_logic # profile only session has recording enabled.
You can also use a lambda.
# profile only session has recording enabled.
SILKY_PYTHON_PROFILER_FUNC = lambda request: 'profile_requests' in request.session
Code Generation
Silk currently generates two bits of code per request:

Both are intended for use in replaying the request. The curl command can be used to replay via command-line and the python code can be used within a Django unit test or simply as a standalone script.
Configuration
Authentication/Authorisation
By default anybody can access the Silk user interface by heading to /silk/. To enable your Django
auth backend place the following in settings.py:
SILKY_AUTHENTICATION = True  # User must login
SILKY_AUTHORISATION = True  # User must have permissions
If SILKY_AUTHORISATION is True, by default Silk will only authorise users with is_staff attribute set to True.
You can customise this using the following in settings.py:
def my_custom_perms(user):
    return user.is_allowed_to_use_silk

SILKY_PERMISSIONS = my_custom_perms
You can also use a lambda.
SILKY_PERMISSIONS = lambda user: user.is_superuser
Request/Response bodies
By default, Silk will save down the request and response bodies for each request for future viewing no matter how large. If Silk is used in production under heavy volume with large bodies this can have a huge impact on space/time performance. This behaviour can be configured with the following options:
SILKY_MAX_REQUEST_BODY_SIZE = -1  # Silk takes anything <0 as no limit
SILKY_MAX_RESPONSE_BODY_SIZE = 1024  # If response body>1024 bytes, ignore
Meta-Profiling
Sometimes it is useful to be able to see what effect Silk is having on the request/response time. To do this add
the following to your settings.py:
SILKY_META = True
Silk will then record how long it takes to save everything down to the database at the end of each request:
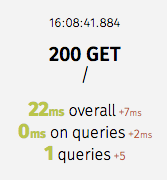
Note that in the above screenshot, this means that the request took 29ms (22ms from Django and 7ms from Silk)
Recording a Fraction of Requests
On high-load sites it may be helpful to only record a fraction of the requests that are made. To do this add the following to your settings.py:
Note: This setting is mutually exclusive with SILKY_INTERCEPT_FUNC.
SILKY_INTERCEPT_PERCENT = 50 # log only 50% of requests
Custom Logic for Recording Requests
On high-load sites it may also be helpful to write your own logic for when to intercept requests. To do this add the following to your settings.py:
Note: This setting is mutually exclusive with SILKY_INTERCEPT_PERCENT.
def my_custom_logic(request):
    return 'record_requests' in request.session

SILKY_INTERCEPT_FUNC = my_custom_logic # log only session has recording enabled.
You can also use a lambda.
# log only session has recording enabled.
SILKY_INTERCEPT_FUNC = lambda request: 'record_requests' in request.session
Limiting request/response data
To make sure silky garbage collects old request/response data, a config var can be set to limit the number of request/response rows it stores.
SILKY_MAX_RECORDED_REQUESTS = 10**4
The garbage collection is only run on a percentage of requests to reduce overhead. It can be adjusted with this config:
SILKY_MAX_RECORDED_REQUESTS_CHECK_PERCENT = 10
In case you want decouple silk's garbage collection from your webserver's request processing, set SILKY_MAX_RECORDED_REQUESTS_CHECK_PERCENT=0 and trigger it manually, e.g. in a cron job:
python manage.py silk_request_garbage_collect
Enable query analysis
To enable query analysis when supported by the dbms a config var can be set in order to execute queries with the analyze features.
SILKY_ANALYZE_QUERIES = True
Warning: This setting may cause the database to execute the same query twice, depending on the backend. For instance, EXPLAIN ANALYZE in Postgres will actually execute the query, which may result in unexpected data updates. Set this to True with caution.
To pass additional params for profiling when supported by the dbms (e.g. VERBOSE, FORMAT JSON), you can do this in the following manner.
SILKY_EXPLAIN_FLAGS = {'format':'JSON', 'costs': True}
Masking sensitive data on request body
By default, Silk is filtering values that contains the following keys (they are case insensitive)
SILKY_SENSITIVE_KEYS = {'username', 'api', 'token', 'key', 'secret', 'password', 'signature'}
But sometimes, you might want to have your own sensitive keywords, then above configuration can be modified
SILKY_SENSITIVE_KEYS = {'custom-password'}
Clearing logged data
A management command will wipe out all logged data:
python manage.py silk_clear_request_log
Contributing

This is a Jazzband project. By contributing you agree to abide by the Contributor Code of Conduct and follow the guidelines.
Development Environment
Silk features a project named project that can be used for silk development. It has the silk code symlinked so
you can work on the sample project and on the silk package at the same time.
In order to setup local development you should first install all the dependencies for the test project. From the
root of the project directory:
pip install -r requirements.txt
You will also need to install silk's dependencies. From the root of the git repository:
pip install -e .
At this point your virtual environment should have everything it needs to run both the sample project and
silk successfully.
Before running, you must set the DB_ENGINE and DB_NAME environment variables:
export DB_ENGINE=sqlite3
export DB_NAME=db.sqlite3
For other combinations, check tox.ini.
Now from the root of the sample project apply the migrations
python manage.py migrate
Now from the root of the sample project directory start the django server
python manage.py runserver
Running the tests
cd project
python manage.py test
Happy profiling!
Top Related Projects
A configurable set of panels that display various debug information about the current request/response.
Export Django monitoring metrics for Prometheus.io
This is a repository for collecting global custom management extensions for the Django Framework.
Dynamic Django settings.
Convert designs to code with AI
Introducing Visual Copilot: A new AI model to turn Figma designs to high quality code using your components.
Try Visual Copilot