Top Related Projects
🦋Butterfly,A JavaScript/React/Vue2 Diagramming library which concentrate on flow layout field. (基于JavaScript/React/Vue2的流程图组件)
🚀 JavaScript diagramming library that uses SVG and HTML for rendering.
mxGraph is a fully client side JavaScript diagramming library
a super simple, no-nonsense diagramming library written in react that just works
JavaScript framework for visual programming
A BPMN 2.0 rendering toolkit and web modeler.
Quick Overview
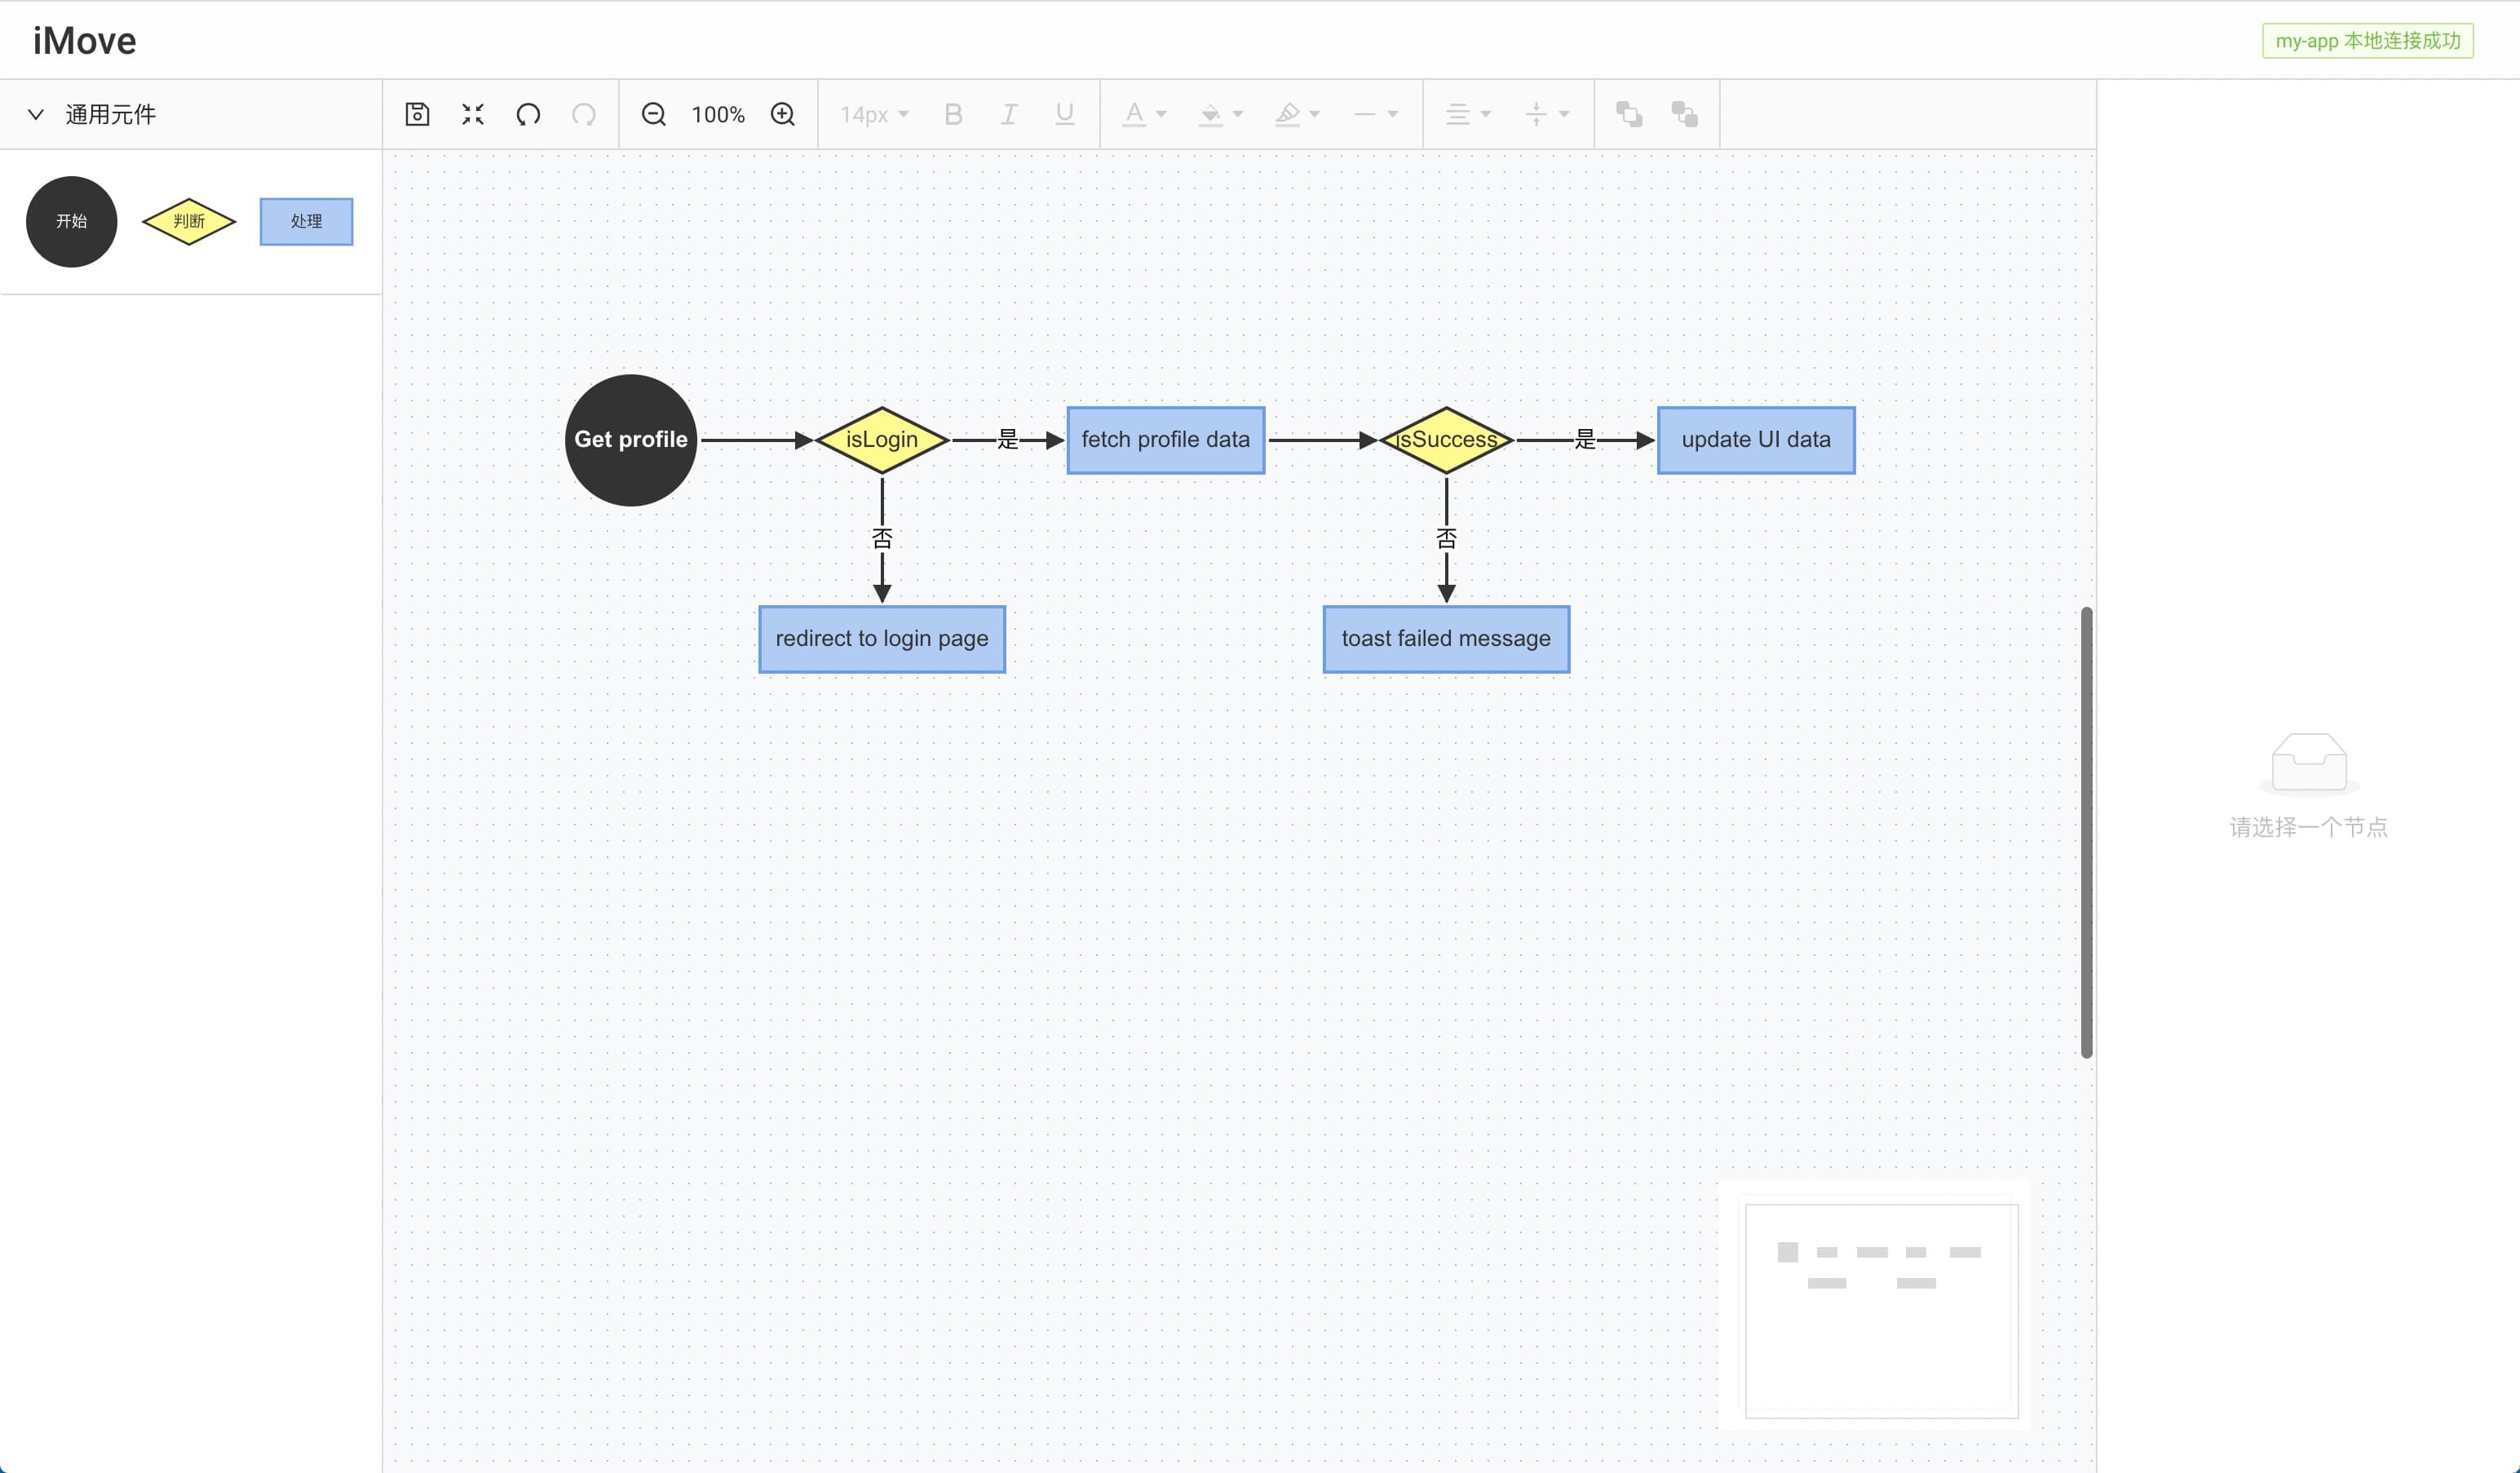
iMove is a visual programming tool for creating interactive flowcharts and logic diagrams. It allows users to design, test, and deploy workflows using a drag-and-drop interface, making it easier for both developers and non-technical users to create complex logic flows and business processes.
Pros
- Intuitive drag-and-drop interface for creating visual workflows
- Supports integration with various programming languages and frameworks
- Provides real-time preview and testing of workflows
- Exportable to code, making it easy to integrate with existing projects
Cons
- Limited documentation and examples for advanced use cases
- May have a learning curve for users unfamiliar with visual programming concepts
- Dependency on specific versions of React and other libraries may cause compatibility issues
- Limited community support compared to more established tools
Code Examples
// Creating a new iMove instance
import iMove from 'imove';

const imove = new iMove({
  container: document.getElementById('imove-container'),
  data: initialWorkflowData
});
// Adding a custom node type
imove.registerNodeType('customNode', {
  render: (props) => {
    return <CustomNodeComponent {...props} />;
  },
  validate: (node) => {
    // Custom validation logic
    return true;
  }
});
// Exporting the workflow to code
const exportedCode = imove.exportToCode('javascript');
console.log(exportedCode);
Getting Started
-
Install iMove:
npm install imove -
Create a new iMove instance in your React component:
import React, { useEffect, useRef } from 'react'; import iMove from 'imove'; function WorkflowEditor() { const containerRef = useRef(null); useEffect(() => { const imove = new iMove({ container: containerRef.current, data: {} // Initial workflow data }); return () => { imove.destroy(); }; }, []); return <div ref={containerRef} style={{ width: '100%', height: '600px' }} />; } export default WorkflowEditor; -
Start using iMove in your application to create and manage workflows visually.
Competitor Comparisons
🦋Butterfly,A JavaScript/React/Vue2 Diagramming library which concentrate on flow layout field. (基于JavaScript/React/Vue2的流程图组件)
Pros of Butterfly
- More comprehensive documentation and examples
- Larger community and more frequent updates
- Supports a wider range of diagram types and customization options
Cons of Butterfly
- Steeper learning curve due to more complex API
- Heavier package size, which may impact load times
- Less focus on low-code/no-code development compared to iMove
Code Comparison
Butterfly:
import { Canvas } from 'butterfly-dag';

const canvas = new Canvas({
  root: document.getElementById('dag-canvas'),
  disLinkable: true,
  linkable: true,
  draggable: true,
});
iMove:
import { Graph } from '@antv/x6';

const graph = new Graph({
  container: document.getElementById('container'),
  grid: true,
  autoResize: true,
});
Both libraries provide ways to create and manipulate diagrams, but Butterfly offers more built-in features and configuration options out of the box. iMove, on the other hand, focuses on simplicity and ease of use for creating flow-based applications.
Butterfly is better suited for complex, large-scale diagramming needs, while iMove excels in creating simpler, flow-based applications with a low-code approach. The choice between the two depends on the specific requirements of your project and the level of customization needed.
🚀 JavaScript diagramming library that uses SVG and HTML for rendering.
Pros of X6
- More comprehensive and feature-rich graph visualization library
- Better documentation and examples
- Larger community and more frequent updates
Cons of X6
- Steeper learning curve due to its extensive API
- Potentially heavier and slower for simpler use cases
Code Comparison
X6:
import { Graph } from '@antv/x6';

const graph = new Graph({
  container: document.getElementById('container'),
  width: 800,
  height: 600,
});

graph.addNode({
  x: 100,
  y: 100,
  width: 80,
  height: 40,
  label: 'Hello',
});
imove:
import { Graph } from '@antv/g6';

const graph = new Graph({
  container: 'container',
  width: 800,
  height: 600,
});

graph.data({
  nodes: [{ id: 'node1', x: 100, y: 100, label: 'Hello' }],
});
graph.render();
Summary
X6 offers a more robust and feature-rich solution for graph visualization, with better documentation and community support. However, it may be overkill for simpler projects. imove, while less comprehensive, might be easier to get started with for basic graph needs. The code comparison shows that X6 has a more object-oriented approach, while imove uses a data-driven model for rendering graphs.
mxGraph is a fully client side JavaScript diagramming library
Pros of mxgraph
- More mature and widely adopted project with extensive documentation
- Supports a broader range of diagram types and use cases
- Offers both client-side and server-side rendering options
Cons of mxgraph
- Steeper learning curve due to its comprehensive feature set
- Larger file size and potentially higher resource consumption
- Less focus on modern web technologies and frameworks
Code Comparison
mxgraph:
var graph = new mxGraph(container);
var parent = graph.getDefaultParent();
graph.getModel().beginUpdate();
try {
  var v1 = graph.insertVertex(parent, null, 'Hello,', 20, 20, 80, 30);
  var v2 = graph.insertVertex(parent, null, 'World!', 200, 150, 80, 30);
  var e1 = graph.insertEdge(parent, null, '', v1, v2);
} finally {
  graph.getModel().endUpdate();
}
imove:
import { Graph } from '@antv/x6';

const graph = new Graph({
  container: document.getElementById('container'),
  width: 800,
  height: 600,
});

const source = graph.addNode({
  x: 100,
  y: 100,
  label: 'Hello',
});

const target = graph.addNode({
  x: 300,
  y: 200,
  label: 'World',
});

graph.addEdge({
  source,
  target,
});
a super simple, no-nonsense diagramming library written in react that just works
Pros of react-diagrams
- More mature and actively maintained project with frequent updates
- Extensive documentation and examples for easier implementation
- Highly customizable with a flexible API for advanced use cases
Cons of react-diagrams
- Steeper learning curve due to its complexity and extensive features
- Larger bundle size, which may impact performance in some applications
- Less focused on low-code/no-code workflows compared to imove
Code Comparison
react-diagrams:
import createEngine, { DiagramModel, DefaultNodeModel } from '@projectstorm/react-diagrams';

const engine = createEngine();
const model = new DiagramModel();
const node1 = new DefaultNodeModel('Node 1', 'rgb(0,192,255)');
node1.setPosition(100, 100);
model.addAll(node1);
imove:
import { Graph } from '@antv/x6';

const graph = new Graph({
  container: document.getElementById('container'),
  width: 800,
  height: 600,
});
const node = graph.addNode({ x: 100, y: 100, label: 'Node 1' });
Both libraries provide ways to create and manipulate diagram elements, but react-diagrams offers a more object-oriented approach with its engine and model system, while imove (based on AntV X6) provides a simpler API for basic diagram creation.
JavaScript framework for visual programming
Pros of Rete
- More versatile and can be used for various types of visual programming
- Extensive documentation and examples available
- Larger community and more frequent updates
Cons of Rete
- Steeper learning curve due to its flexibility
- May require more setup and configuration for specific use cases
Code Comparison
Rete:
const numComponent = new Rete.Component('Number');
numComponent.addOutput(new Rete.Output('num', 'Number'));
numComponent.addControl(new NumControl(this.editor, 'num'));
iMove:
const node = {
  type: 'number',
  outputs: { result: 'number' },
  data: { value: 0 },
};
Key Differences
- Rete offers a more modular approach, allowing for custom components and controls
- iMove focuses on workflow automation and has a simpler API
- Rete provides more granular control over node behavior and appearance
- iMove is tailored for React applications, while Rete is framework-agnostic
Use Cases
- Rete: Visual programming editors, node-based interfaces, complex data flow systems
- iMove: Workflow automation, simple drag-and-drop interfaces, React-based applications
Both projects aim to provide visual programming interfaces, but Rete offers more flexibility at the cost of complexity, while iMove provides a simpler solution specifically for React-based workflow automation.
A BPMN 2.0 rendering toolkit and web modeler.
Pros of bpmn-js
- More mature and widely adopted in the BPMN modeling community
- Extensive documentation and examples available
- Supports BPMN 2.0 standard out of the box
Cons of bpmn-js
- Steeper learning curve for developers new to BPMN
- Less flexibility for custom workflow implementations
- Heavier library size due to comprehensive BPMN support
Code Comparison
bpmn-js:
import BpmnModeler from 'bpmn-js/lib/Modeler';

const modeler = new BpmnModeler({
  container: '#canvas',
  keyboard: { bindTo: document }
});

modeler.importXML(bpmnXML);
imove:
import { Graph } from '@antv/x6';

const graph = new Graph({
  container: document.getElementById('container'),
  width: 800,
  height: 600,
});

graph.fromJSON(data);
Summary
bpmn-js is a specialized tool for BPMN modeling, offering robust support for the BPMN 2.0 standard. It's well-documented and widely adopted but may be overkill for simpler workflow needs. imove, on the other hand, is more flexible and lightweight, making it easier to customize for specific workflow requirements. However, it lacks built-in BPMN support and may require more development effort for complex BPMN implementations.
Convert  designs to code with AI

Introducing Visual Copilot: A new AI model to turn Figma designs to high quality code using your components.
Try Visual CopilotREADME
INACTIVE: iMove æ¯ä¸ä¸ªé»è¾å¯å¤ç¨çï¼é¢åå½æ°çï¼æµç¨å¯è§åç JavaScript å·¥å ·åºã
English | ç®ä½ä¸æ
iMoveæ¯ä¸ä¸ªé¢åå端å¼åè çé»è¾ç¼æå·¥å ·ï¼æ ¸å¿è§£å³çæ¯å¤æé»è¾å¤ç¨çé®é¢ã
iMoveç±2é¨åç»æï¼ç»å¸åimove-sdkãéè¿æ¬å°èµ·ä¸ä¸ªhttpæå¡è¿è¡ç»å¸ï¼å¨ç»å¸ä¸å®æ代ç ç¼ååèç¹ç¼æï¼æç»å°æµç¨å¯¼åºdslï¼æ¾å°é¡¹ç®ä¸ï¼éè¿imove-sdkè°ç¨æ§è¡ã
ç¹æ§
- æµç¨å¯è§åï¼ä¸æç®åï¼ç»å¾æ¹ä¾¿ï¼é»è¾è¡¨è¾¾æ´ç´è§ï¼æäºç解
- **é»è¾å¤ç¨**ï¼iMove èç¹æ¯æå¤ç¨ï¼åèç¹æ¯æåæ°é ç½®
- çµæ´»å¯æ©å±ï¼ä» éåä¸ä¸ªå½æ°ï¼èç¹å¯æ©å±ï¼æ¯ææ件éæ
- **éç¨äºJavaScriptææåºæ¯**ï¼æ¯å¦å端ç¹å»äºä»¶ï¼Ajax 请æ±å Node.js å端 APIç
- å¤è¯è¨ç¼è¯ï¼æ è¯è¨ç¼è¯åºç éå¶ï¼ä¾ï¼æ¯æ JavaScript, Java ç¼è¯åºç ï¼
使ç¨åºæ¯

- å端æµç¨ï¼æ¯å¦ç¹å»äºä»¶ï¼ç»ä»¶çå½å¨æåè°çã
- å端æµç¨ï¼æ¯å¦ Node.js æ Serverless é¢åã
- å端+å端ï¼æ¯å¦å端ç¹å»äºä»¶ï¼Ajax 请æ±åå端 APIã
å¿«éå¼å§
æ¥éª¤ 1. åå¤
ä¸è½½ä»åºï¼å®è£ 并å¯å¨
$ git clone https://github.com/ykfe/imove.git
$ cd imove/example
$ npm install
$ npm start
æ¤æ¶æµè§å¨ä¼èªå¨æå¼ http://localhost:8000/ ï¼å¯ä»¥çå°è¿è¡ææã
æ¥éª¤ 2. ç»å¶æµç¨å¾
ä»å·¦ä¾§æå¨èç¹è³ä¸å¤®ç»å¸ï¼ç»å¶æµç¨å¾

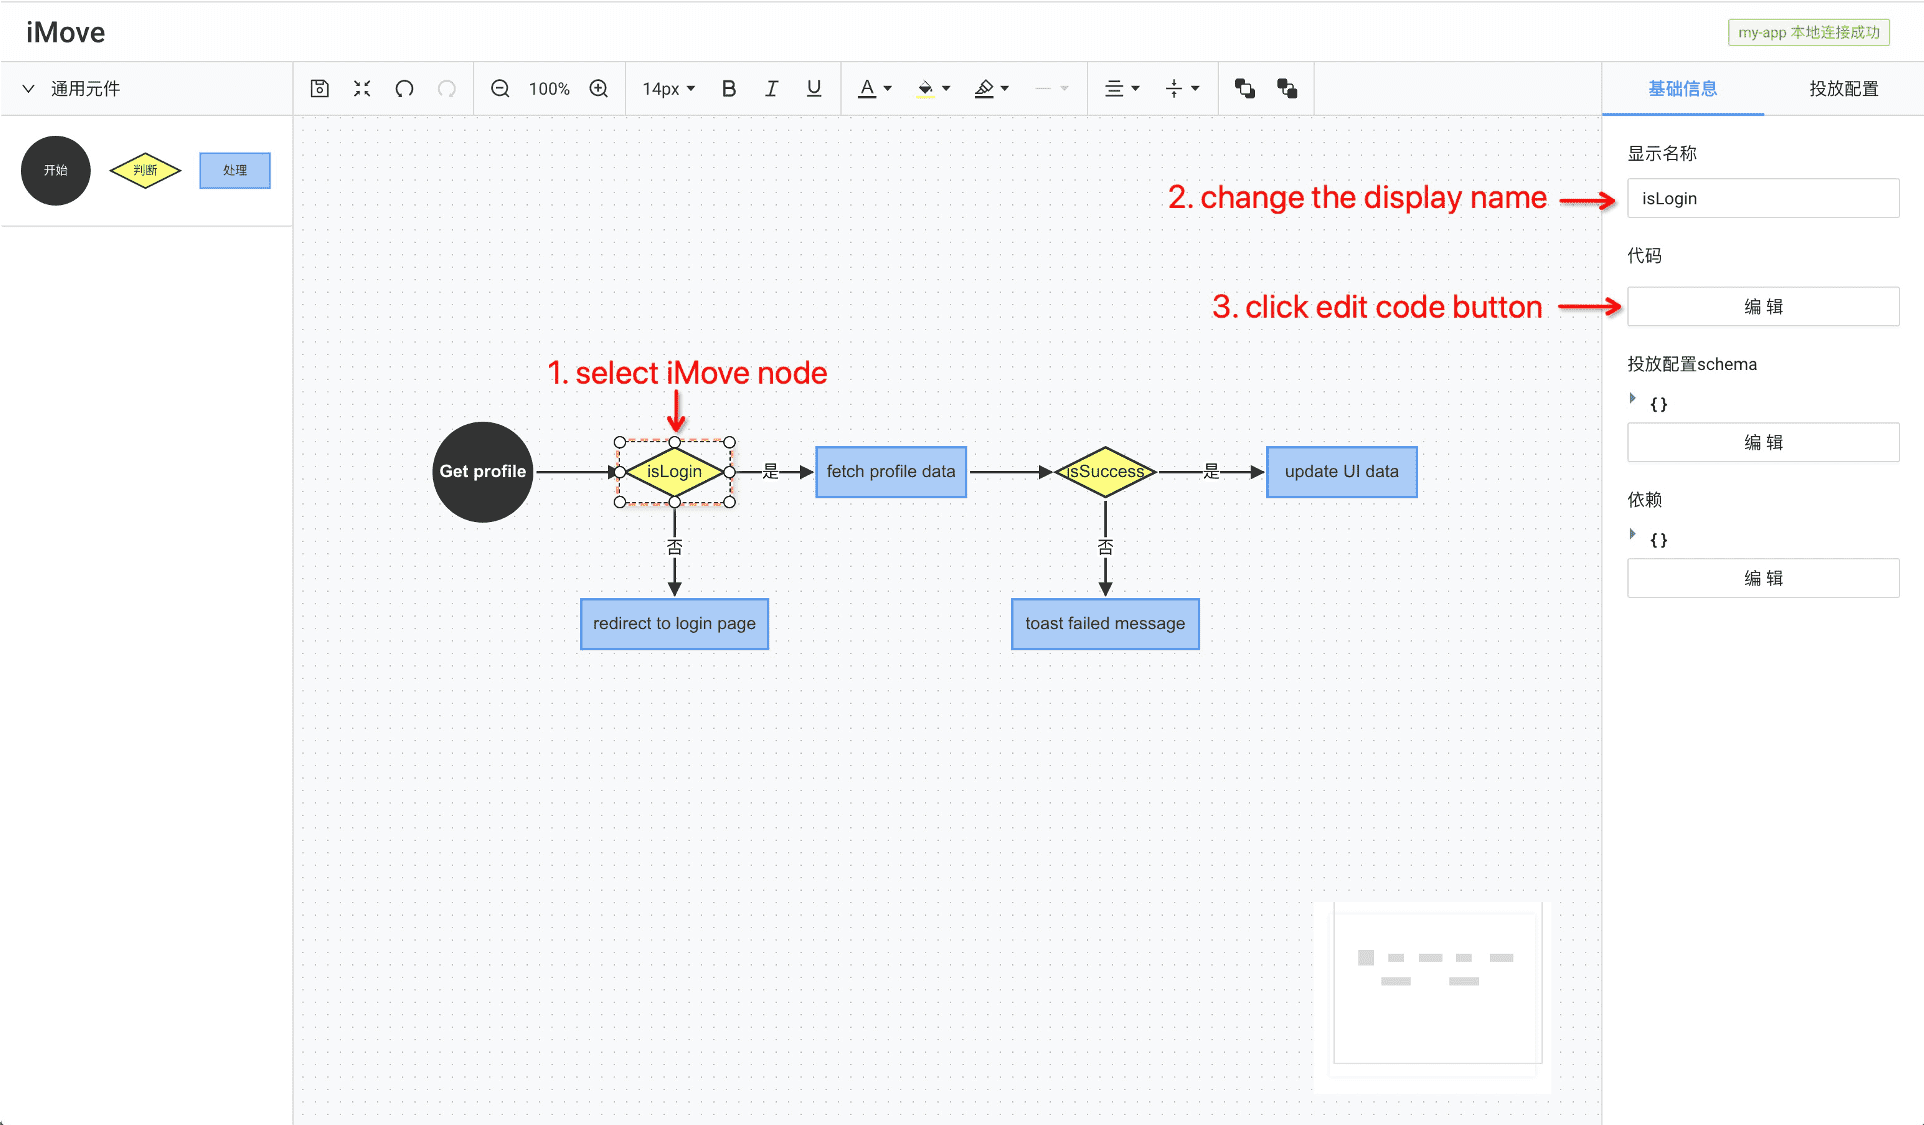
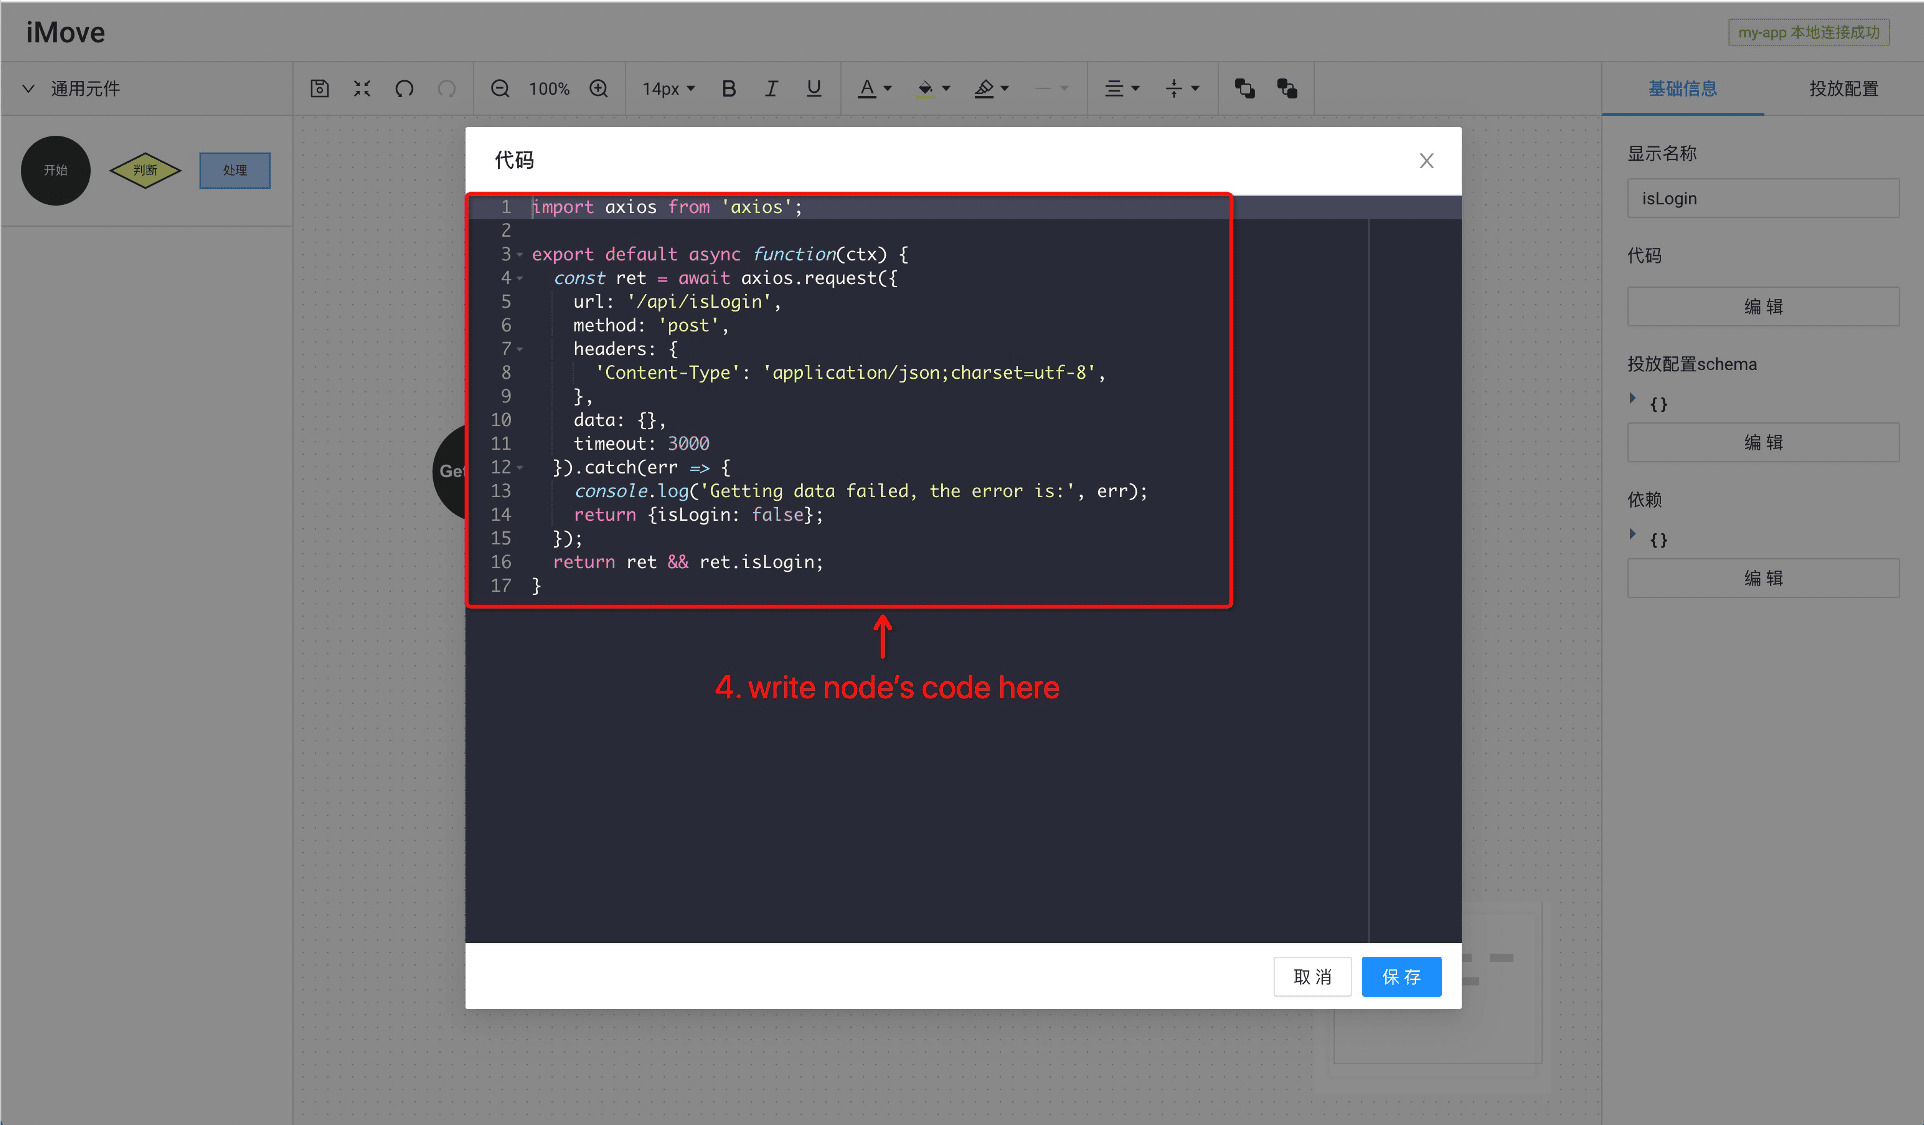
æ¥éª¤ 3. é ç½®èç¹
éæ©èç¹ï¼ä¿®æ¹èç¹åï¼ç¼è¾èç¹ä»£ç


Authors
- qilei0529 - é£ç¾½ãLeaderã
- SmallStoneSK - è竹ãCore Teamã
- suanmei - æ¾éãCore Teamã
- iloveyou11 - å·åãCore Teamã
- i5ting - ç¼åãCore Teamã
å¢éå客ï¼åç§åçï¼è®¾è®¡åè¡·ï¼å®ç°ï¼æèçé½å¨è¿éï¼ https://www.yuque.com/imove/blog
See also the list of contributors who participated in this project.
è´¡ç®
- Fork ä»åº
- å建åæ¯ (
git checkout -b my-new-feature) - æäº¤ä¿®æ¹ (
git commit -am 'Add some feature') - æ¨é (
git push origin my-new-feature) - å建 PR
æ¬¢è¿ fork ååé¦
å¦æ建议ææè§ï¼æ¬¢è¿å¨ github issues åºæé®
åè®®
æ¬ä»åºéµå¾ª MIT åè®®
è´¡ç®è â¨
æè°¢ èè X6 å¢é æä¾çç»å¾å¼æ
æè°¢ææè´¡ç®ç人 (emoji key):
æ¬ä»åºéµå¾ª all-contributors è§èï¼æ¬¢è¿è´¡ç®!
é¡¹ç® Star æ°å¢é¿è¶å¿
Top Related Projects
🦋Butterfly,A JavaScript/React/Vue2 Diagramming library which concentrate on flow layout field. (基于JavaScript/React/Vue2的流程图组件)
🚀 JavaScript diagramming library that uses SVG and HTML for rendering.
mxGraph is a fully client side JavaScript diagramming library
a super simple, no-nonsense diagramming library written in react that just works
JavaScript framework for visual programming
A BPMN 2.0 rendering toolkit and web modeler.
Convert  designs to code with AI

Introducing Visual Copilot: A new AI model to turn Figma designs to high quality code using your components.
Try Visual Copilot


