 django-debug-toolbar
A configurable set of panels that display various debug information about the current request/response.
Top Related Projects

Silky smooth profiling for Django
Pipeline is an asset packaging library for Django.

Compresses linked and inline javascript or CSS into a single cached file.
Quick Overview
Django Debug Toolbar is a powerful and configurable set of panels that display various debug information about the current request/response cycle in Django applications. It provides insights into database queries, templates, HTTP headers, and more, making it an essential tool for Django developers during the development process.
Pros
- Comprehensive debug information in a user-friendly interface
- Easy to install and configure
- Highly customizable with the ability to add custom panels
- Minimal impact on application performance when not in debug mode
Cons
- Can slightly slow down page load times when active
- May expose sensitive information if accidentally left enabled in production
- Requires additional configuration for some features (e.g., profiling)
- Limited usefulness in API-only Django applications
Code Examples
- Basic installation and configuration:
# settings.py
INSTALLED_APPS = [
    # ...
    'debug_toolbar',
]

MIDDLEWARE = [
    # ...
    'debug_toolbar.middleware.DebugToolbarMiddleware',
]

INTERNAL_IPS = [
    '127.0.0.1',
]
- Adding a custom panel:
from debug_toolbar.panels import Panel

class CustomPanel(Panel):
    name = 'Custom'
    template = 'custom_panel.html'

    def generate_stats(self, request, response):
        self.record_stats({'key': 'value'})

# In settings.py
DEBUG_TOOLBAR_PANELS = [
    # ...
    'path.to.CustomPanel',
]
- Configuring SQL query highlighting:
# settings.py
DEBUG_TOOLBAR_CONFIG = {
    'SHOW_TOOLBAR_CALLBACK': lambda request: True,
    'SQL_WARNING_THRESHOLD': 100,  # ms
}
Getting Started
-
Install Django Debug Toolbar:
pip install django-debug-toolbar -
Add to
INSTALLED_APPSandMIDDLEWAREinsettings.py:INSTALLED_APPS = [ # ... 'debug_toolbar', ] MIDDLEWARE = [ # ... 'debug_toolbar.middleware.DebugToolbarMiddleware', ] -
Configure
INTERNAL_IPSinsettings.py:INTERNAL_IPS = [ '127.0.0.1', ] -
Add Debug Toolbar URLs to your
urls.py:from django.urls import include, path urlpatterns = [ # ... path('__debug__/', include('debug_toolbar.urls')), ] -
Run your Django server and access your site. The Debug Toolbar should appear on the right side of the page.
Competitor Comparisons
Silky smooth profiling for Django
Pros of django-silk
- Provides more detailed profiling information, including SQL queries and time spent on each query
- Offers a sleek and modern UI for analyzing performance data
- Allows for saving and comparing request data across multiple runs
Cons of django-silk
- Can have a higher performance overhead compared to django-debug-toolbar
- Requires more setup and configuration to get started
- May be overkill for simpler projects or quick debugging sessions
Code Comparison
django-silk:
from silk.profiling.profiler import silk_profile
@silk_profile(name='View Blog Post')
def view_blog_post(request, post_id):
# View logic here
django-debug-toolbar:
from debug_toolbar.decorators import require_debug_toolbar
@require_debug_toolbar
def view_blog_post(request, post_id):
# View logic here
Both tools offer valuable insights for Django developers, with django-silk providing more in-depth profiling capabilities at the cost of increased complexity and potential performance impact. django-debug-toolbar, on the other hand, offers a simpler setup and lighter footprint, making it suitable for quick debugging and general development work. The choice between the two depends on the specific needs of the project and the level of detail required in performance analysis.
Pipeline is an asset packaging library for Django.
Pros of django-pipeline
- Focuses on asset management and optimization, improving site performance
- Provides advanced features like CSS/JS compression and versioning
- Offers more flexibility in managing static files across multiple apps
Cons of django-pipeline
- Steeper learning curve compared to django-debug-toolbar
- Requires more configuration and setup
- May introduce complexity for smaller projects that don't need advanced asset management
Code Comparison
django-pipeline:
PIPELINE = {
'STYLESHEETS': {
'colors': {
'source_filenames': (
'css/core.css',
'css/colors/*.css',
'css/layers.css'
),
'output_filename': 'css/colors.css',
},
},
}
django-debug-toolbar:
INSTALLED_APPS = [
    # ...
    'debug_toolbar',
]

MIDDLEWARE = [
    # ...
    'debug_toolbar.middleware.DebugToolbarMiddleware',
]
Summary
While django-debug-toolbar focuses on debugging and profiling during development, django-pipeline is geared towards optimizing and managing static assets for production. django-pipeline offers more advanced features for asset management but requires more setup, while django-debug-toolbar provides an easy-to-use interface for debugging with minimal configuration.
Compresses linked and inline javascript or CSS into a single cached file.
Pros of django-compressor
- Focuses on optimizing static assets (CSS, JavaScript) for improved performance
- Supports various compression and minification methods
- Can combine multiple files into a single compressed file, reducing HTTP requests
Cons of django-compressor
- Limited to static asset optimization, not a general debugging tool
- Requires additional configuration for complex setups
- May introduce complexity in development environments
Code Comparison
django-compressor:
{% load compress %}
{% compress js %}
<script src="{% static 'js/file1.js' %}"></script>
<script src="{% static 'js/file2.js' %}"></script>
{% endcompress %}
django-debug-toolbar:
INSTALLED_APPS = [
    # ...
    'debug_toolbar',
]

MIDDLEWARE = [
    # ...
    'debug_toolbar.middleware.DebugToolbarMiddleware',
]
Summary
django-compressor is specialized for optimizing static assets, improving website performance by compressing and combining files. It's particularly useful for production environments but may require additional setup.
django-debug-toolbar, on the other hand, is a comprehensive debugging tool that provides insights into various aspects of a Django application, including database queries, templates, and HTTP headers. It's primarily used during development to identify and resolve performance issues.
While both tools can contribute to improving a Django application's performance, they serve different purposes and are often used in conjunction for a well-rounded development and optimization process.
Convert  designs to code with AI

Introducing Visual Copilot: A new AI model to turn Figma designs to high quality code using your components.
Try Visual CopilotREADME
===================================== Django Debug Toolbar |latest-version|
|build-status| |coverage| |docs| |python-support| |django-support|
.. |latest-version| image:: https://img.shields.io/pypi/v/django-debug-toolbar.svg :target: https://pypi.org/project/django-debug-toolbar/ :alt: Latest version on PyPI
.. |build-status| image:: https://github.com/django-commons/django-debug-toolbar/workflows/Test/badge.svg :target: https://github.com/django-commons/django-debug-toolbar/actions/workflows/test.yml :alt: Build Status
.. |coverage| image:: https://img.shields.io/badge/Coverage-94%25-green :target: https://github.com/django-commons/django-debug-toolbar/actions/workflows/test.yml?query=branch%3Amain :alt: Test coverage status
.. |docs| image:: https://img.shields.io/readthedocs/django-debug-toolbar/latest.svg :target: https://readthedocs.org/projects/django-debug-toolbar/ :alt: Documentation status
.. |python-support| image:: https://img.shields.io/pypi/pyversions/django-debug-toolbar :target: https://pypi.org/project/django-debug-toolbar/ :alt: Supported Python versions
.. |django-support| image:: https://img.shields.io/pypi/djversions/django-debug-toolbar :target: https://pypi.org/project/django-debug-toolbar/ :alt: Supported Django versions
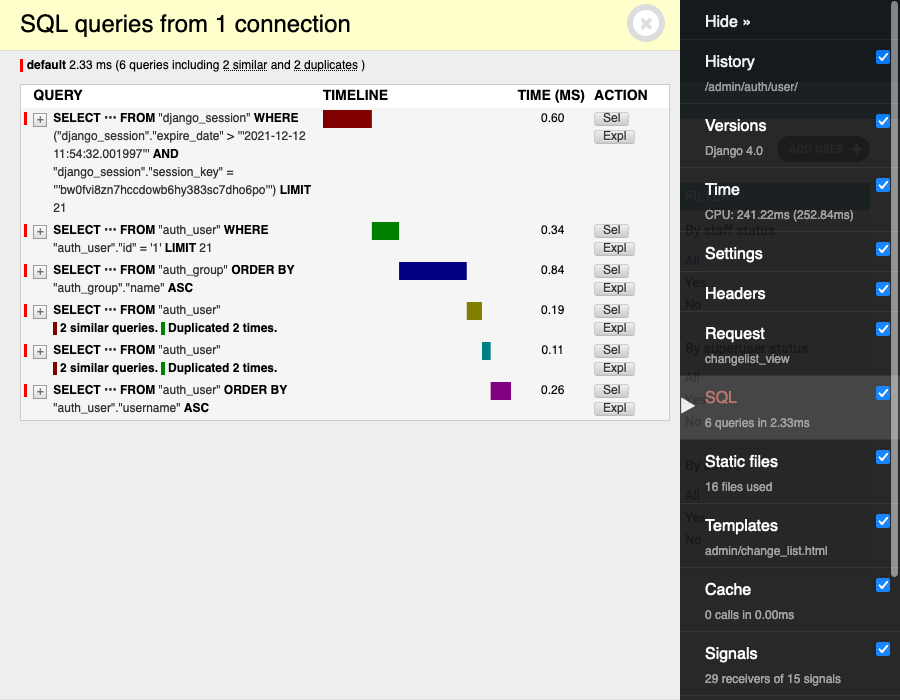
The Django Debug Toolbar is a configurable set of panels that display various debug information about the current request/response and when clicked, display more details about the panel's content.
Here's a screenshot of the toolbar in action:
.. image:: https://raw.github.com/django-commons/django-debug-toolbar/main/example/django-debug-toolbar.png :alt: Django Debug Toolbar screenshot
In addition to the built-in panels, a number of third-party panels are contributed by the community.
The current stable version of the Debug Toolbar is 5.2.0. It works on Django ⥠4.2.0.
The Debug Toolbar has experimental support for Django's asynchronous views <https://docs.djangoproject.com/en/dev/topics/async/>. Please note that
the Debug Toolbar still lacks the capability for handling concurrent requests.
If you find any issues, please report them on the issue tracker.
Documentation, including installation and configuration instructions, is available at https://django-debug-toolbar.readthedocs.io/.
The Django Debug Toolbar is released under the BSD license, like Django itself. If you like it, please consider contributing!
The Django Debug Toolbar was originally created by Rob Hudson rob@cogit8.org in August 2008 and was further developed by many contributors_.
.. _contributors: https://github.com/django-commons/django-debug-toolbar/graphs/contributors .. _issue tracker: https://github.com/django-commons/django-debug-toolbar/issues
Top Related Projects
Silky smooth profiling for Django
Pipeline is an asset packaging library for Django.
Compresses linked and inline javascript or CSS into a single cached file.
Convert designs to code with AI
Introducing Visual Copilot: A new AI model to turn Figma designs to high quality code using your components.
Try Visual Copilot