
Top Related Projects

Interactive, thoroughly customizable maps in the browser, powered by vector tiles and WebGL

OpenLayers

🍃 JavaScript library for mobile-friendly interactive maps 🇺🇦

WebGL2 powered visualization framework

An open-source JavaScript library for world-class 3D globes and maps :earth_americas:

Vector and raster maps with GL styles. Server side rendering by MapLibre GL Native. Map tile server for MapLibre GL JS, Android, iOS, Leaflet, OpenLayers, GIS via WMTS, etc.
Quick Overview
MapLibre GL JS is an open-source JavaScript library for interactive, customizable vector maps. It's a community-led fork of Mapbox GL JS, providing a free and open alternative for developers to create high-performance maps in web and mobile applications.
Pros
- Free and open-source, with no usage restrictions or API keys required
- High-performance vector rendering and smooth interactions
- Extensive customization options for map styles and features
- Active community development and regular updates
Cons
- Less extensive documentation compared to proprietary alternatives
- Smaller ecosystem of plugins and extensions
- May require more setup and configuration for advanced features
- Limited built-in data sources compared to some commercial offerings
Code Examples
- Creating a basic map:
import maplibregl from 'maplibre-gl';

const map = new maplibregl.Map({
  container: 'map',
  style: 'https://demotiles.maplibre.org/style.json',
  center: [-74.5, 40],
  zoom: 9
});
- Adding a marker to the map:
const marker = new maplibregl.Marker()
  .setLngLat([-74.5, 40])
  .addTo(map);
- Changing the map style:
map.setStyle('https://your-custom-style-url.json');
- Adding a popup:
const popup = new maplibregl.Popup()
  .setLngLat([-74.5, 40])
  .setHTML('<h3>Hello MapLibre!</h3>')
  .addTo(map);
Getting Started
- Install MapLibre GL JS:
npm install maplibre-gl
- Include the CSS in your HTML:
<link href='https://unpkg.com/maplibre-gl@latest/dist/maplibre-gl.css' rel='stylesheet' />
- Create a map container in your HTML:
<div id='map' style='width: 400px; height: 300px;'></div>
- Initialize the map in your JavaScript:
import maplibregl from 'maplibre-gl';

const map = new maplibregl.Map({
  container: 'map',
  style: 'https://demotiles.maplibre.org/style.json',
  center: [0, 0],
  zoom: 2
});
Competitor Comparisons
Interactive, thoroughly customizable maps in the browser, powered by vector tiles and WebGL
Pros of mapbox-gl-js
- More extensive documentation and examples
- Advanced features like data-driven styling and 3D terrain rendering
- Regular updates and active development from a dedicated team
Cons of mapbox-gl-js
- Requires a Mapbox access token and has usage limits
- Closed-source license, limiting customization and redistribution
- Potential vendor lock-in due to proprietary features
Code Comparison
mapbox-gl-js:
mapboxgl.accessToken = 'YOUR_MAPBOX_ACCESS_TOKEN';
const map = new mapboxgl.Map({
  container: 'map',
  style: 'mapbox://styles/mapbox/streets-v11',
  center: [-74.5, 40],
  zoom: 9
});
maplibre-gl-js:
const map = new maplibregl.Map({
  container: 'map',
  style: 'https://demotiles.maplibre.org/style.json',
  center: [-74.5, 40],
  zoom: 9
});
The main difference in the code is the absence of an access token requirement in maplibre-gl-js and the use of a different style URL. maplibre-gl-js provides more flexibility in choosing tile sources and styles without being tied to Mapbox's ecosystem.
OpenLayers
Pros of OpenLayers
- More comprehensive and feature-rich, supporting a wider range of map types and data sources
- Better documentation and larger community support
- Easier to customize and extend with a modular architecture
Cons of OpenLayers
- Larger file size and potentially slower performance for simple map applications
- Steeper learning curve due to its extensive API and features
- Less focus on vector tile rendering compared to MapLibre GL JS
Code Comparison
OpenLayers:
import Map from 'ol/Map';
import View from 'ol/View';
import TileLayer from 'ol/layer/Tile';
import OSM from 'ol/source/OSM';

const map = new Map({
  target: 'map',
  layers: [new TileLayer({ source: new OSM() })],
  view: new View({ center: [0, 0], zoom: 2 })
});
MapLibre GL JS:
import maplibregl from 'maplibre-gl';

const map = new maplibregl.Map({
  container: 'map',
  style: 'https://demotiles.maplibre.org/style.json',
  center: [0, 0],
  zoom: 2
});
Both libraries offer powerful mapping capabilities, but OpenLayers provides a more comprehensive set of features at the cost of increased complexity, while MapLibre GL JS focuses on high-performance vector tile rendering with a simpler API.
🍃 JavaScript library for mobile-friendly interactive maps 🇺🇦
Pros of Leaflet
- Lightweight and simple to use, with a gentle learning curve
- Extensive plugin ecosystem for added functionality
- Better support for older browsers and devices
Cons of Leaflet
- Limited built-in support for vector tiles and 3D maps
- Less performant with large datasets compared to WebGL-based libraries
- Fewer advanced styling options out of the box
Code Comparison
Leaflet:
var map = L.map('map').setView([51.505, -0.09], 13);
L.tileLayer('https://{s}.tile.openstreetmap.org/{z}/{x}/{y}.png', {
    attribution: '© OpenStreetMap contributors'
}).addTo(map);
MapLibre GL JS:
var map = new maplibregl.Map({
    container: 'map',
    style: 'https://demotiles.maplibre.org/style.json',
    center: [-0.09, 51.505],
    zoom: 13
});
Both libraries offer straightforward initialization, but MapLibre GL JS provides more advanced rendering capabilities and styling options. Leaflet's syntax is simpler and more intuitive for basic mapping needs, while MapLibre GL JS offers greater flexibility for complex visualizations and interactions.
WebGL2 powered visualization framework
Pros of deck.gl
- Highly customizable and extensible for complex data visualizations
- Supports a wide range of 2D and 3D layer types
- Optimized for rendering large datasets efficiently
Cons of deck.gl
- Steeper learning curve for beginners
- Less focused on traditional map rendering compared to MapLibre GL JS
- May require additional libraries for some map-specific features
Code Comparison
MapLibre GL JS:
const map = new maplibregl.Map({
  container: 'map',
  style: 'https://demotiles.maplibre.org/style.json',
  center: [-74.5, 40],
  zoom: 9
});
deck.gl:
const deckgl = new Deck({
  initialViewState: {
    longitude: -74.5,
    latitude: 40,
    zoom: 9
  },
  layers: [
    new ScatterplotLayer({
      data: [[-74.5, 40]],
      getPosition: d => d,
      getRadius: 1000,
      getFillColor: [255, 0, 0]
    })
  ]
});
MapLibre GL JS is more focused on traditional map rendering with built-in styling and controls, while deck.gl offers greater flexibility for custom data visualizations and layer types. MapLibre GL JS may be easier for beginners, but deck.gl provides more advanced capabilities for complex data representations and 3D visualizations.
An open-source JavaScript library for world-class 3D globes and maps :earth_americas:
Pros of Cesium
- Specializes in 3D geospatial visualization, offering advanced terrain rendering and globe-based mapping
- Supports time-dynamic data and animations, ideal for temporal geospatial analysis
- Includes a comprehensive set of geospatial analysis tools and calculations
Cons of Cesium
- Steeper learning curve due to its focus on 3D and more complex features
- Larger file size and potentially higher resource usage, which may impact performance on less powerful devices
- Less suitable for simple 2D map applications where MapLibre-GL-JS might be more appropriate
Code Comparison
MapLibre-GL-JS (2D map initialization):
const map = new maplibregl.Map({
  container: 'map',
  style: 'https://demotiles.maplibre.org/style.json',
  center: [-74.5, 40],
  zoom: 9
});
Cesium (3D globe initialization):
const viewer = new Cesium.Viewer('cesiumContainer', {
  terrainProvider: Cesium.createWorldTerrain(),
  imageryProvider: Cesium.createWorldImagery()
});
viewer.camera.flyTo({destination: Cesium.Cartesian3.fromDegrees(-74.5, 40, 1000000)});
Vector and raster maps with GL styles. Server side rendering by MapLibre GL Native. Map tile server for MapLibre GL JS, Android, iOS, Leaflet, OpenLayers, GIS via WMTS, etc.
Pros of tileserver-gl
- Focused on serving vector and raster tiles, making it ideal for tile hosting
- Supports multiple data sources and formats out of the box
- Includes a built-in map viewer for easy visualization
Cons of tileserver-gl
- Limited to server-side functionality, lacking client-side rendering capabilities
- Less flexibility for custom styling and interactivity compared to maplibre-gl-js
- Smaller community and fewer extensions available
Code Comparison
maplibre-gl-js (client-side rendering):
const map = new maplibregl.Map({
  container: 'map',
  style: 'https://demotiles.maplibre.org/style.json',
  center: [-74.5, 40],
  zoom: 9
});
tileserver-gl (server configuration):
module.exports = {
  styles: {
    'osm-bright': {
      style: 'osm-bright/style.json',
      tilejson: {
        bounds: [-180, -85.0511, 180, 85.0511]
      }
    }
  }
};
While maplibre-gl-js focuses on client-side rendering and interactivity, tileserver-gl is designed for efficient tile serving. maplibre-gl-js offers more flexibility for custom map applications, while tileserver-gl excels in providing a straightforward solution for hosting and serving map tiles.
Convert  designs to code with AI

Introducing Visual Copilot: A new AI model to turn Figma designs to high quality code using your components.
Try Visual CopilotREADME
MapLibre GL JS
![]()

![]()
![]()
![]()
MapLibre GL JS is an open-source library for publishing maps on your websites or webview based apps. Fast displaying of maps is possible thanks to GPU-accelerated vector tile rendering.
It originated as an open-source fork of mapbox-gl-js, before their switch to a non-OSS license in December 2020. The library's initial versions (1.x) were intended to be a drop-in replacement for the Mapboxâs OSS version (1.x) with additional functionality, but have evolved a lot since then.
Getting Started
Include the JavaScript and CSS files in the <head> of your HTML file.
<script src='https://unpkg.com/maplibre-gl@latest/dist/maplibre-gl.js'></script>
<link href='https://unpkg.com/maplibre-gl@latest/dist/maplibre-gl.css' rel='stylesheet' />
Include the following code in the <body> of your HTML file.
<div id='map' style='width: 400px; height: 300px;'></div>
<script>
var map = new maplibregl.Map({
  container: 'map',
  style: 'https://demotiles.maplibre.org/style.json', // stylesheet location
  center: [-74.5, 40], // starting position [lng, lat]
  zoom: 9 // starting zoom
});
</script>
Enjoy the map!
Documentation
Full documentation for this library is available here.
Check out the features through examples.
| Showcases | |
|---|---|
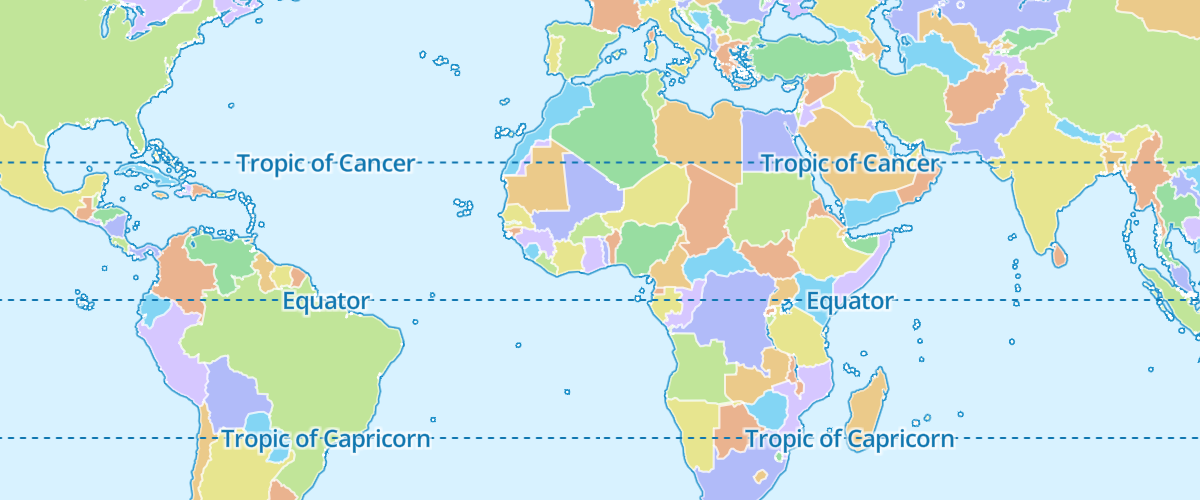 | 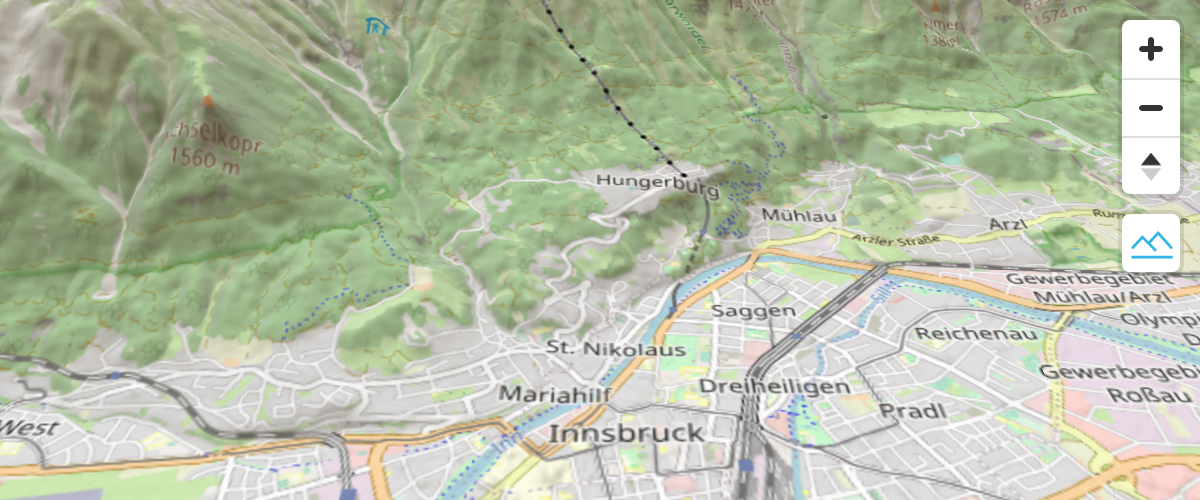 |
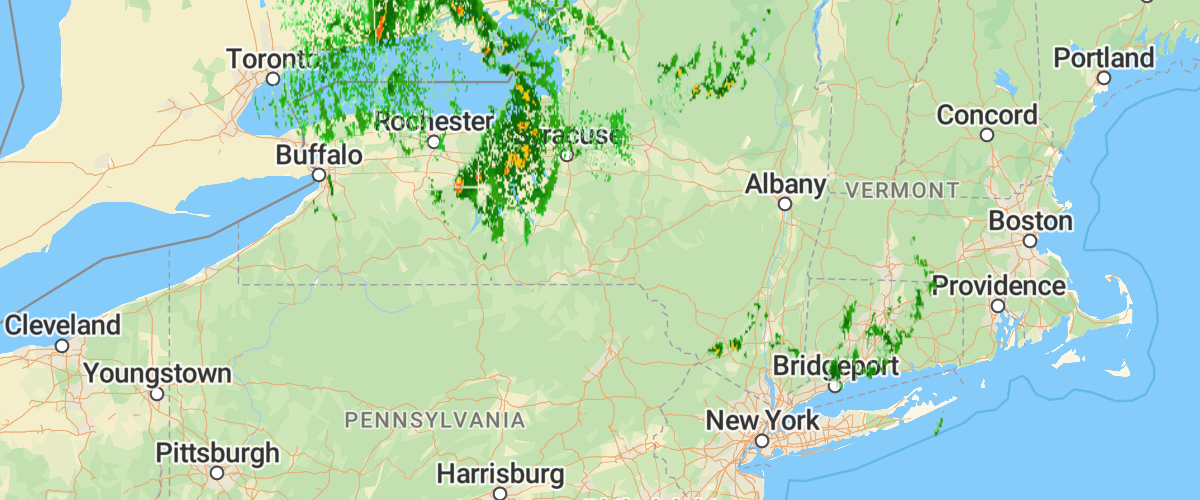 | 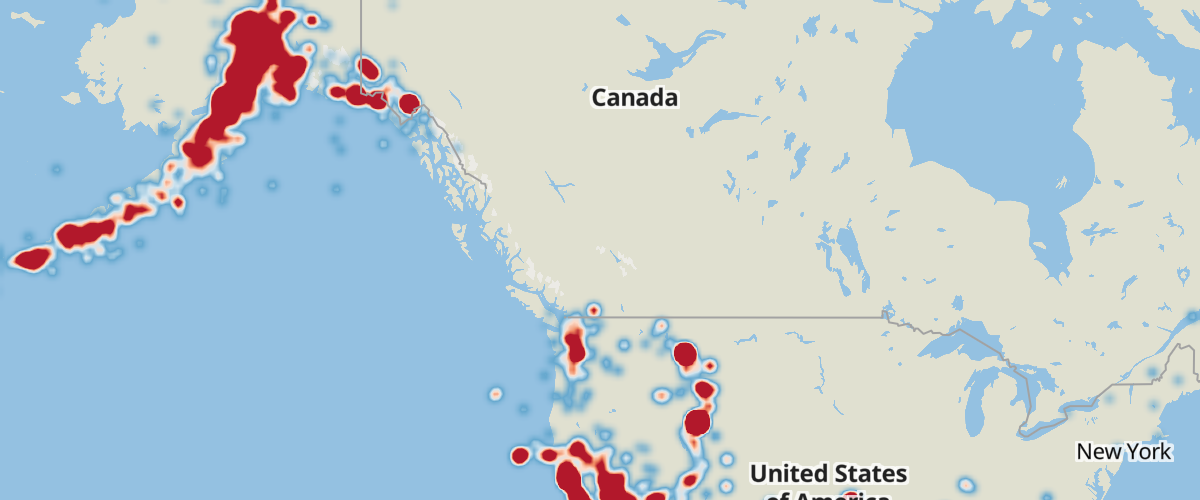 |
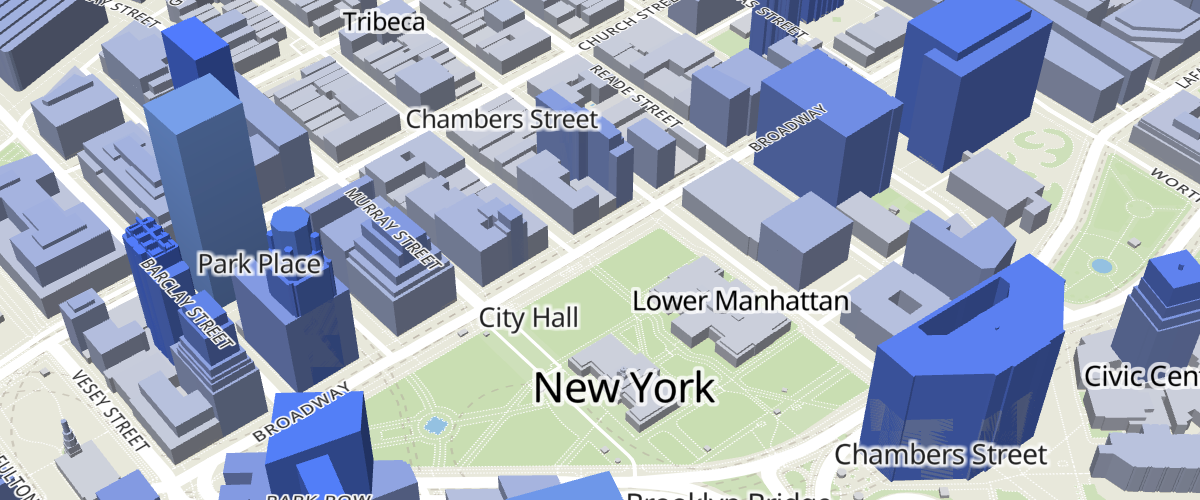 | 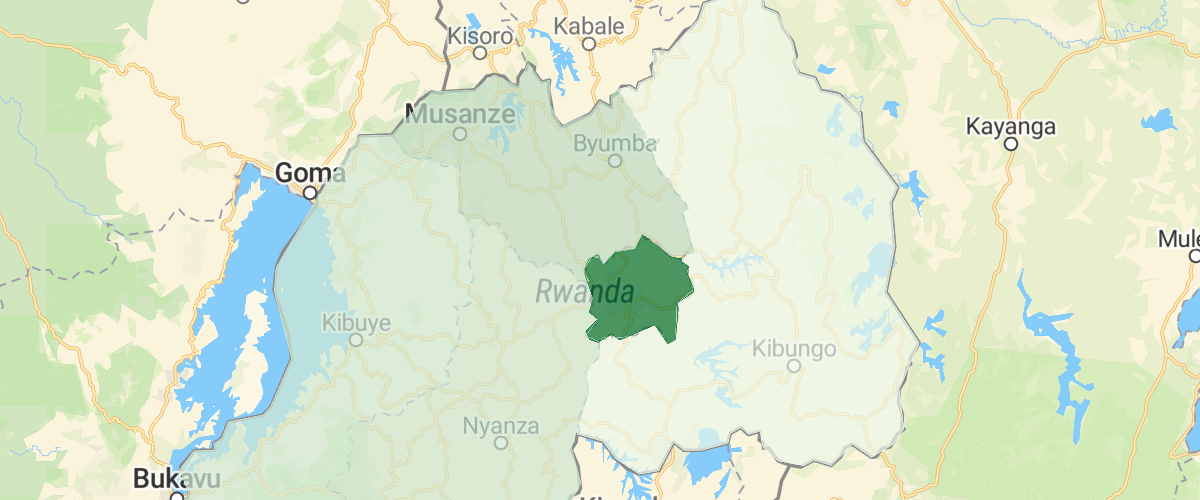 |
Want an example? Have a look at the official MapLibre GL JS Documentation.
Use MapLibre GL JS bindings for React and Angular. Find more at awesome-maplibre.
Contribution
Getting Involved
Join the #maplibre slack channel at OSMUS: get an invite at https://slack.openstreetmap.us/ Read the CONTRIBUTING.md guide in order to get familiar with how we do things around here.
Avoid Fragmentation
If you depend on a free software alternative to mapbox-gl-js, please consider joining our effort! Anyone with a stake in a healthy community-led fork is welcome to help us figure out our next steps. We welcome contributors and leaders! MapLibre GL JS already represents the combined efforts of a few early fork efforts, and we all benefit from "one project" rather than "our way". If you know of other forks, please reach out to them and direct them here.
MapLibre GL JS is developed following Semantic Versioning (2.0.0).
Bounties
We offer Bounties for some tasks in the MapLibre GL JS repo. Read more about the Bounties in our step-by-step guide:
https://maplibre.org/roadmap/step-by-step-bounties-guide/
And find all currently published Bounties in MapLibre GL JS here.
Sponsors
We thank everyone who supported us financially in the past and special thanks to the people and organizations who support us with recurring donations!
Read more about the MapLibre Sponsorship Program at https://maplibre.org/sponsors/.
Gold:
![]()
![]()
Silver:
![]()
![]()
![]()
![]()
![]()
![]()
![]()
![]()
Backers and Supporters:
![]()
![]()
![]()
![]()
![]()
![]()
![]()
![]()
![]()
![]()
![]()
![]()
![]()
![]()
![]()
![]()
![]()
![]()
![]()
![]()
![]()
![]()
![]()
![]()
![]()
![]()
![]()
![]()
![]()
![]()
![]()
Thank you Mapbox ðð½
We'd like to acknowledge the amazing work Mapbox has contributed to open source. The open source community is sad to part ways with them, but we simultaneously feel grateful for everything they already contributed. mapbox-gl-js 1.x is an open source achievement that now lives on as maplibre-gl. We're proud to develop on the shoulders of giants, thank you Mapbox ðð½ââï¸.
Please keep in mind: Unauthorized backports are the biggest threat to the MapLibre project. It is unacceptable to backport code from mapbox-gl-js, which is not covered by the former BSD-3 license. If you are unsure about this issue, please ask!
License
MapLibre GL JS is licensed under the 3-Clause BSD license.
Top Related Projects
Interactive, thoroughly customizable maps in the browser, powered by vector tiles and WebGL
OpenLayers
🍃 JavaScript library for mobile-friendly interactive maps 🇺🇦
WebGL2 powered visualization framework
An open-source JavaScript library for world-class 3D globes and maps :earth_americas:
Vector and raster maps with GL styles. Server side rendering by MapLibre GL Native. Map tile server for MapLibre GL JS, Android, iOS, Leaflet, OpenLayers, GIS via WMTS, etc.
Convert designs to code with AI
Introducing Visual Copilot: A new AI model to turn Figma designs to high quality code using your components.
Try Visual Copilot