 QGIS
QGIS
QGIS is a free, open source, cross platform (lin/win/mac) geographical information system (GIS)
Top Related Projects
GDAL is an open source MIT licensed translator library for raster and vector geospatial data formats.
Interactive, thoroughly customizable maps in the browser, powered by vector tiles and WebGL
🍃 JavaScript library for mobile-friendly interactive maps 🇺🇦
Official GeoTools repository
🆔 The easy-to-use OpenStreetMap editor in JavaScript.
Source code of the MapServer project. Please submit pull requests to the 'main' branch.
Quick Overview
QGIS is a free and open-source Geographic Information System (GIS) software that allows users to create, edit, visualize, analyze, and publish geospatial information. It supports a wide variety of vector and raster data formats and provides a comprehensive set of tools for data manipulation, analysis, and cartography.
Pros
- Extensive functionality comparable to commercial GIS software
- Large and active community providing support and developing plugins
- Cross-platform compatibility (Windows, macOS, Linux)
- Regular updates and improvements
Cons
- Steeper learning curve compared to some commercial GIS software
- Performance can be slower with large datasets
- Some advanced features may require additional plugins
- Documentation can be inconsistent or outdated in some areas
Getting Started
To get started with QGIS:
- Download and install QGIS from the official website: https://qgis.org/en/site/forusers/download.html
- Launch QGIS and create a new project
- Add data layers:
- Vector: Layer > Add Layer > Add Vector Layer
- Raster: Layer > Add Layer > Add Raster Layer
- Explore the various tools and plugins available in the interface
- For more detailed instructions, refer to the QGIS User Guide: https://docs.qgis.org/3.16/en/docs/user_manual/
Note: QGIS is not a code library, so code examples are not applicable. However, it does support Python scripting for automation and custom tool development.
Competitor Comparisons
GDAL is an open source MIT licensed translator library for raster and vector geospatial data formats.
Pros of GDAL
- Focused library for geospatial data processing and translation
- Supports a wider range of geospatial data formats
- Lightweight and can be easily integrated into other applications
Cons of GDAL
- Command-line interface may be less user-friendly for non-technical users
- Lacks built-in visualization capabilities
- Requires more programming knowledge to utilize effectively
Code Comparison
GDAL (Python bindings):
from osgeo import gdal
dataset = gdal.Open("example.tif")
band = dataset.GetRasterBand(1)
data = band.ReadAsArray()
QGIS (Python console):
layer = QgsRasterLayer("example.tif", "raster")
if layer.isValid():
    QgsProject.instance().addMapLayer(layer)
GDAL focuses on data processing and manipulation, while QGIS provides a comprehensive GIS environment with visualization and analysis tools. GDAL is often used as a backend library for other GIS software, including QGIS. QGIS offers a user-friendly GUI and extensive plugin ecosystem, making it more accessible for general users. However, GDAL's specialized nature makes it more efficient for specific geospatial data tasks and integration into custom workflows.
Interactive, thoroughly customizable maps in the browser, powered by vector tiles and WebGL
Pros of Mapbox GL JS
- Lightweight and optimized for web-based mapping applications
- Extensive documentation and examples for quick implementation
- Seamless integration with other web technologies and frameworks
Cons of Mapbox GL JS
- Limited offline capabilities compared to QGIS
- Less comprehensive geospatial analysis tools
- Requires an internet connection for optimal performance
Code Comparison
QGIS (Python):
layer = QgsVectorLayer("path/to/shapefile.shp", "layer_name", "ogr")
if not layer.isValid():
    print("Layer failed to load!")
QgsProject.instance().addMapLayer(layer)
Mapbox GL JS (JavaScript):
mapboxgl.accessToken = 'YOUR_ACCESS_TOKEN';
const map = new mapboxgl.Map({
    container: 'map',
    style: 'mapbox://styles/mapbox/streets-v11',
    center: [-74.5, 40],
    zoom: 9
});
Both QGIS and Mapbox GL JS are powerful mapping tools, but they serve different purposes. QGIS is a comprehensive desktop GIS application suitable for complex geospatial analysis and data manipulation. Mapbox GL JS, on the other hand, is a lightweight JavaScript library designed for creating interactive web maps with smooth rendering and customizable styles. While QGIS offers more advanced GIS capabilities, Mapbox GL JS excels in web-based mapping and integration with modern web development workflows.
🍃 JavaScript library for mobile-friendly interactive maps 🇺🇦
Pros of Leaflet
- Lightweight and fast, ideal for web-based mapping applications
- Easy to learn and use, with simple API and extensive documentation
- Highly customizable with a large ecosystem of plugins
Cons of Leaflet
- Limited built-in functionality compared to QGIS's comprehensive toolset
- Less suitable for complex geospatial analysis and data processing
- Primarily focused on web-based applications, while QGIS offers desktop and server solutions
Code Comparison
Leaflet (JavaScript):
var map = L.map('map').setView([51.505, -0.09], 13);
L.tileLayer('https://{s}.tile.openstreetmap.org/{z}/{x}/{y}.png').addTo(map);
L.marker([51.5, -0.09]).addTo(map).bindPopup('A sample marker.');
QGIS (Python):
layer = QgsVectorLayer("Point", "sample", "memory")
provider = layer.dataProvider()
feature = QgsFeature()
feature.setGeometry(QgsGeometry.fromPointXY(QgsPointXY(0, 0)))
provider.addFeature(feature)
QgsProject.instance().addMapLayer(layer)
Official GeoTools repository
Pros of GeoTools
- Java-based library, offering strong typing and extensive ecosystem
- Modular architecture allows for selective use of components
- Extensive support for OGC standards and various geospatial data formats
Cons of GeoTools
- Steeper learning curve compared to QGIS's user-friendly interface
- Lacks built-in GUI, requiring additional effort for visualization
- More complex setup and configuration process
Code Comparison
QGIS (Python):
layer = QgsVectorLayer("path/to/shapefile.shp", "layer_name", "ogr")
if not layer.isValid():
    print("Layer failed to load!")
QgsProject.instance().addMapLayer(layer)
GeoTools (Java):
File file = new File("path/to/shapefile.shp");
Map<String, Object> map = new HashMap<>();
map.put("url", file.toURI().toURL());
DataStore dataStore = DataStoreFinder.getDataStore(map);
SimpleFeatureSource featureSource = dataStore.getFeatureSource("layer_name");
Both examples demonstrate loading a shapefile, but QGIS offers a more concise approach with its built-in GUI support, while GeoTools provides more granular control over the process.
🆔 The easy-to-use OpenStreetMap editor in JavaScript.
Pros of iD
- Lightweight and web-based, making it easily accessible for quick edits
- Focused specifically on OpenStreetMap editing, providing a streamlined experience
- User-friendly interface, suitable for beginners and casual mappers
Cons of iD
- Limited functionality compared to QGIS's extensive geospatial analysis tools
- Less suitable for complex GIS projects or advanced data manipulation
- Lacks support for various data formats and advanced cartography features
Code Comparison
iD (JavaScript):
iD.osmNode = function(attrs) {
    return {
        type: 'node',
        id: attrs.id,
        loc: attrs.loc || [0, 0],
        tags: attrs.tags || {}
    };
};
QGIS (Python):
def create_point_feature(x, y, attributes):
    feature = QgsFeature()
    point = QgsPointXY(x, y)
    feature.setGeometry(QgsGeometry.fromPointXY(point))
    feature.setAttributes(attributes)
    return feature
Both examples demonstrate creating basic geometric features, but QGIS offers more complex functionality for advanced GIS operations.
Source code of the MapServer project. Please submit pull requests to the 'main' branch.
Pros of MapServer
- Lightweight and faster performance for web mapping applications
- Better suited for large-scale, high-performance mapping services
- More flexible for custom map styling and symbology through MapFiles
Cons of MapServer
- Steeper learning curve, especially for beginners
- Less comprehensive GUI tools for map creation and data management
- More limited in terms of data analysis and processing capabilities
Code Comparison
MapServer (MapFile example):
MAP
  NAME "My Map"
  SIZE 600 400
  EXTENT -180 -90 180 90
  LAYER
    NAME "countries"
    TYPE POLYGON
    DATA "countries.shp"
    CLASS
      STYLE
        COLOR 200 200 200
        OUTLINECOLOR 0 0 0
      END
    END
  END
END
QGIS (Python API example):
layer = QgsVectorLayer("countries.shp", "Countries", "ogr")
symbol = QgsFillSymbol.createSimple({'color': '200,200,200', 'outline_color': '0,0,0'})
layer.renderer().setSymbol(symbol)
QgsProject.instance().addMapLayer(layer)
Both repositories offer powerful mapping capabilities, but cater to different use cases. MapServer is more focused on web mapping and high-performance scenarios, while QGIS provides a more comprehensive desktop GIS solution with extensive analysis tools and a user-friendly interface.
Convert  designs to code with AI

Introducing Visual Copilot: A new AI model to turn Figma designs to high quality code using your components.
Try Visual CopilotREADME

QGIS is a full-featured, user-friendly, free-and-open-source (FOSS) geographical information system (GIS) that runs on Unix platforms, Windows, and MacOS.
Features
1. Flexible and powerful spatial data management
- Support for raster, vector, mesh, and point cloud data in a range of industry-standard formats
- Raster formats include: GeoPackage, GeoTIFF, GRASS, ArcInfo binary and ASCII grids, ERDAS Imagine SDTS, WMS, WCS, PostgreSQL/PostGIS, and other GDAL supported formats.
- Vector formats include: GeoPackage, ESRI shapefiles, GRASS, SpatiaLite, PostgreSQL/PostGIS, MSSQL, Oracle, WFS, Vector Tiles and other OGR supported formats.
- Mesh formats include: NetCDF, GRIB, 2DM, and other MDAL supported formats.
- Point-cloud format: LAS/LAZ and EPT datasets.
- Data abstraction framework, with local files, spatial databases (PostGIS, SpatiaLite, SQL Server, Oracle, SAP HANA), and web services (WMS, WCS, WFS, ArcGIS REST) all accessed through a unified data model and browser interface, and as flexible layers in user-created projects
- Spatial data creation via visual and numerical digitizing and editing, as well as georeferencing of raster and vector data
- On-the-fly reprojection between coordinate reference systems (CRS)
- Nominatim (OpenStreetMap) geocoder access
- Temporal support
Example: Temporal animation

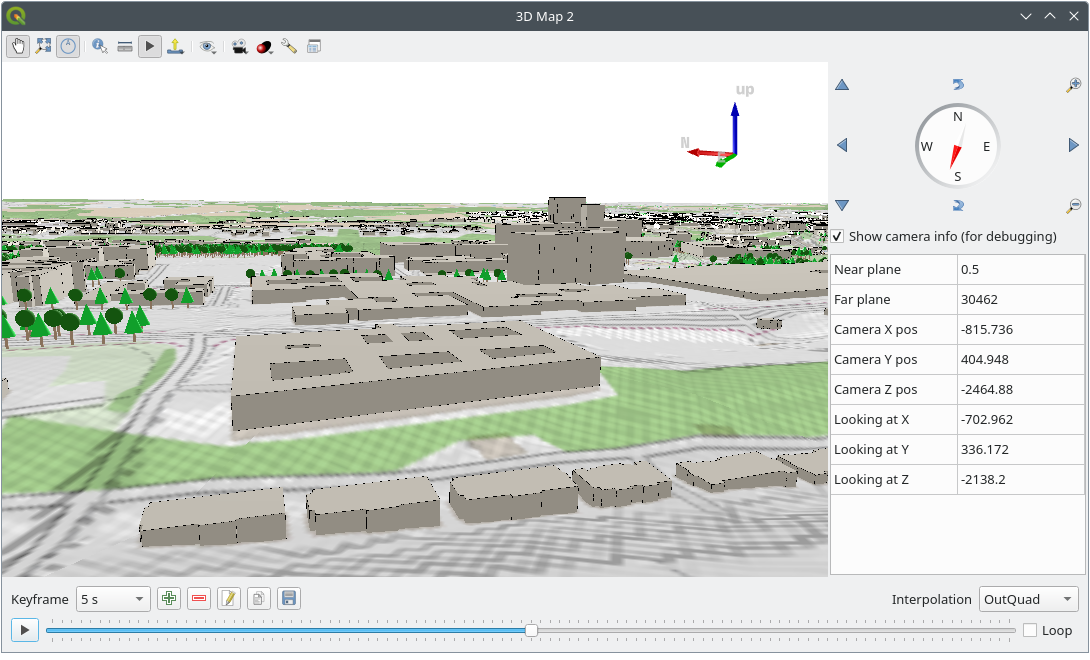
Example: 3D map view
2. Beautiful cartography
- Large variety of rendering options in 2D and 3D
- Fine control over symbology, labeling, legends and additional graphical elements for beautifully rendered maps
- Respect for embedded styling in many spatial data sources (e.g. KML and TAB files, Mapbox-GL styled vector tiles)
- In particular, near-complete replication (and significant extension) of symbology options that are available in proprietary software by ESRI
- Advanced styling using data-defined overrides, blending modes, and draw effects
- 500+ built-in color ramps (cpt-city, ColorBrewer, etc.)
- Create and update maps with specified scale, extent, style, and decorations via saved layouts
- Generate multiple maps (and reports) automatically using QGIS Atlas and QGIS Reports
- Display and export elevation profile plots with flexible symbology
- Flexible output direct to printer, or as image (raster), PDF, or SVG for further customization
- On-the-fly rendering enhancements using geometry generators (e.g. create and style new geometries from existing features)
- Preview modes for inclusive map making (e.g. monochrome, color blindness)

For more maps created with QGIS, visit the QGIS Map Showcase Flickr Group.

3. Advanced and robust geospatial analysis
- Powerful processing framework with 200+ native processing algorithms
- Access to 1000+ processing algorithms via providers such as GDAL, SAGA, GRASS, OrfeoToolbox, as well as custom models and processing scripts
- Geospatial database engine (filters, joins, relations, forms, etc.), as close to datasource- and format-independent as possible
- Immediate visualization of geospatial query and geoprocessing results
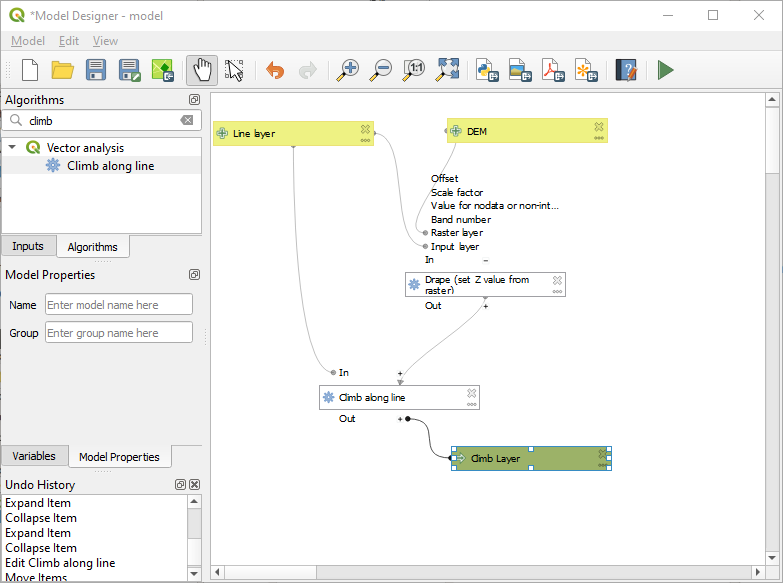
- Model designer and batch processing
Example: Travel isochrones

Example: Model designer
4. Powerful customization and extensibility
- Fully customizable user experience, including user interface and application settings that cater to power-users and beginners alike
- Rich expression engine for maximum flexibility in visualization and processing
- Broad and varied plugin ecosystem that includes data connectors, digitizing aids, advanced analysis and charting tools, in-the-field data capture, conversion of ESRI style files, etc.
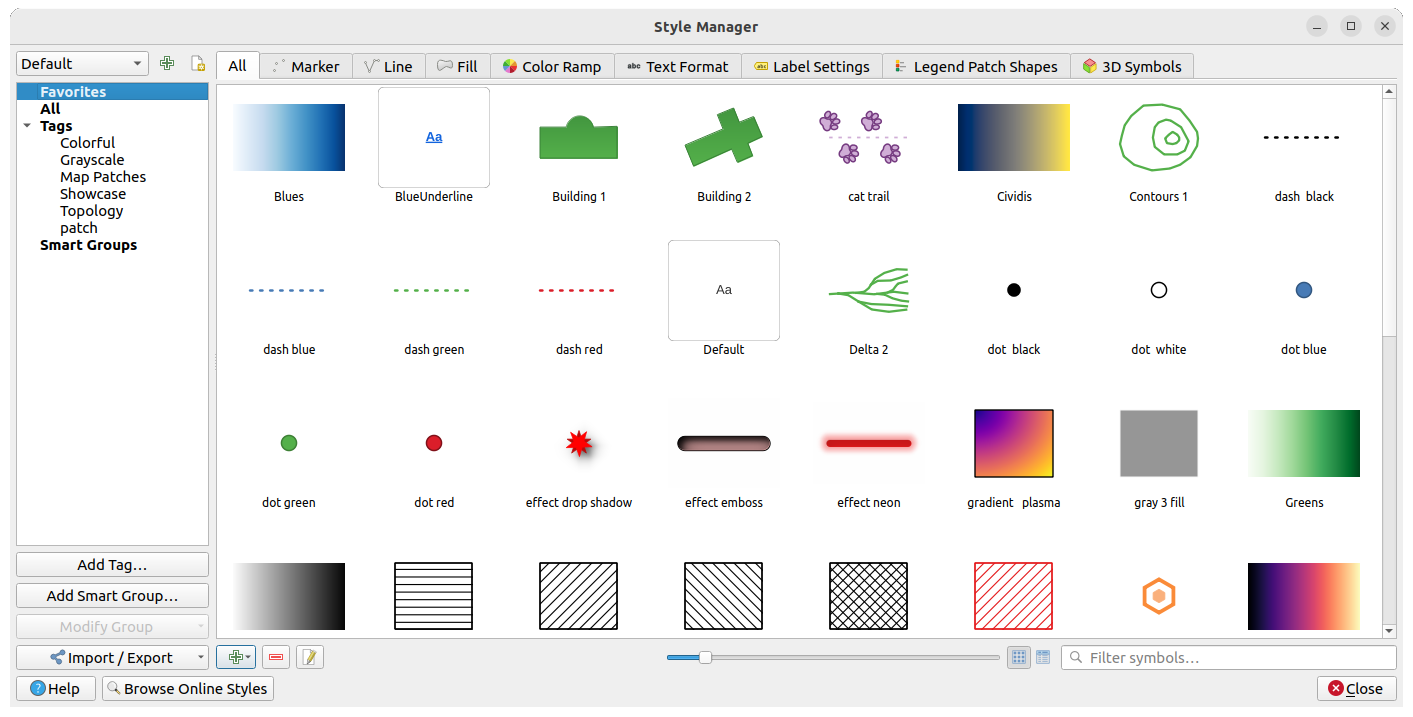
- Style manager for creating, storing, and managing styles
- QGIS style hub for easy sharing of styles
- Python and C++ API for standalone (headless) applications as well as in-application comprehensive scripting (PyQGIS)
Example: Style manager
Example: Plugins

5. QGIS Server
Headless map server -- running on Linux, macOS, Windows, or in a docker container -- that shares the same code base as QGIS.
- Industry-standard protocols (WMS, WFS, WFS3/OGC API for Features and WCS) allow plug-n-play with any software stack
- Works with any web server (Apache, nginx, etc) or standalone
- All beautiful QGIS cartography is supported with best-in-class support for printing
- Fully customizable with Python scripting support
Example: QGIS server WMS response
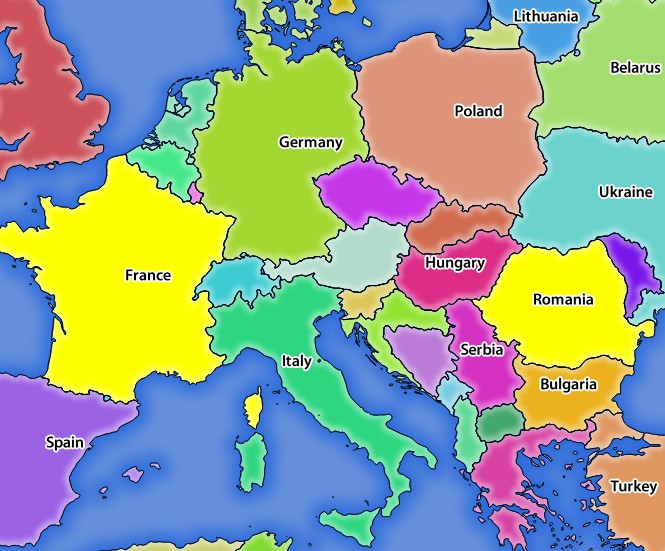
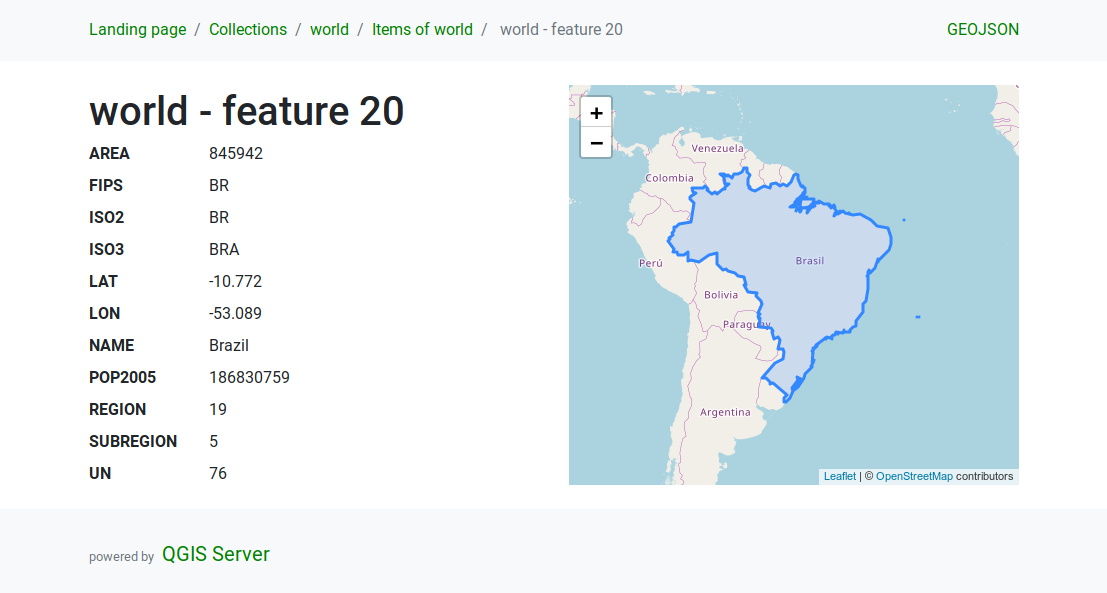
Example: QGIS server WFS response
Under the hood
QGIS is developed using the Qt toolkit and C++, since 2002, and has a pleasing, easy to use graphical user interface with multilingual support. It is maintained by an active developer team and supported by vibrant community of GIS professionals and enthusiasts as well as geospatial data publishers and end-users.
Versions and release cycle
QGIS development and releases follow a time based schedule/roadmap. There are three main branches of QGIS that users can install. These are the Long Term Release (LTR) branch, the Latest Release (LR) branch, and the Development (Nightly) branch.
Every month, there is a Point Release that provides bug-fixes to the LTR and LR.
Free and Open Source
QGIS is released under the GNU Public License (GPL) Version 2 or any later version. Developing QGIS under this license means that you can (if you want to) inspect and modify the source code and guarantees that you, our happy user will always have access to a GIS program that is free of cost and can be freely modified.
QGIS is part of the Open-Source Geospatial Foundation (OSGeo), offering a range of complementary open-source GIS software projects.
Installing and using QGIS
Precompiled binaries for QGIS are available at the QGIS.org download page. Please follow the installation instructions carefully.
The building guide can be used to get started with building QGIS from source.
For installation of QGIS Server, see its getting started documentation.
Documentation
A range of documentation is available. This includes:
- Training Manual
- QGIS User Guide
- QGIS Server Guide
- Visual Changelog
- Documentation Guidelines
- QGIS Python (PyQGIS) Cookbook
- QGIS Python (PyQGIS) API
- QGIS C++ API
- Developers Guide
Help and support channels
There are several channels where you can find help and support for QGIS:
- Using the QGIS community site
- Joining the qgis-users mailing list
- Chatting with other users real-time. Please wait around for a response to your question as many folks on the channel are doing other things and it may take a while for them to notice your question. The following paths all take you to the same chat room:
- Using an IRC client and joining the #qgis channel on irc.libera.chat.
- Using a Matrix client and joining the #qgis:osgeo.org room.
- At the GIS stackexchange or r/QGIS reddit, which are not maintained by the QGIS team, but where the QGIS and broader GIS community provides lots of advice
- Other support channels
Get involved with the community
Top Related Projects
GDAL is an open source MIT licensed translator library for raster and vector geospatial data formats.
Interactive, thoroughly customizable maps in the browser, powered by vector tiles and WebGL
🍃 JavaScript library for mobile-friendly interactive maps 🇺🇦
Official GeoTools repository
🆔 The easy-to-use OpenStreetMap editor in JavaScript.
Source code of the MapServer project. Please submit pull requests to the 'main' branch.
Convert  designs to code with AI

Introducing Visual Copilot: A new AI model to turn Figma designs to high quality code using your components.
Try Visual Copilot