 AAChartCore-Kotlin
📈📊⛰⛰⛰An elegant modern declarative data visualization chart framework for Android . Extremely powerful, supports line, spline, area, areaspline, column, bar, pie, scatter, angular gauges, arearange, areasplinerange, columnrange, bubble, box plot, error bars, funnel, waterfall and polar chart types.极其精美而又强大的 Android 数据可视化图表框架,支持柱状图、条形图、折线图、曲线图、折线填充图、曲线填充图、气泡图、扇形图、环形图、散点图、雷达图、混合图等各种类型的多达几十种的信息图图表,完全满足工作所需.
Top Related Projects

Android Graph Library for creating zoomable and scrollable line and bar graphs.

A powerful 🚀 Android chart view / graph view library, supporting line- bar- pie- radar- bubble- and candlestick charts as well as scaling, panning and animations.

Android Library to rapidly develop attractive and insightful charts in android applications.

Charts library for Android compatible with API 8+, several chart types with scaling, scrolling and animations 📊

AnyChart Android Chart is an amazing data visualization library for easily creating interactive charts in Android apps. It runs on API 19+ (Android 4.4) and features dozens of built-in chart types.

Make a cool intro for your Android app.
Quick Overview
AAChartCore-Kotlin is an open-source charting library for Android applications, written in Kotlin. It provides a simple and efficient way to create various types of interactive and animated charts, making it easier for developers to integrate data visualization into their Android apps.
Pros
- Easy to use with a fluent API design
- Supports a wide variety of chart types
- Highly customizable with numerous styling options
- Smooth animations and interactive features
Cons
- Limited documentation compared to some other charting libraries
- May have a steeper learning curve for developers new to Kotlin
- Fewer advanced features compared to some paid alternatives
- Potential performance issues with large datasets
Code Examples
- Creating a basic line chart:
val aaChartModel = AAChartModel()
    .chartType(AAChartType.Line)
    .title("Line Chart")
    .subtitle("Basic Line Chart")
    .dataLabelsEnabled(true)
    .series(arrayOf(
        AASeriesElement()
            .name("Tokyo")
            .data(arrayOf(7.0, 6.9, 9.5, 14.5, 18.2, 21.5, 25.2, 26.5, 23.3, 18.3, 13.9, 9.6))
    ))

aaChartView.aa_drawChartWithChartModel(aaChartModel)
- Customizing chart colors:
val aaChartModel = AAChartModel()
    .chartType(AAChartType.Column)
    .title("Custom Colors")
    .yAxisTitle("Fruit yield")
    .colorsTheme(arrayOf("#fe117c", "#ffc069", "#06caf4", "#7dffc0"))
    .series(arrayOf(
        AASeriesElement()
            .name("Apples")
            .data(arrayOf(3, 2, 1, 3, 4)),
        AASeriesElement()
            .name("Oranges")
            .data(arrayOf(2, 4, 3, 1, 5))
    ))

aaChartView.aa_drawChartWithChartModel(aaChartModel)
- Creating a mixed chart type:
val aaChartModel = AAChartModel()
    .title("Mixed Chart Types")
    .subtitle("Line, Column & Area")
    .series(arrayOf(
        AASeriesElement()
            .name("Column")
            .type(AAChartType.Column)
            .data(arrayOf(1.1, 2.2, 3.3, 4.4, 5.5, 6.6)),
        AASeriesElement()
            .name("Line")
            .type(AAChartType.Line)
            .data(arrayOf(2.1, 3.2, 4.3, 5.4, 6.5, 7.6)),
        AASeriesElement()
            .name("Area")
            .type(AAChartType.Area)
            .data(arrayOf(3.1, 4.2, 5.3, 6.4, 7.5, 8.6))
    ))

aaChartView.aa_drawChartWithChartModel(aaChartModel)
Getting Started
- Add the dependency to your
build.gradlefile:
dependencies {
    implementation 'com.github.AAChartModel:AAChartCore-Kotlin:7.2.0'
}
- Add the
AAChartViewto your layout XML:
<com.github.aachartmodel.aainfographics.aachartcreator.AAChartView
    android:id="@+id/aa_chart_view"
    android:layout_width="match_parent"
    android:layout_height="match_parent"/>
- Create and configure the chart in your Kotlin code:
val aaChartView = findViewById<AAChartView>(R.id.aa_chart_view)
val
Competitor Comparisons
Android Graph Library for creating zoomable and scrollable line and bar graphs.
Pros of GraphView
- More mature and established library with a longer history
- Simpler API for basic graph creation
- Better documentation and community support
Cons of GraphView
- Less visually appealing out-of-the-box
- Limited customization options compared to AAChartCore-Kotlin
- Fewer chart types available
Code Comparison
GraphView:
val graph = findViewById<GraphView>(R.id.graph)
val series = LineGraphSeries(arrayOf(
    DataPoint(0.0, 1.0),
    DataPoint(1.0, 5.0),
    DataPoint(2.0, 3.0)
))
graph.addSeries(series)
AAChartCore-Kotlin:
val aaChartModel = AAChartModel()
    .chartType(AAChartType.Line)
    .dataLabelsEnabled(true)
    .series(arrayOf(
        AASeriesElement()
            .name("Tokyo")
            .data(arrayOf(7.0, 6.9, 9.5, 14.5, 18.2, 21.5, 25.2, 26.5, 23.3, 18.3, 13.9, 9.6))
    ))
GraphView offers a more straightforward approach for creating basic graphs, while AAChartCore-Kotlin provides more extensive customization options and chart types. GraphView is better suited for simple visualizations, whereas AAChartCore-Kotlin excels in creating more complex and visually appealing charts. The choice between the two depends on the specific requirements of your project and the level of customization needed.
A powerful 🚀 Android chart view / graph view library, supporting line- bar- pie- radar- bubble- and candlestick charts as well as scaling, panning and animations.
Pros of MPAndroidChart
- More mature and widely adopted library with a larger community
- Offers a wider range of chart types and customization options
- Better performance for large datasets and real-time updates
Cons of MPAndroidChart
- Steeper learning curve due to its extensive API and features
- Requires more code to create and customize charts
- Larger library size, which may impact app size
Code Comparison
MPAndroidChart:
val entries = ArrayList<Entry>()
// Add entries...
val dataSet = LineDataSet(entries, "Label")
val lineData = LineData(dataSet)
chart.data = lineData
chart.invalidate()
AAChartCore-Kotlin:
val aaChartModel = AAChartModel()
    .chartType(AAChartType.Line)
    .title("Chart Title")
    .series(arrayOf(
        AASeriesElement()
            .name("Series Name")
            .data(arrayOf(1, 2, 3, 4, 5))
    ))
MPAndroidChart provides more granular control over chart elements but requires more code, while AAChartCore-Kotlin offers a more concise and declarative approach to chart creation. MPAndroidChart is better suited for complex, highly customized charts, while AAChartCore-Kotlin excels in quickly creating simple charts with less code.
Android Library to rapidly develop attractive and insightful charts in android applications.
Pros of WilliamChart
- Lightweight and focused on Android-specific chart types
- Easy to customize with simple API and builder pattern
- Smooth animations and transitions between data updates
Cons of WilliamChart
- Limited chart types compared to AAChartCore-Kotlin
- Less extensive documentation and community support
- Primarily designed for Android, limiting cross-platform use
Code Comparison
WilliamChart:
LineChartView(context).apply {
    animate(300)
    gradientFillColors = intArrayOf(Color.WHITE, Color.BLACK)
    lineSet(lineSet)
    onDataPointTouchListener = { index, _, _ -> /* ... */ }
}
AAChartCore-Kotlin:
AAChartModel()
    .chartType(AAChartType.Line)
    .title("Line Chart")
    .dataLabelsEnabled(true)
    .series(arrayOf(
        AASeriesElement()
            .name("Tokyo")
            .data(arrayOf(7.0, 6.9, 9.5, 14.5, 18.2, 21.5, 25.2, 26.5, 23.3, 18.3, 13.9, 9.6))
    ))
WilliamChart offers a more concise and Android-specific approach, while AAChartCore-Kotlin provides a more comprehensive and configurable solution with a wider range of chart types. WilliamChart is better suited for simple Android projects, whereas AAChartCore-Kotlin is more versatile for cross-platform development and complex charting needs.
Charts library for Android compatible with API 8+, several chart types with scaling, scrolling and animations 📊
Pros of hellocharts-android
- Lightweight and focused specifically on Android charting
- Supports a wide range of chart types, including line, bar, pie, and bubble charts
- Smooth animations and interactive features built-in
Cons of hellocharts-android
- Less actively maintained, with the last update in 2016
- Limited customization options compared to AAChartCore-Kotlin
- Lacks some advanced chart types and features
Code Comparison
hellocharts-android:
val lineChartData = LineChartData()
val values = mutableListOf<PointValue>()
values.add(PointValue(0f, 2f))
values.add(PointValue(1f, 4f))
lineChartData.lines = listOf(Line(values))
AAChartCore-Kotlin:
val aaChartModel = AAChartModel()
    .chartType(AAChartType.Line)
    .dataLabelsEnabled(true)
    .series(arrayOf(
        AASeriesElement()
            .name("Data")
            .data(arrayOf(2, 4))
    ))
Both libraries offer ways to create charts, but AAChartCore-Kotlin provides a more fluent API and offers more customization options. hellocharts-android has a simpler approach but may require more manual setup for complex charts.
AnyChart Android Chart is an amazing data visualization library for easily creating interactive charts in Android apps. It runs on API 19+ (Android 4.4) and features dozens of built-in chart types.
Pros of AnyChart-Android
- More comprehensive charting library with a wider variety of chart types
- Extensive documentation and examples available
- Commercial-grade support and regular updates
Cons of AnyChart-Android
- Paid license required for commercial use
- Larger file size and potentially higher resource usage
- Steeper learning curve due to more complex API
Code Comparison
AAChartCore-Kotlin:
val aaChartModel = AAChartModel()
    .chartType(AAChartType.Area)
    .title("Title")
    .subtitle("Subtitle")
    .dataLabelsEnabled(true)
    .series(arrayOf(
        AASeriesElement()
            .name("Tokyo")
            .data(arrayOf(7.0, 6.9, 9.5, 14.5, 18.2, 21.5, 25.2, 26.5, 23.3, 18.3, 13.9, 9.6))
    ))
AnyChart-Android:
val chart = AnyChart.line()
chart.data(listOf(
    ValueDataEntry("January", 10000),
    ValueDataEntry("February", 12000),
    ValueDataEntry("March", 18000)
))
chart.title("Monthly Sales")
chart.yAxis(0).title("Sales (USD)")
chart.xAxis(0).title("Month")
Both libraries offer easy-to-use APIs for creating charts, but AnyChart-Android provides more customization options at the cost of a slightly more verbose syntax. AAChartCore-Kotlin focuses on simplicity and ease of use, making it quicker to implement basic charts.
Make a cool intro for your Android app.
Pros of AppIntro
- Specialized for creating app introductions and onboarding experiences
- Extensive customization options for slides, animations, and transitions
- Active community and regular updates
Cons of AppIntro
- Limited to creating app introductions, not a general-purpose charting library
- May require additional setup for complex custom designs
Code Comparison
AppIntro:
override fun onCreate(savedInstanceState: Bundle?) {
    super.onCreate(savedInstanceState)
    setContentView(R.layout.activity_main)
    addSlide(AppIntroFragment.newInstance(
        title = "Welcome!",
        description = "This is a sample slide"
    ))
}
AAChartCore-Kotlin:
val aaChartModel = AAChartModel()
    .chartType(AAChartType.Area)
    .title("Chart Demo")
    .subtitle("Subtitle")
    .dataLabelsEnabled(true)
    .series(arrayOf(
        AASeriesElement()
            .name("Tokyo")
            .data(arrayOf(7.0, 6.9, 9.5, 14.5, 18.2, 21.5, 25.2, 26.5, 23.3, 18.3, 13.9, 9.6))
    ))
AppIntro is focused on creating app introductions with a simple API for adding slides and customizing their appearance. AAChartCore-Kotlin, on the other hand, is a comprehensive charting library that allows for the creation of various chart types with detailed data visualization options. While AppIntro excels in onboarding experiences, AAChartCore-Kotlin provides more flexibility for data representation in different chart formats.
Convert  designs to code with AI

Introducing Visual Copilot: A new AI model to turn Figma designs to high quality code using your components.
Try Visual CopilotREADME
![]()
AAInfographics
![]()
![]()
![]()
![]()
![]()


![]()
![]()
English Document ð¬ð§ | ç®ä½ä¸æææ¡£ ð¨ð³
There is the link of Java version of AAChartCore-Kotlin as follow
https://github.com/AAChartModel/AAChartCore
Preface
AAInfographics is the Kotlin language version of AAChartKit which is object-oriented, a set of easy-to-use, extremely elegant graphics drawing controls,based on the popular open source front-end chart library Highcharts. It makes it very fast to add interactive charts to your mobile projects. It supports single touch-drag for data inspection, multi-touch for zooming, and advanced responsiveness for your apps .
Features
- Support
AndroidãKotlin&Java. - Powerful,support the
column chartãbar chartãarea chartãareaspline chartãline chartãspline chartãradar chartãpolar chartãpie chartãbubble chartãpyramid chartãfunnel chartãcolumnrange chartand other graphics. - Interactiveãanimated, the
animationeffect is exquisite ãdelicateã smooth and beautiful. - Support
chain programming syntaxlike system framework. AAChartView + AAChartModel = ChartIn the AAInfographics,it follows a minimalist formula:Chart view + Chart model = The chart you want. Just like the other powerful charts framework AAChartKitãAAChartKit-SwiftãAAChartCore.
Appreciation


Installation
Gradle
Step 1. Add the JitPack repository to your build file
Add it in your root build.gradle at the end of repositories:
	allprojects {
		repositories {
			...
			maven { url 'https://www.jitpack.io' }
		}
	}
Step 2. Add the dependency
	dependencies {
	        implementation 'com.github.AAChartModel:AAChartCore-Kotlin:-SNAPSHOT'
	}
You're all set, enjoy!
Usage
- Create the instance object of chart view:
AAChartView
    <com.github.aachartmodel.aainfographics.aachartcreator.AAChartView
        android:id="@+id/aa_chart_view"
        android:layout_width="match_parent"
        android:layout_height="match_parent">

    </com.github.aachartmodel.aainfographics.aachartcreator.AAChartView>
val aaChartView = findViewById<AAChartView>(R.id.aa_chart_view)
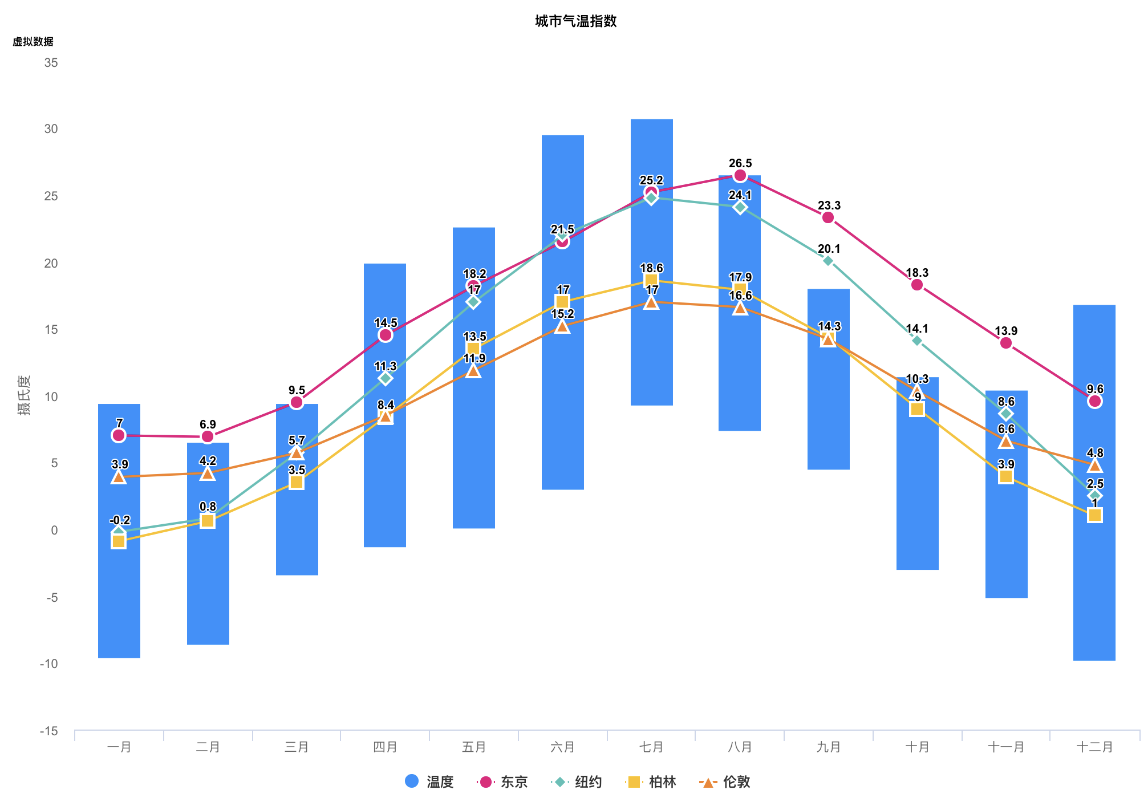
- Configure the properties of chart model:
AAChartModel
val aaChartModel : AAChartModel = AAChartModel()
.chartType(AAChartType.Area)
.title("title")
.subtitle("subtitle")
.backgroundColor("#4b2b7f")
.dataLabelsEnabled(true)
.series(arrayOf(
AASeriesElement()
.name("Tokyo")
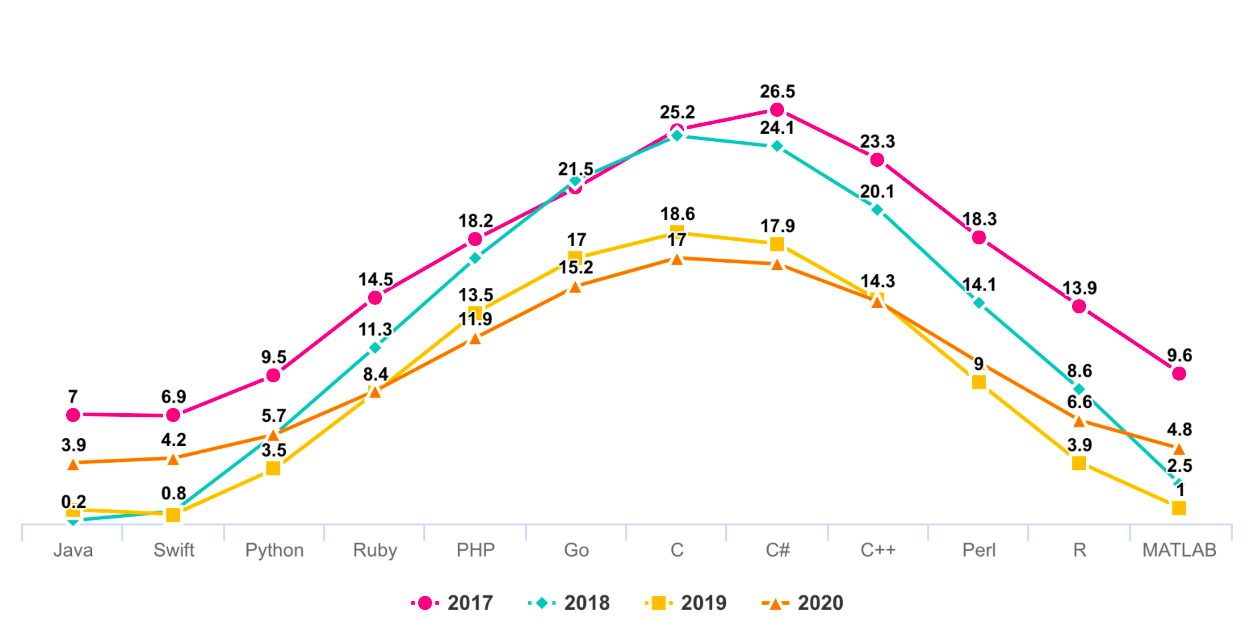
.data(arrayOf(7.0, 6.9, 9.5, 14.5, 18.2, 21.5, 25.2, 26.5, 23.3, 18.3, 13.9, 9.6)),
AASeriesElement()
.name("NewYork")
.data(arrayOf(0.2, 0.8, 5.7, 11.3, 17.0, 22.0, 24.8, 24.1, 20.1, 14.1, 8.6, 2.5)),
AASeriesElement()
.name("London")
.data(arrayOf(0.9, 0.6, 3.5, 8.4, 13.5, 17.0, 18.6, 17.9, 14.3, 9.0, 3.9, 1.0)),
AASeriesElement()
.name("Berlin")
.data(arrayOf(3.9, 4.2, 5.7, 8.5, 11.9, 15.2, 17.0, 16.6, 14.2, 10.3, 6.6, 4.8))
)
)
- Draw the chart(This method is called only for the first time after you create an AAChartView instance object)
        //The chart view object calls the instance object of AAChartModel and draws the final graphic
        aaChartView.aa_drawChartWithChartModel(aaChartModel)
- Finally add this line to your proguard file:
-keep class com.github.aachartmodel.aainfographics.** { *; }
ð¹ð¹ð¹Congratulations! Everything was done!!! You will get what you want!!!
Update chart content
if you want to refresh chart content,you should do something as follow.According to your actual needs, select the function that fits you.
- Only refresh the chart data(This method is recommended to be called for updating the series data dynamically)
        //Only refresh the chart series data
        aaChartView.aa_onlyRefreshTheChartDataWithChartModelSeries(chartModelSeriesArray)
- Refresh the chart, minus the chart data (this method is recommended for subsequent refreshes after the first drawing of graphics has completed. If you want to update the chart data only, you should use the function
aa_onlyRefreshTheChartDataWithChartModelSeries)
        //Refresh the chart after the AAChartModel whole content is updated
        aaChartView.aa_refreshChartWholeContentWithChartModel(aaChartModel)
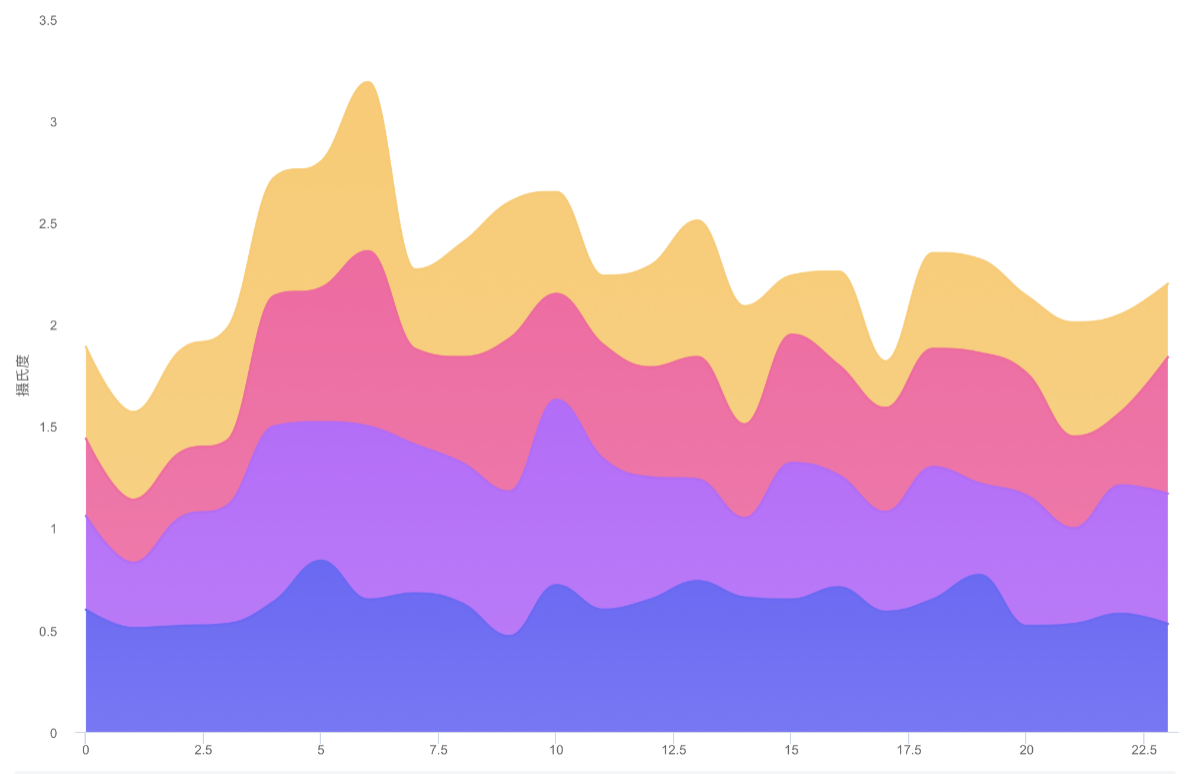
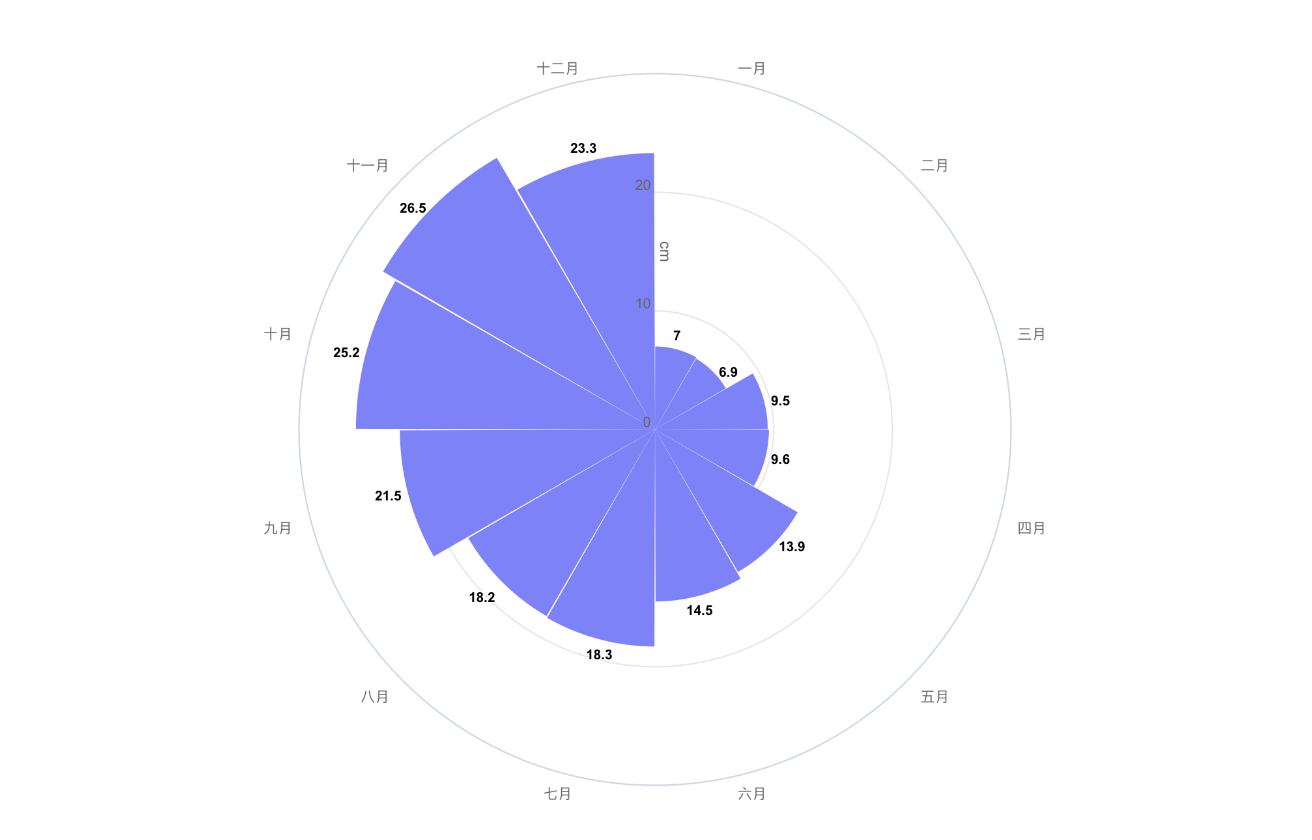
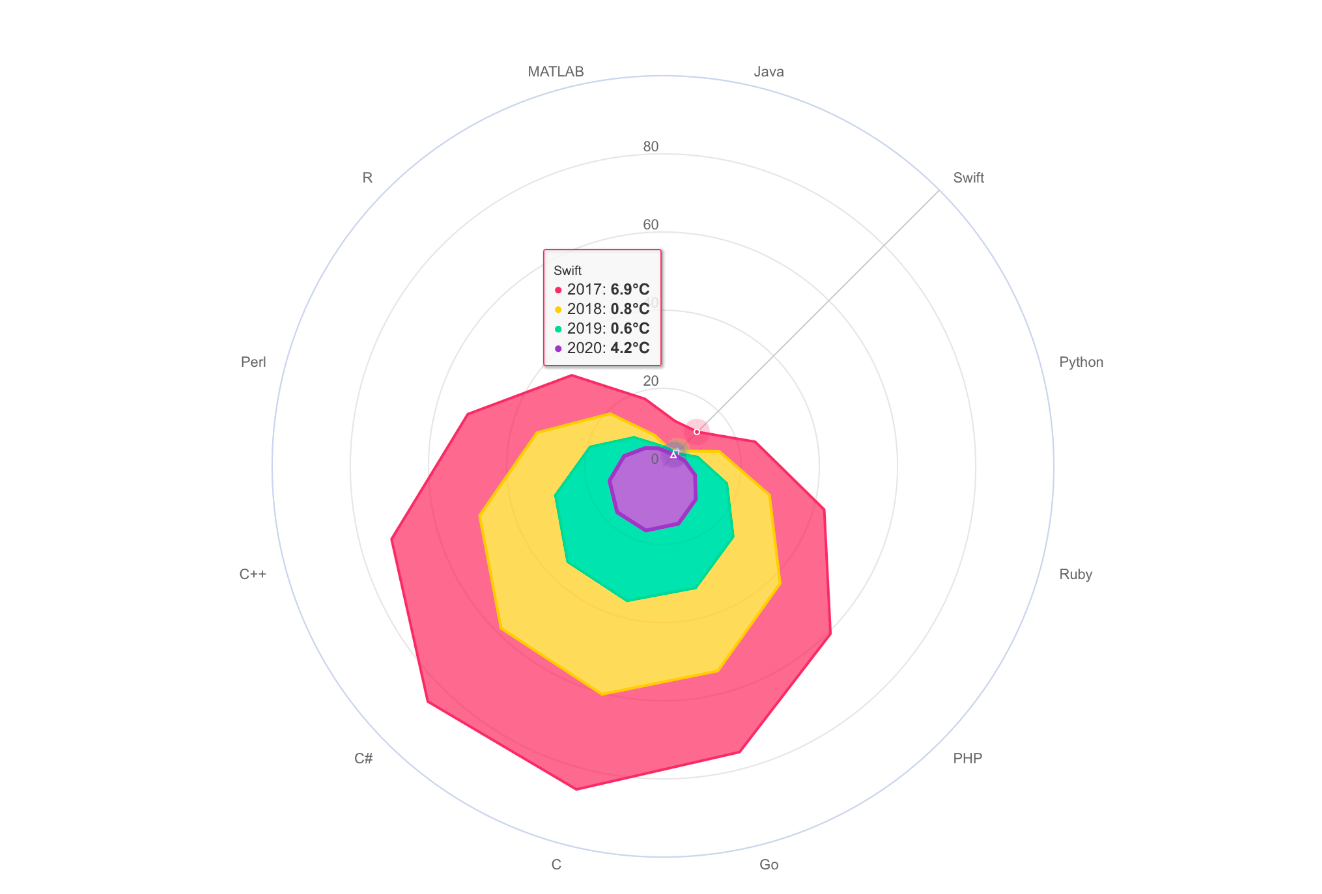
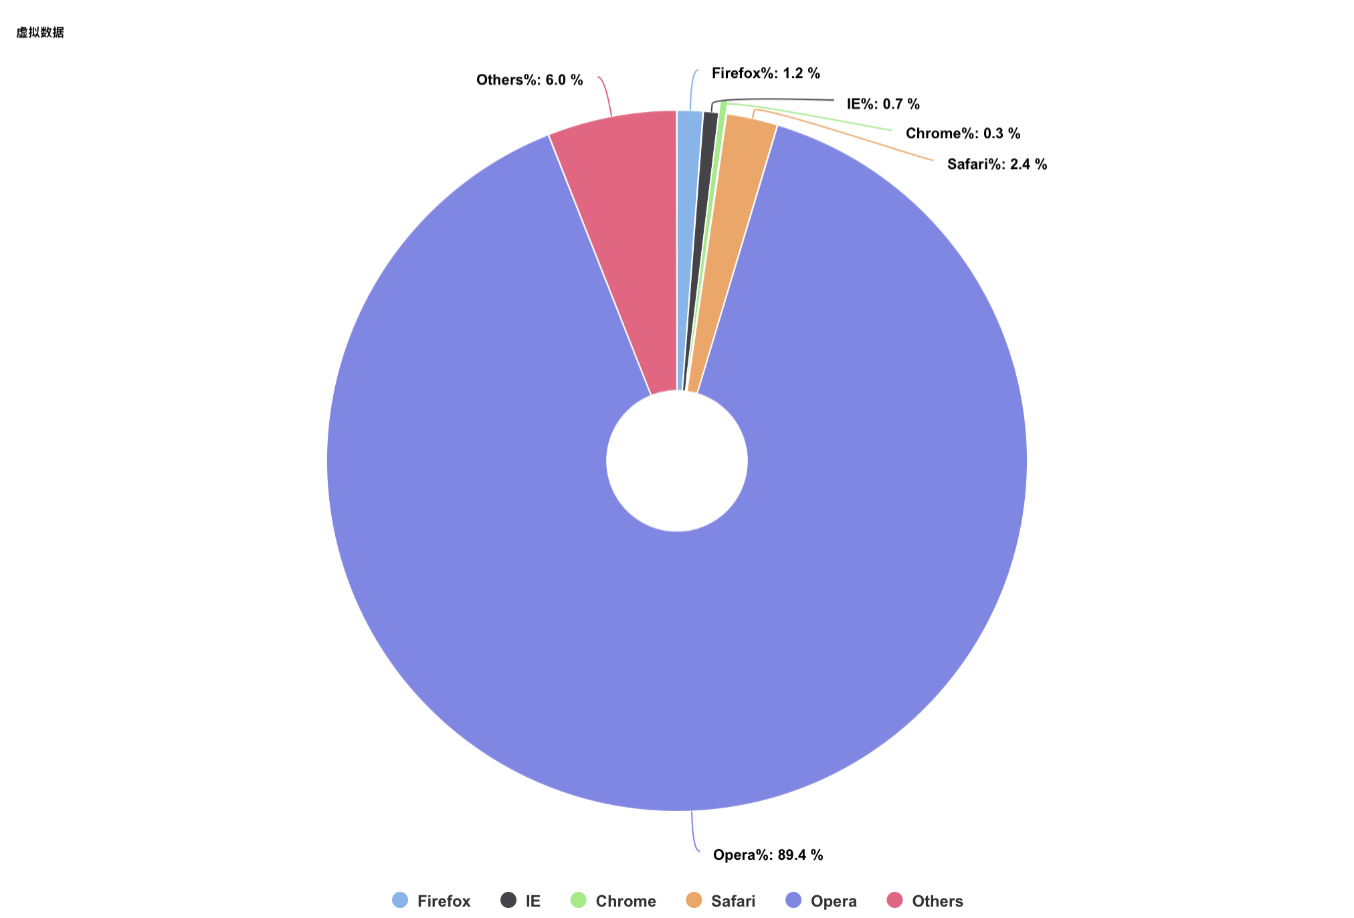
Infographics sample
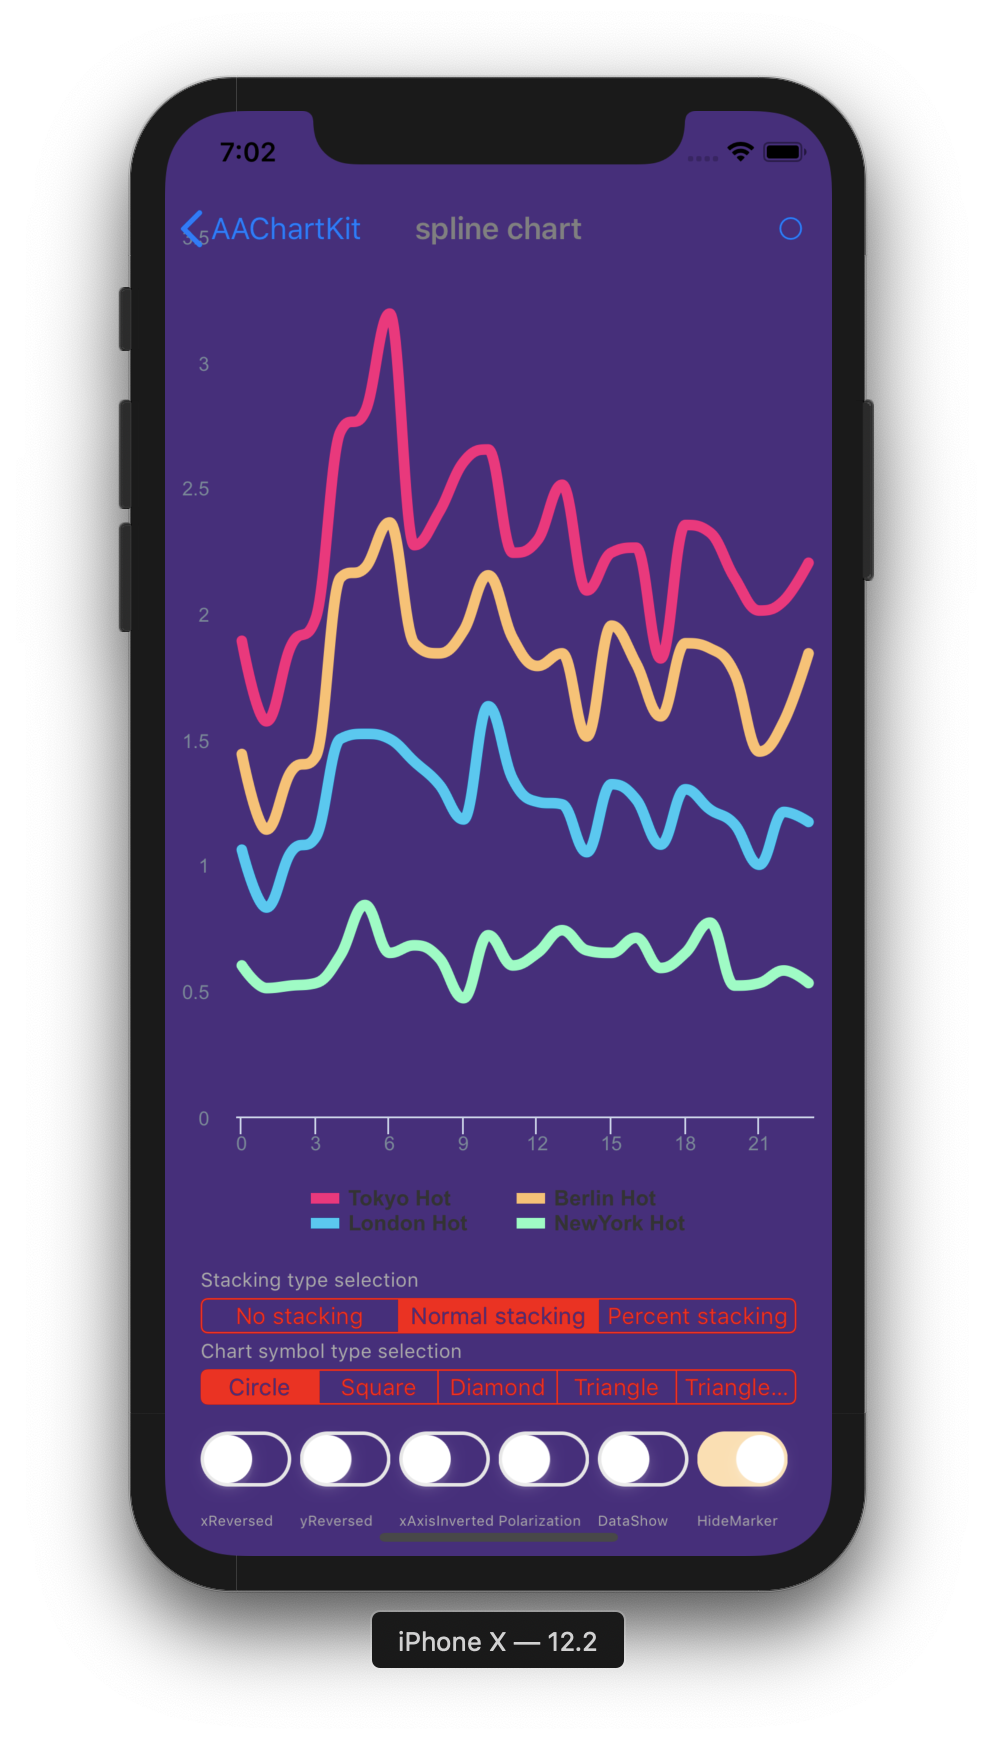
-
line chart
-
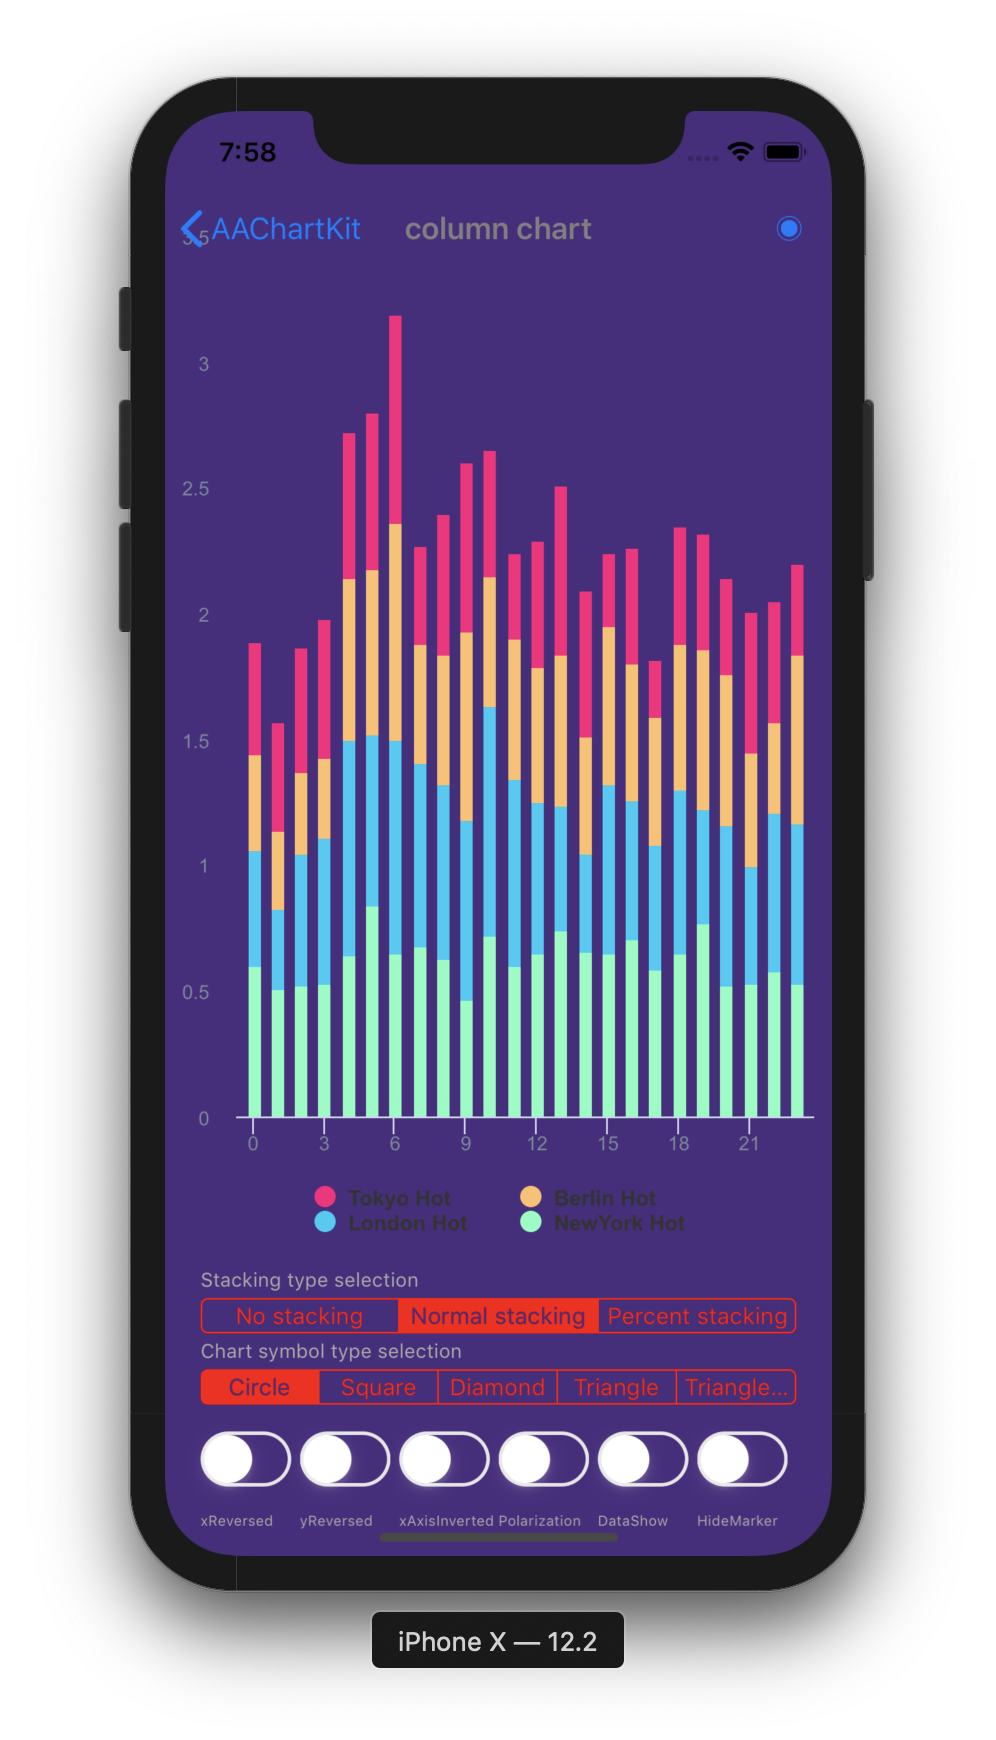
column chart
-
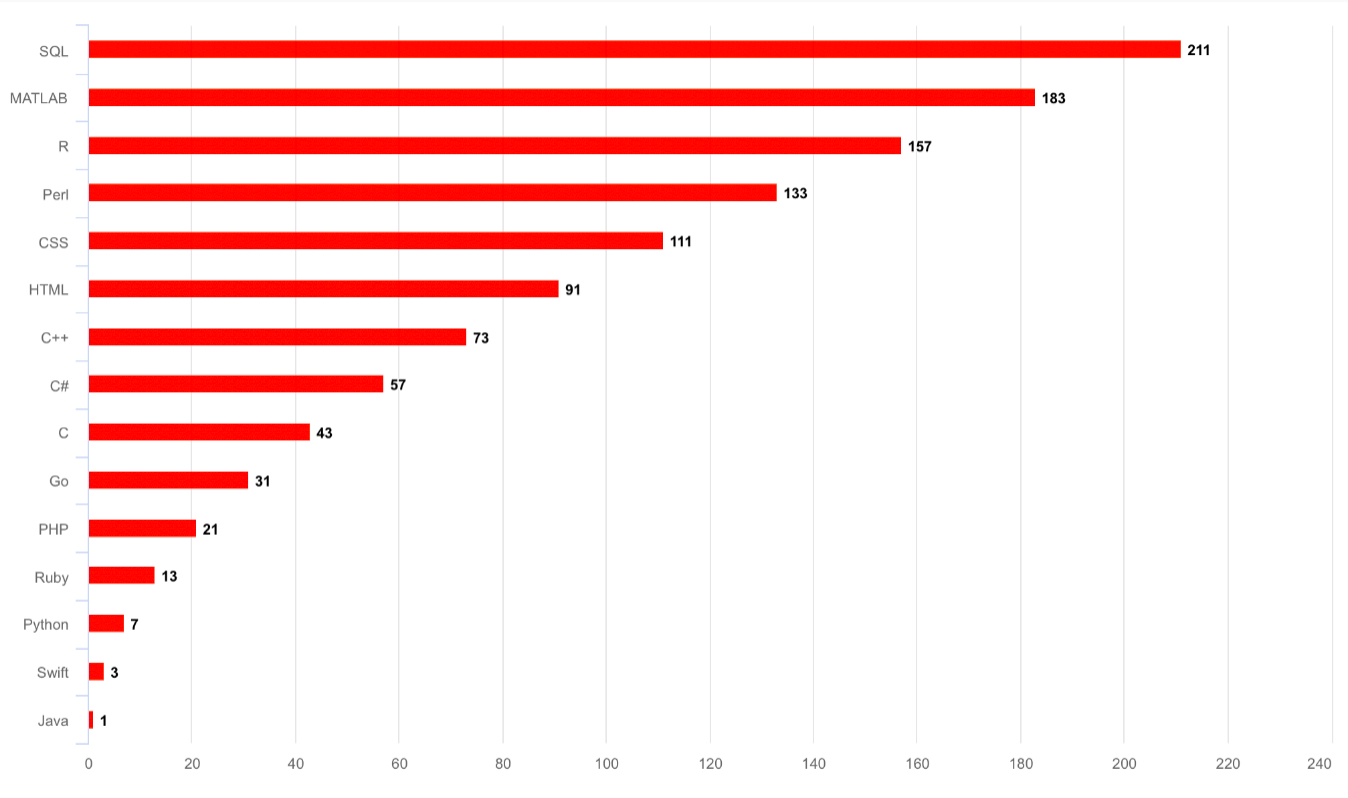
bar chart
-
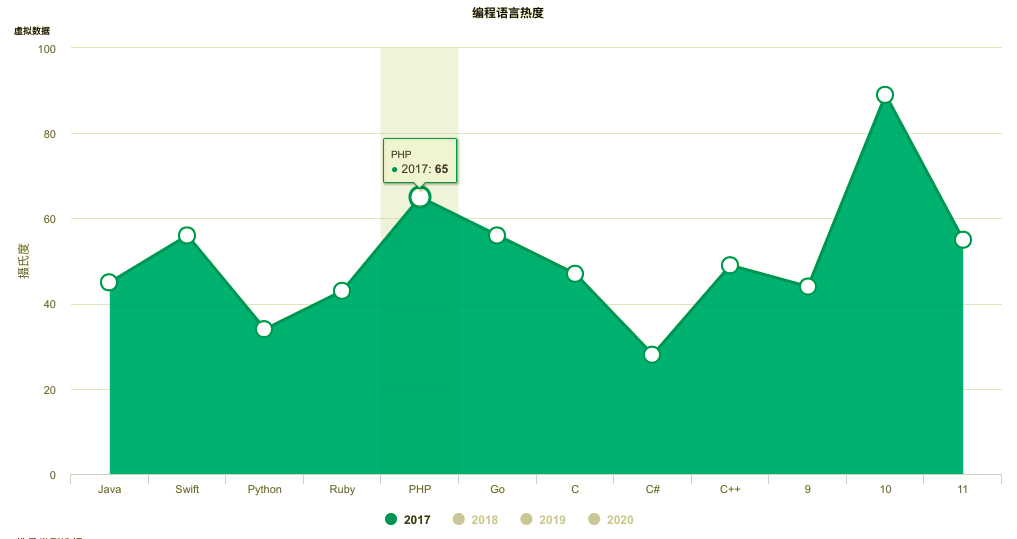
special area chart one
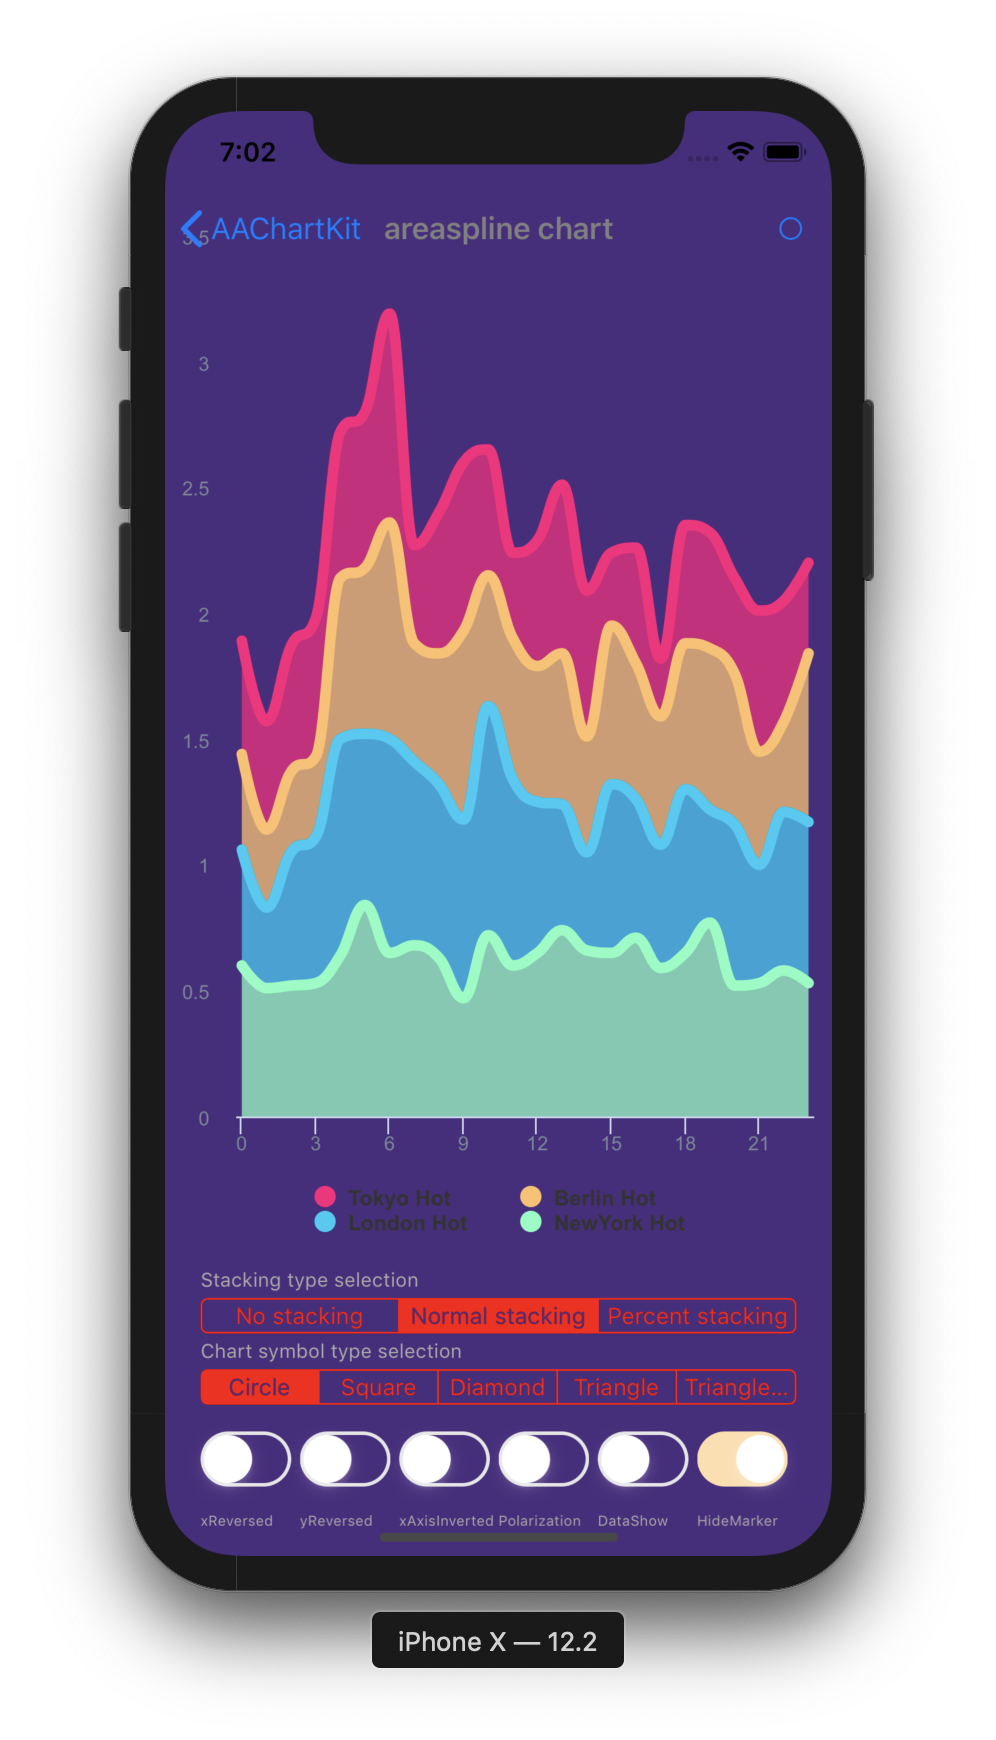
-
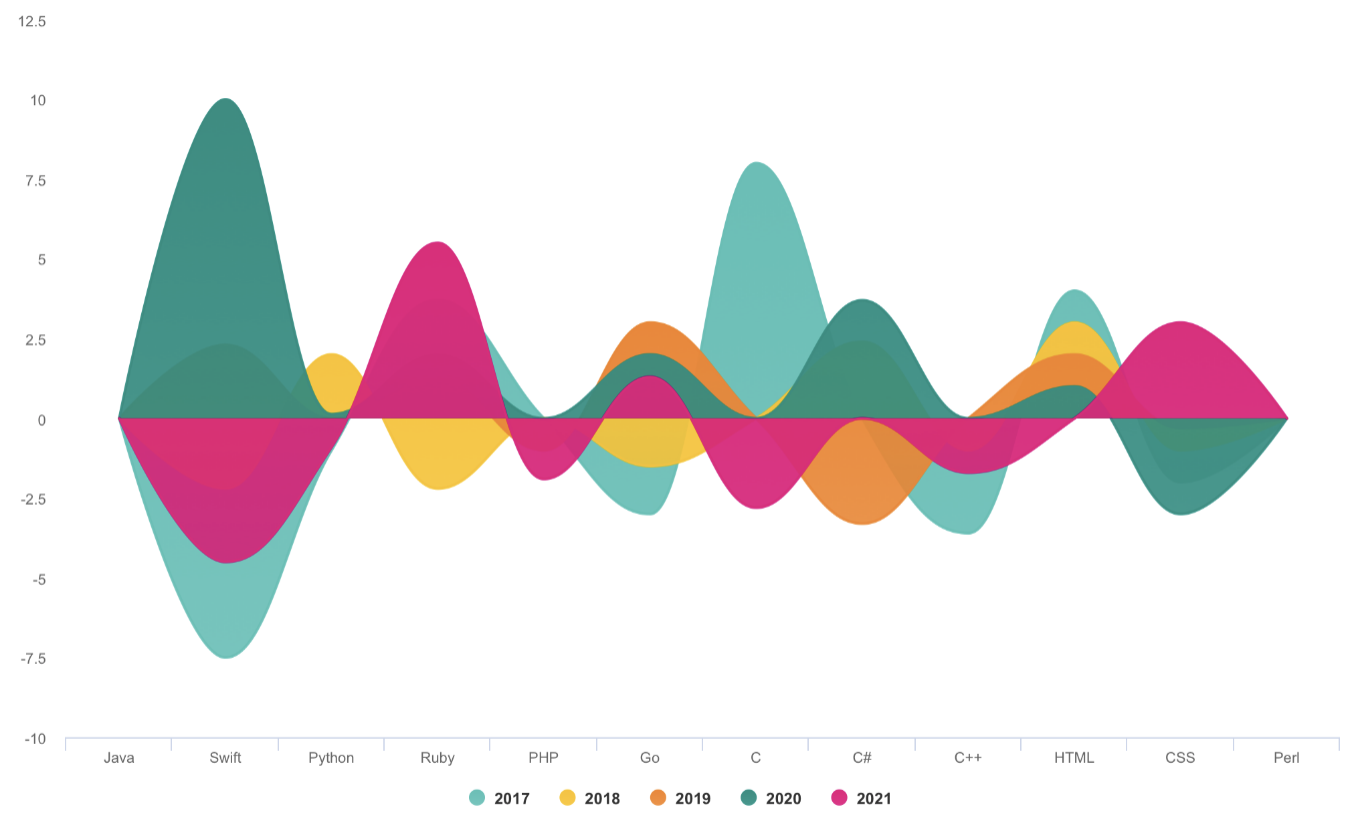
special area chart two
-
special area chart three
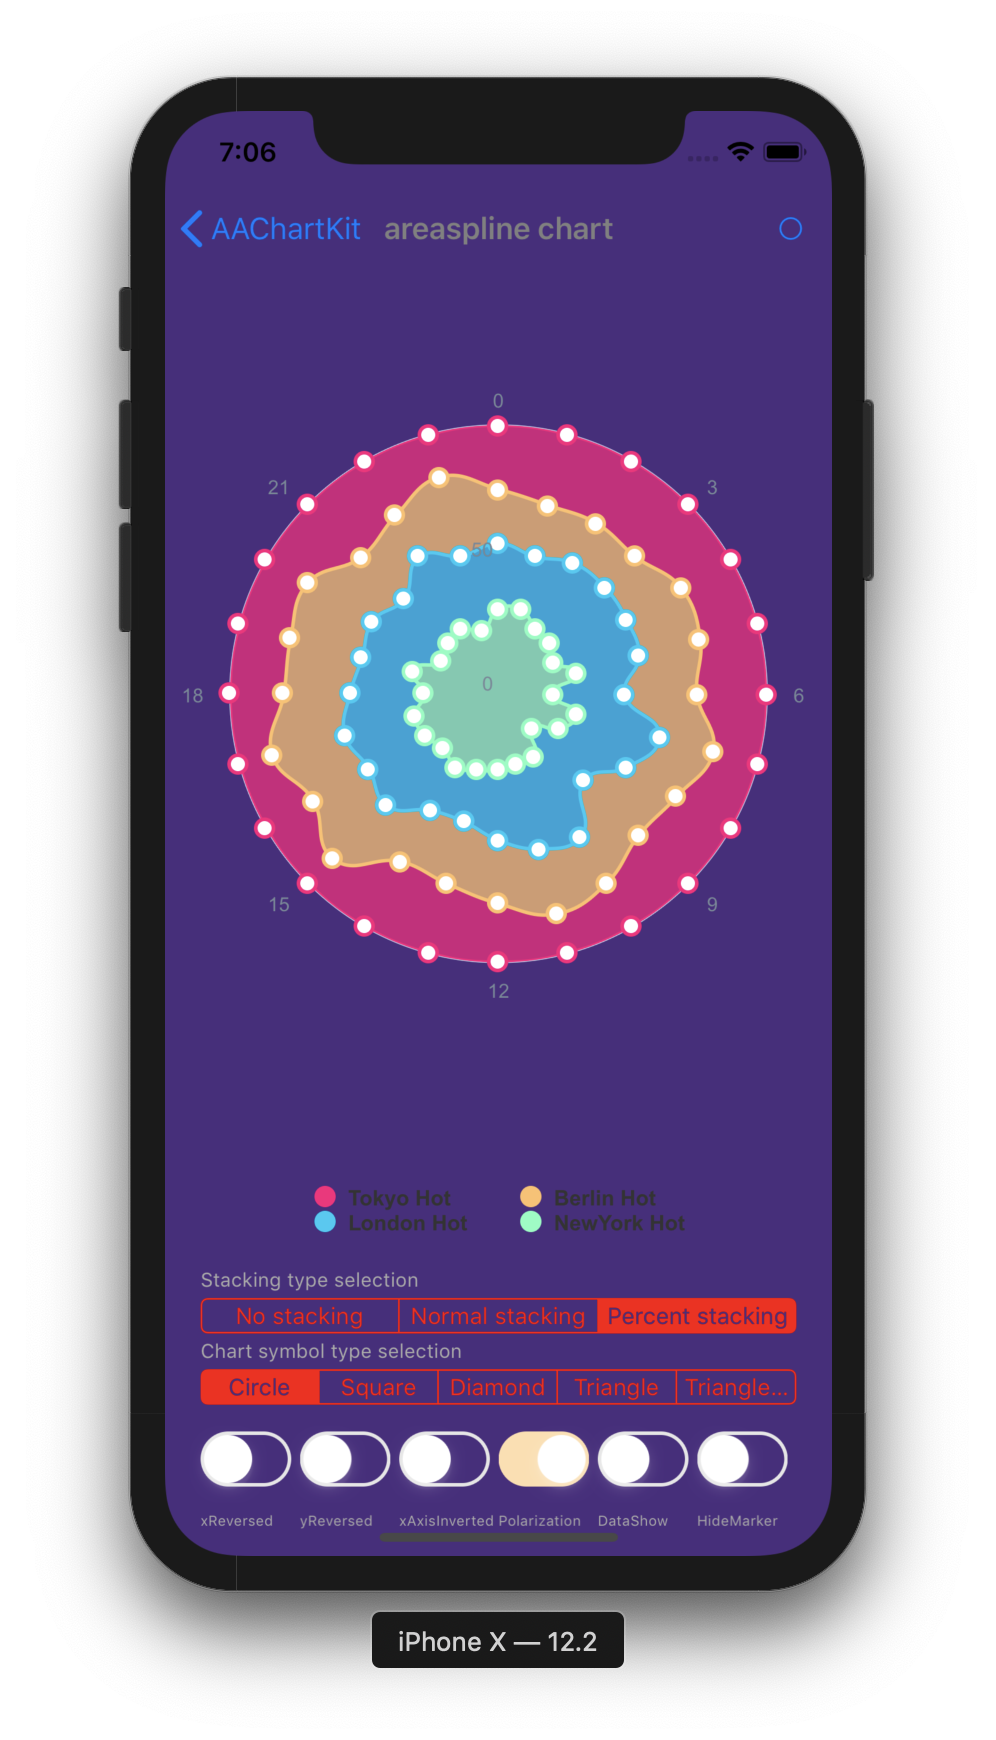
-
polar chart
-
radar chart
-
pie chart
-
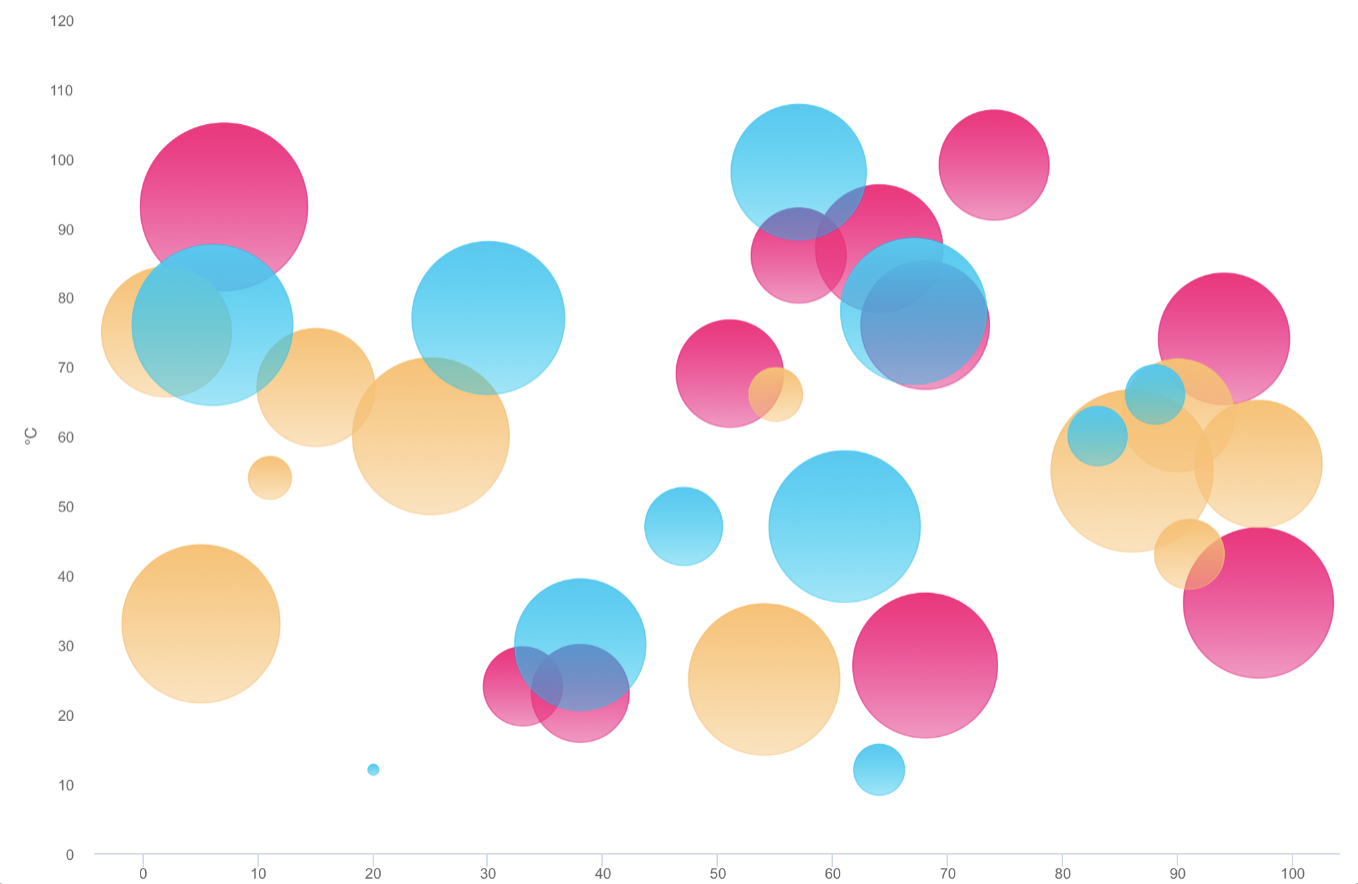
bubble chart
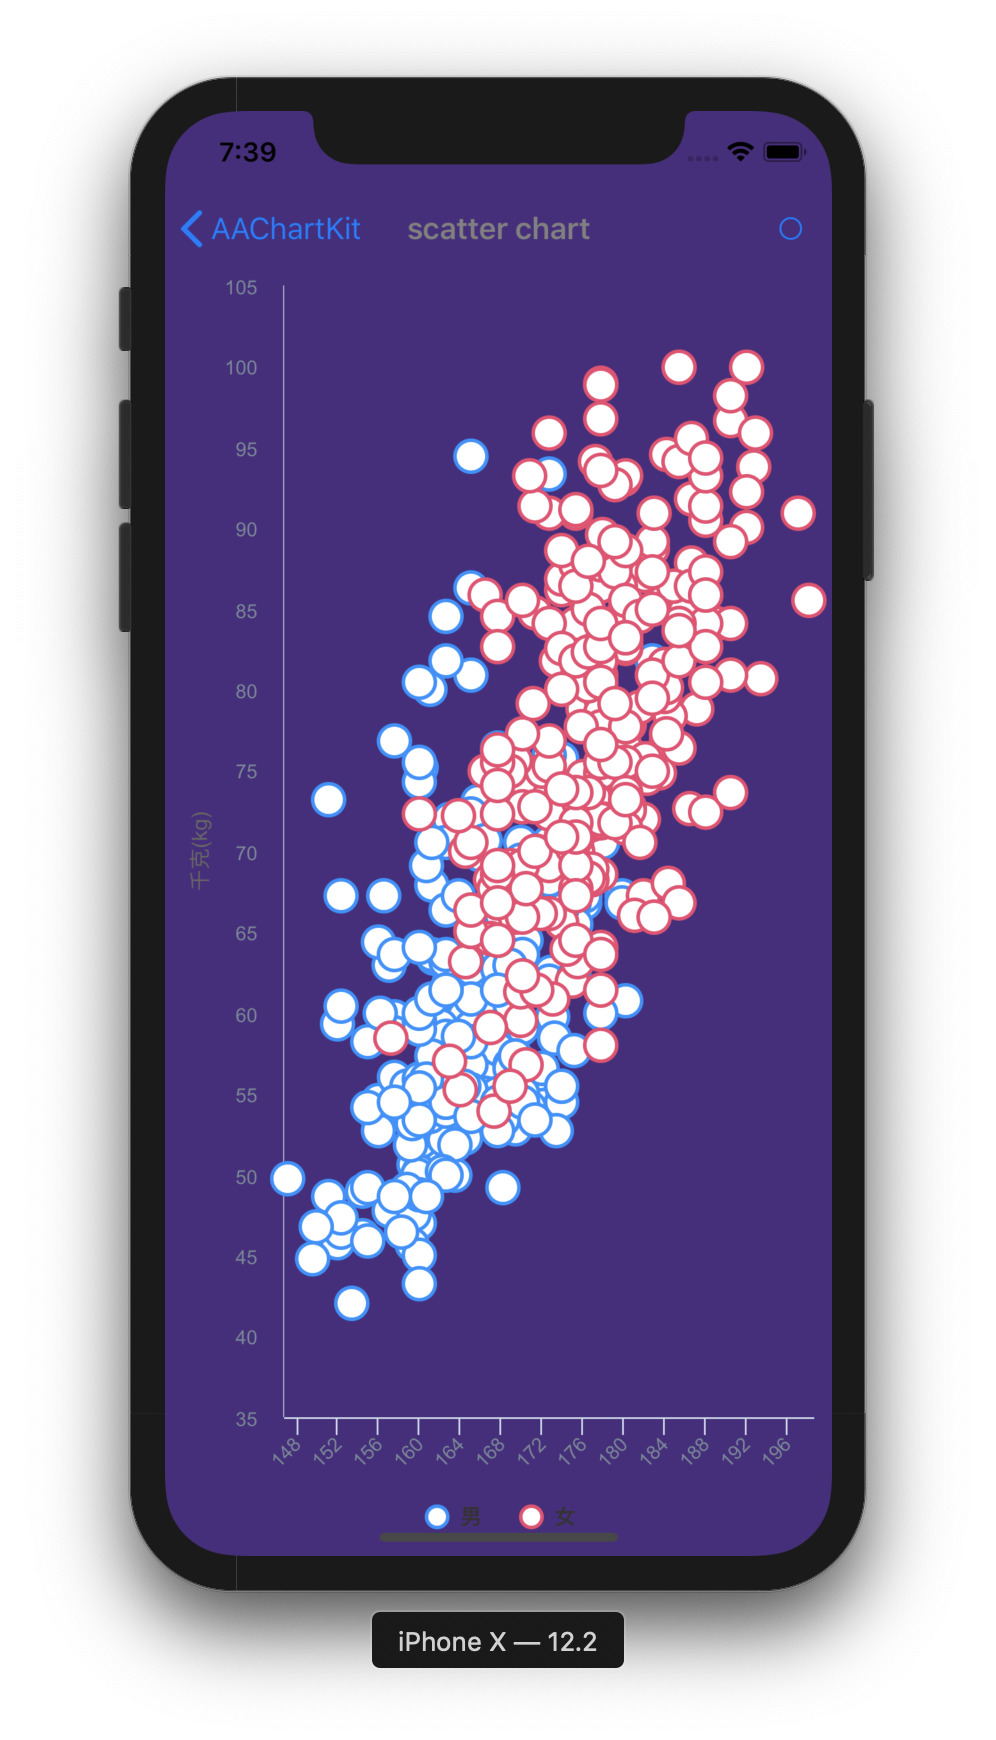
-
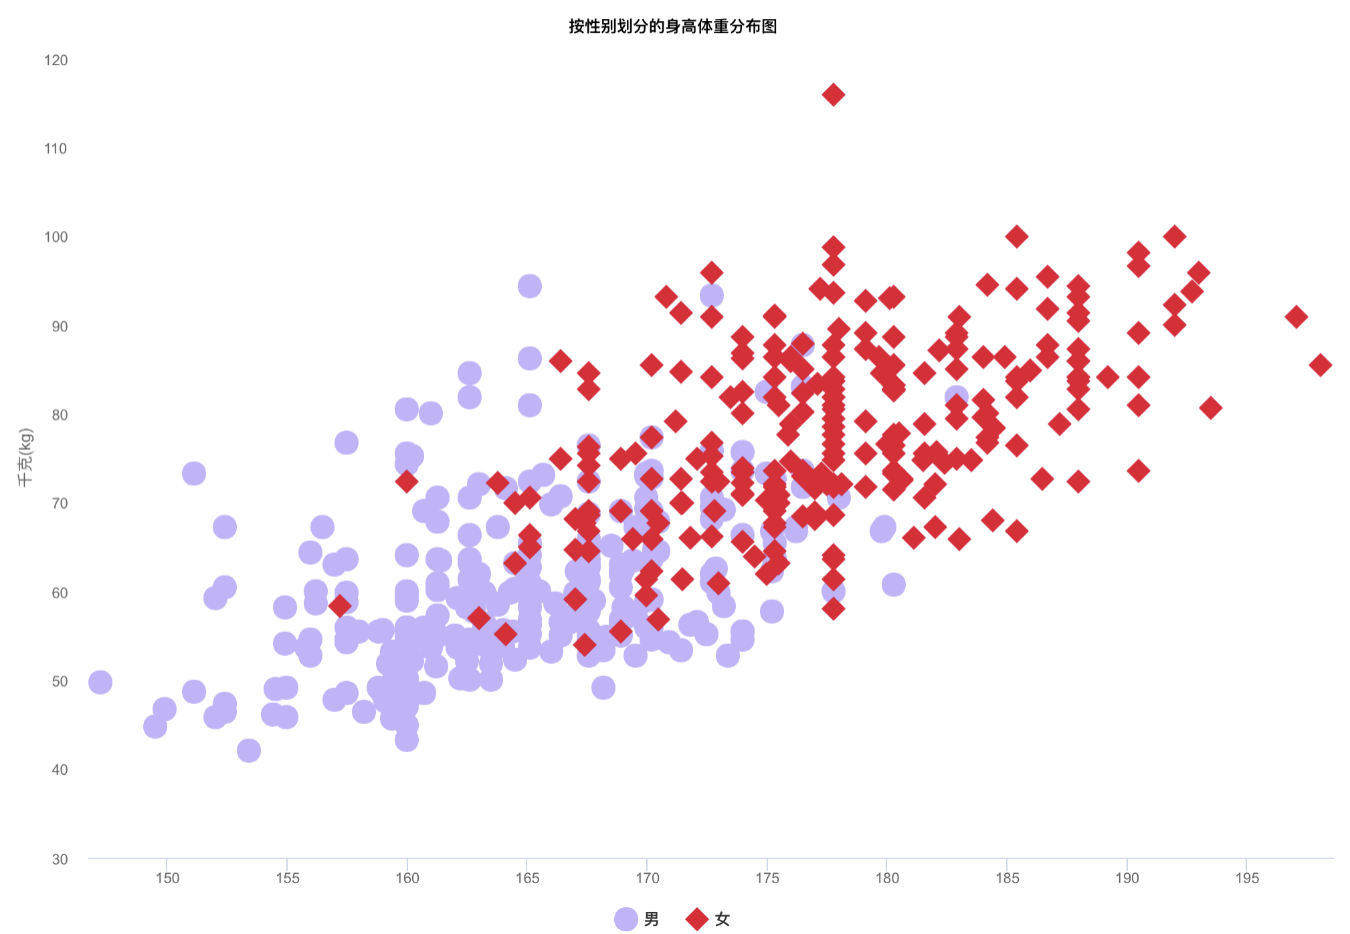
scatter chart
-
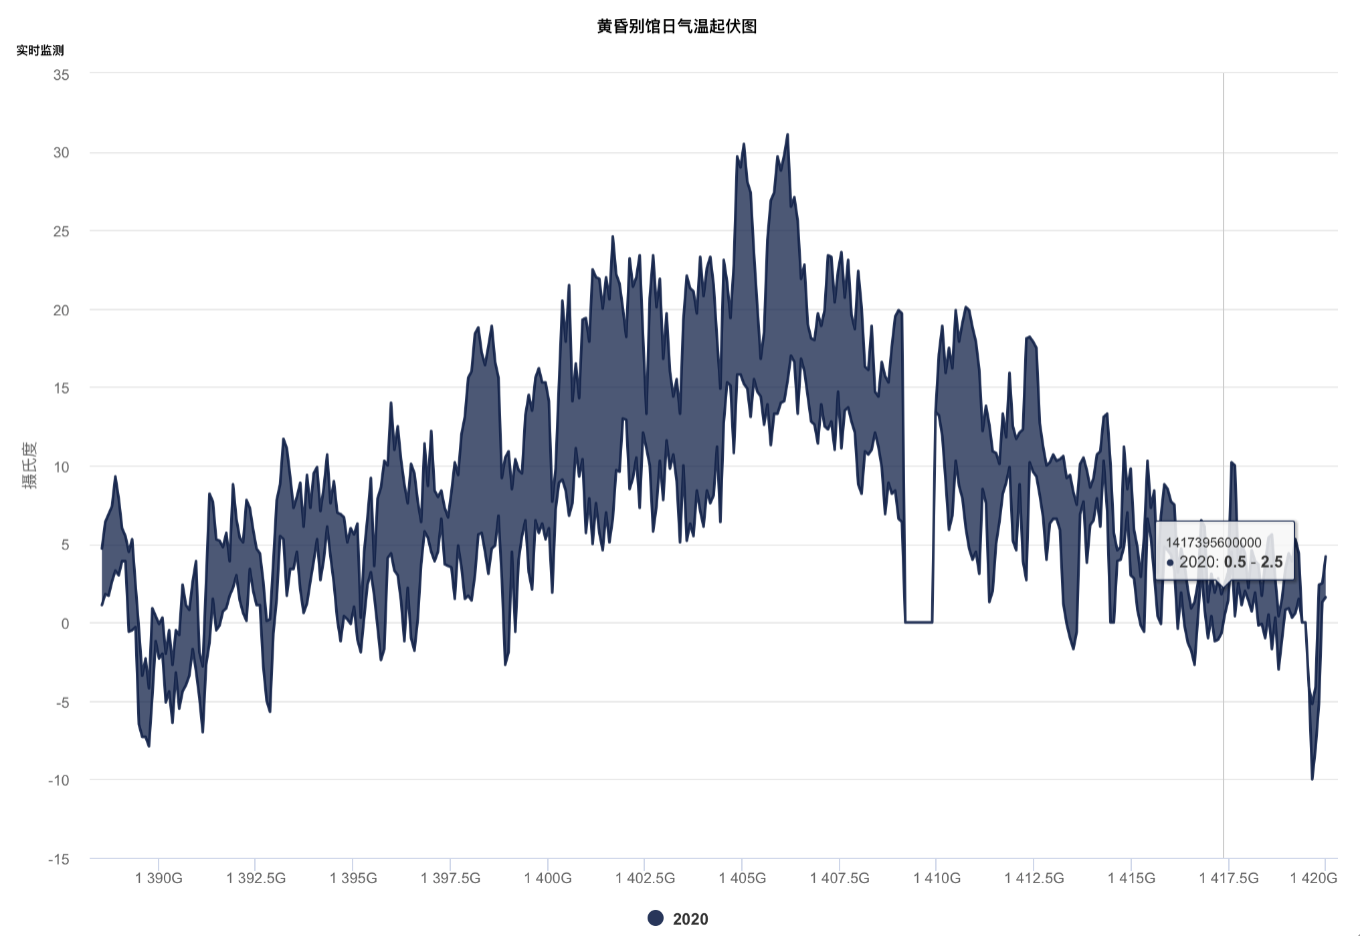
arearange chart
-
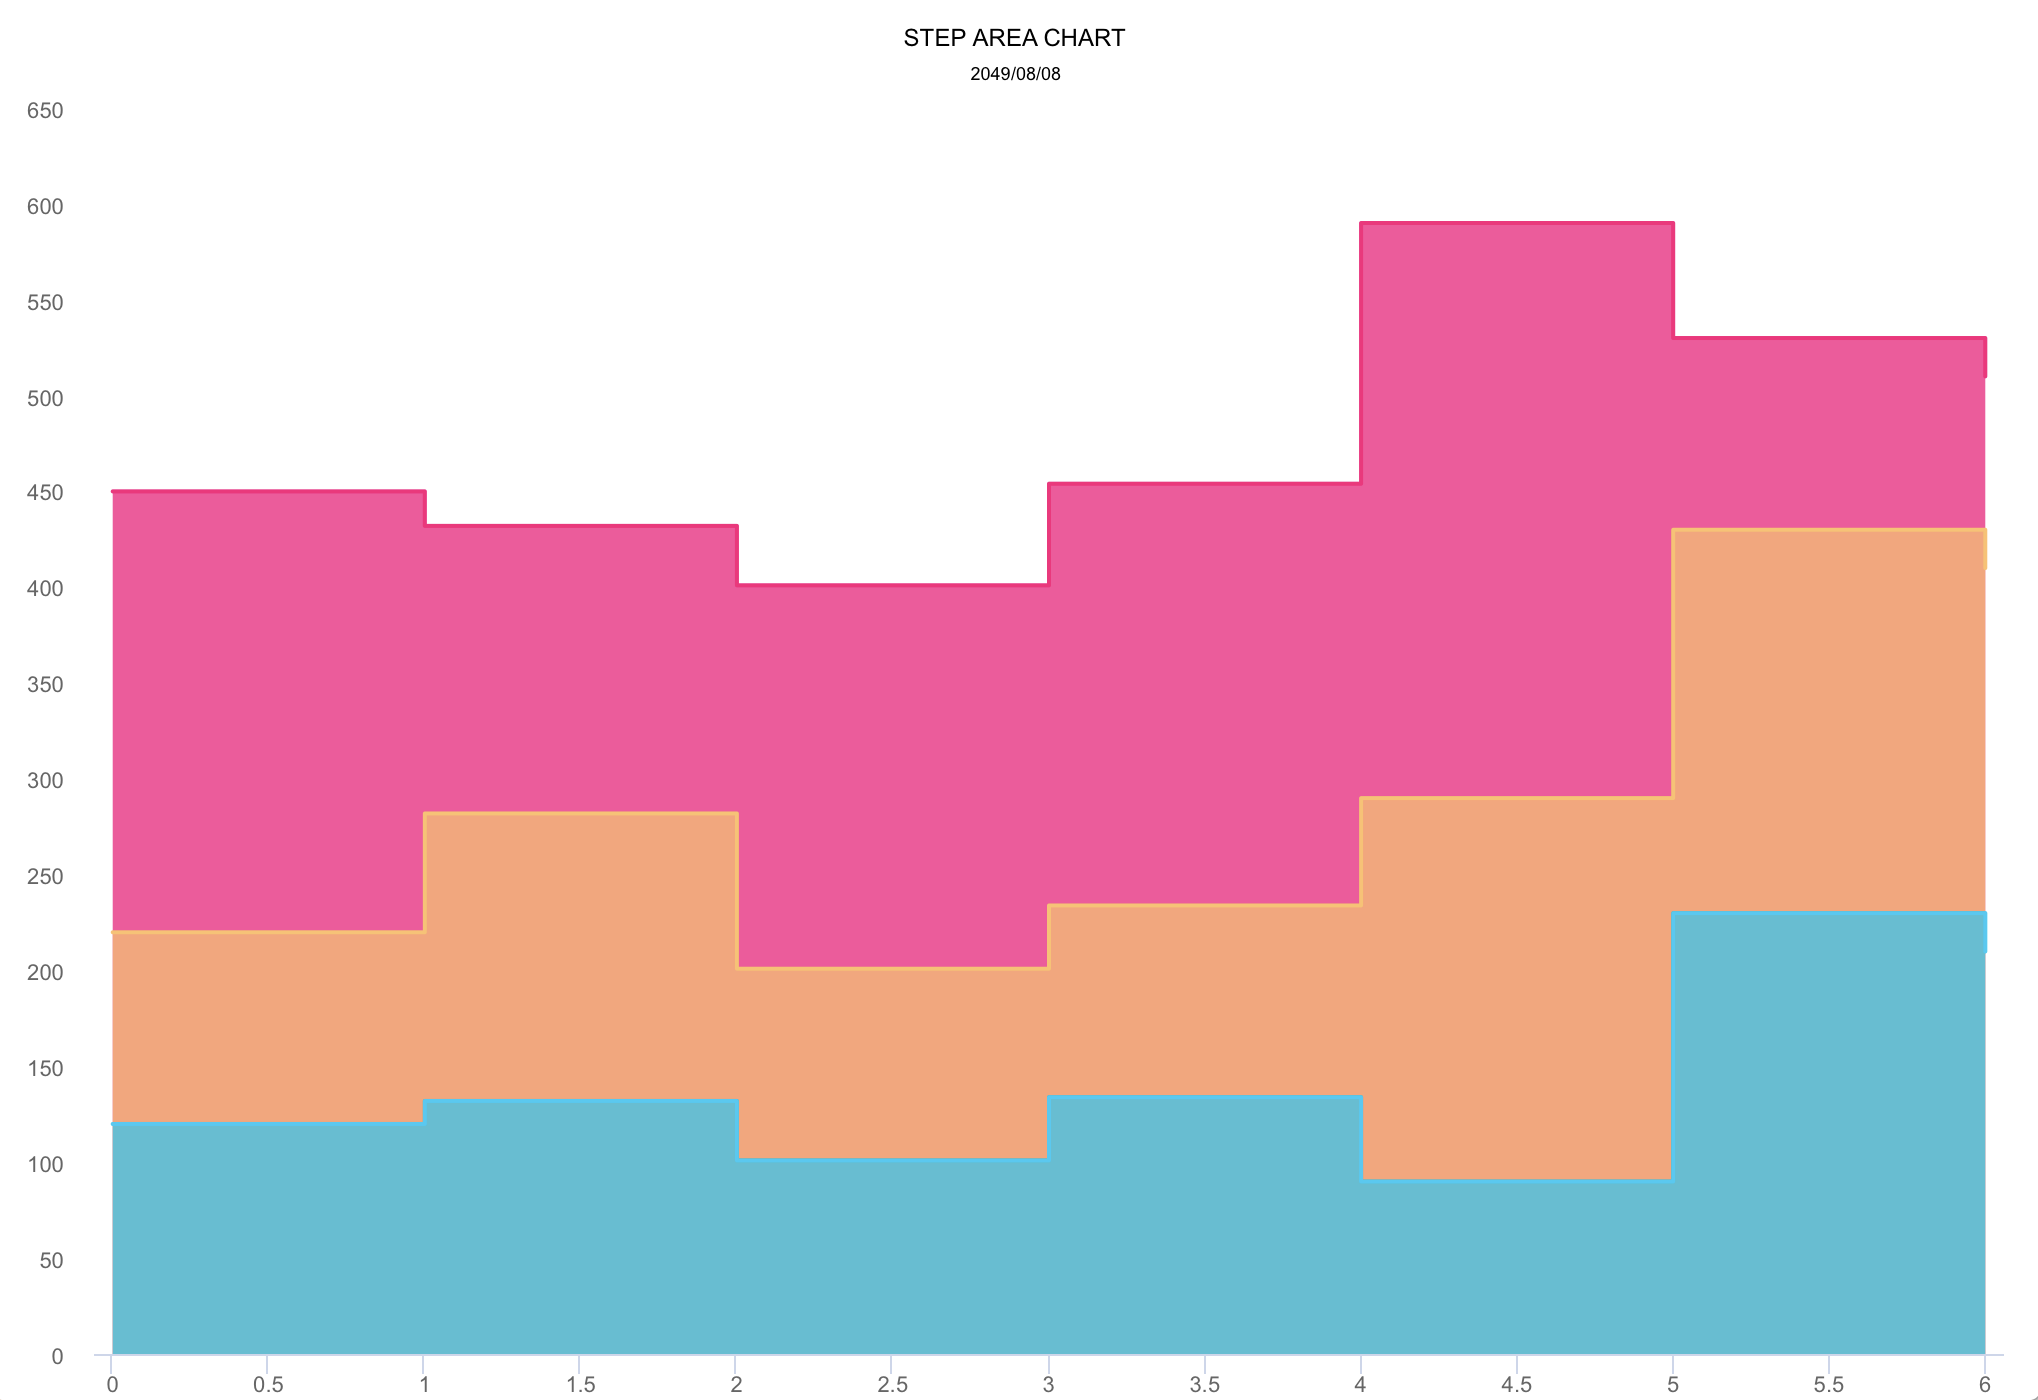
step area chart
-
mixed chart
More graphics
- Note: The following
DEMO pictureis aGIF dynamic picturewhich has a size of around 6M. If you don't see any dynamic preview, then this is because the picture resources were not fully loaded. In such a case please be patient and wait for the contents to finish loading. Maybe you need to reload this page.
Special instructions
Support user click events and move over events
you can monitor the user touch events message through implementing delegate function for AAChartView instance object
   interface AAChartViewCallBack {
        fun chartViewMoveOverEventMessage(aaChartView: AAChartView, messageModel: AAMoveOverEventMessageModel)
    }
The received touch events message contain following content
class AAMoveOverEventMessageModel {
    var name: String? = null
    var x: Double? = null
    var y: Double? = null
    var category: String? = null
    var offset: LinkedTreeMap<*, *>? = null
    var index: Double? = null
}
Support for custom the style of chart AATooltip through JavaScript function
As we all know, AAInfographics support using HTML String. Most of time, the headerFormat ãpointFormatãfooterFormat HTML string is enough for customizing chart tooltip string content, However, sometimes the needs of APP is so weird to satified, in this time, you can even customize the chart tooltip style through JavaScript function.
For example, configuring AATooltip instance object properties as follow:
val aaTooltip = AATooltip()
.useHTML(true)
.formatter(
"""
function () {
return ' ð ð ð ð ð ð ð ð <br/> '
+ ' Support JavaScript Function Just Right Now !!! <br/> '
+ ' The Gold Price For <b>2020 '
+ this.x
+ ' </b> Is <b> '
+ this.y
+ ' </b> Dollars ';
}
""".trimIndent()
)
.valueDecimals(2)//设置åå¼ç²¾ç¡®å°å°æ°ç¹åå ä½//设置åå¼ç²¾ç¡®å°å°æ°ç¹åå ä½
.backgroundColor("#000000")
.borderColor("#000000")
.style(
AAStyle()
.color("#FFD700")
.fontSize("12 px")
)
you can get the customized tooltip style chart like thisð

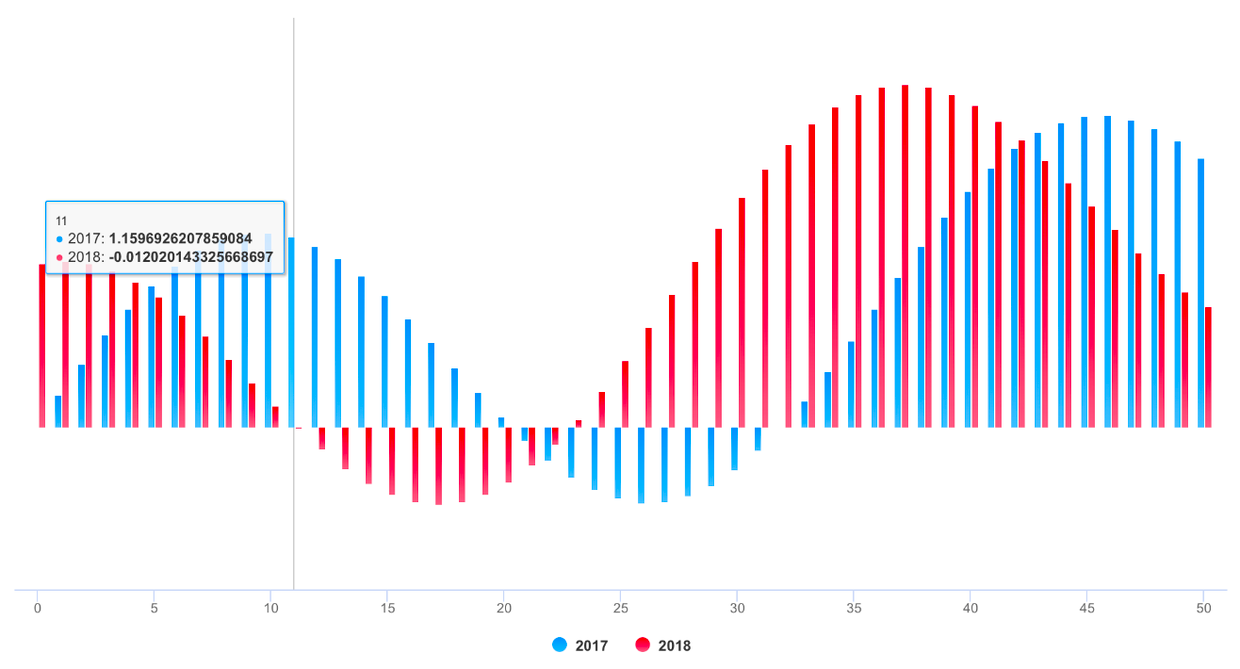
Support value range segmentation
-
chart with value range segmentation
bands ð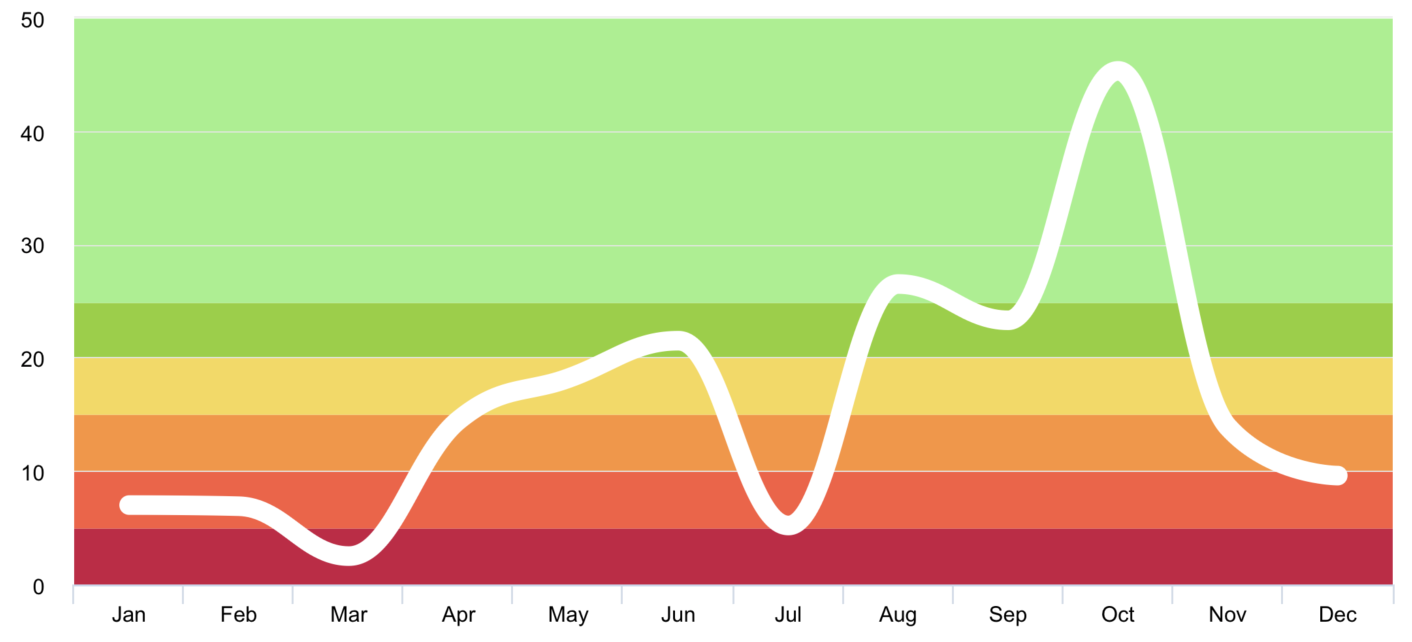
-
chart with value range segmentation
lines ð§¶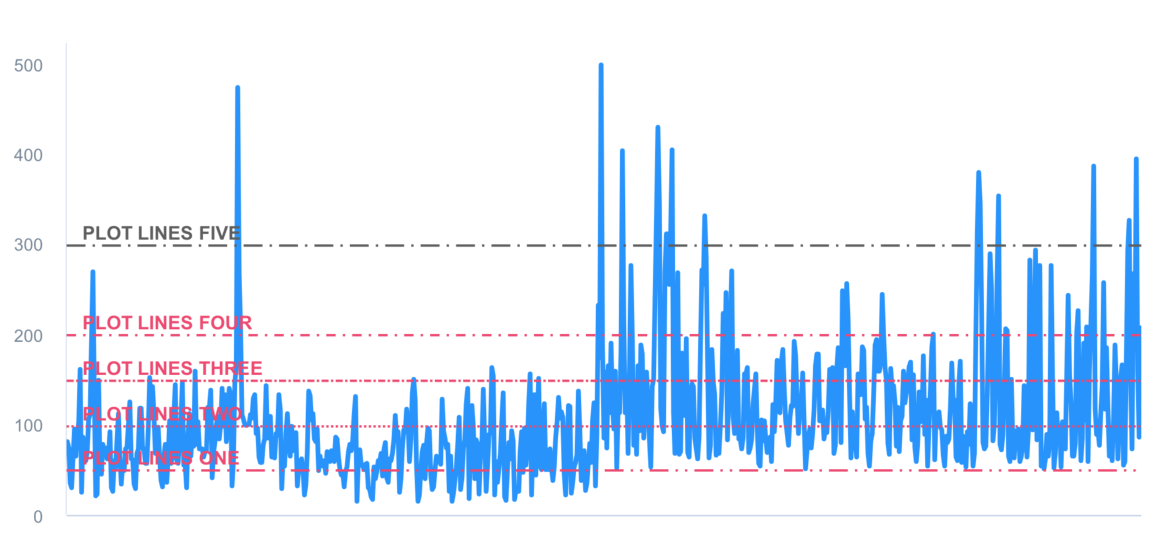
-
chart with value range segmentation
zones ð§±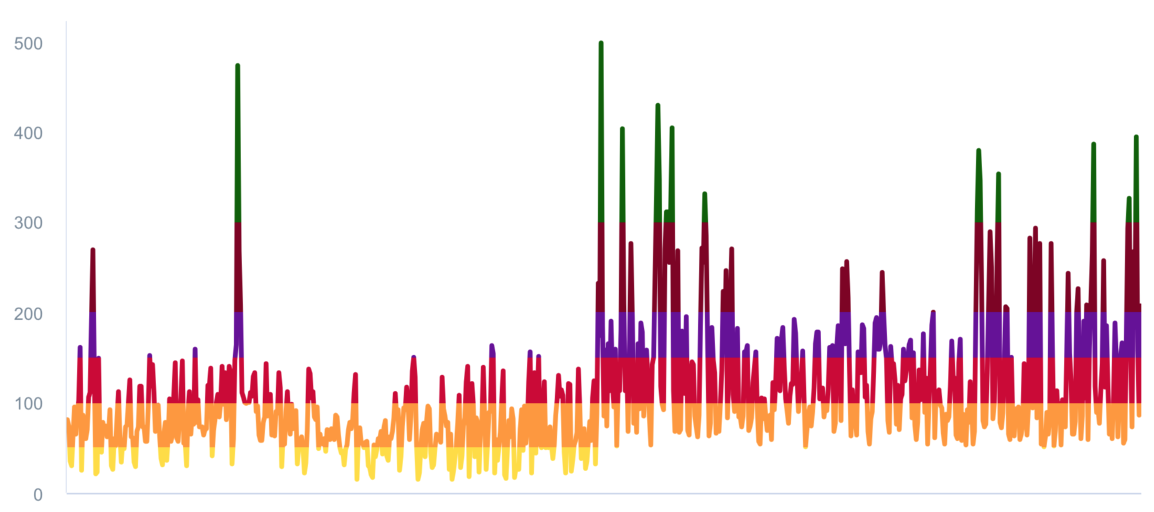
Support scrolling update chart data
Support data sorting with animation effect
Supported chart type for now
enum class AAChartType(val value: String) {
Column ("column"),
Bar ("bar"),
Area ("area"),
Areaspline ("areaspline"),
Line ("line"),
Spline ("spline"),
Scatter ("scatter"),
Pie ("pie"),
Bubble ("bubble"),
Pyramid ("pyramid"),
Funnel ("funnel"),
Columnrange ("columnrange"),
Arearange ("arearange"),
Areasplinerange ("areasplinerange"),
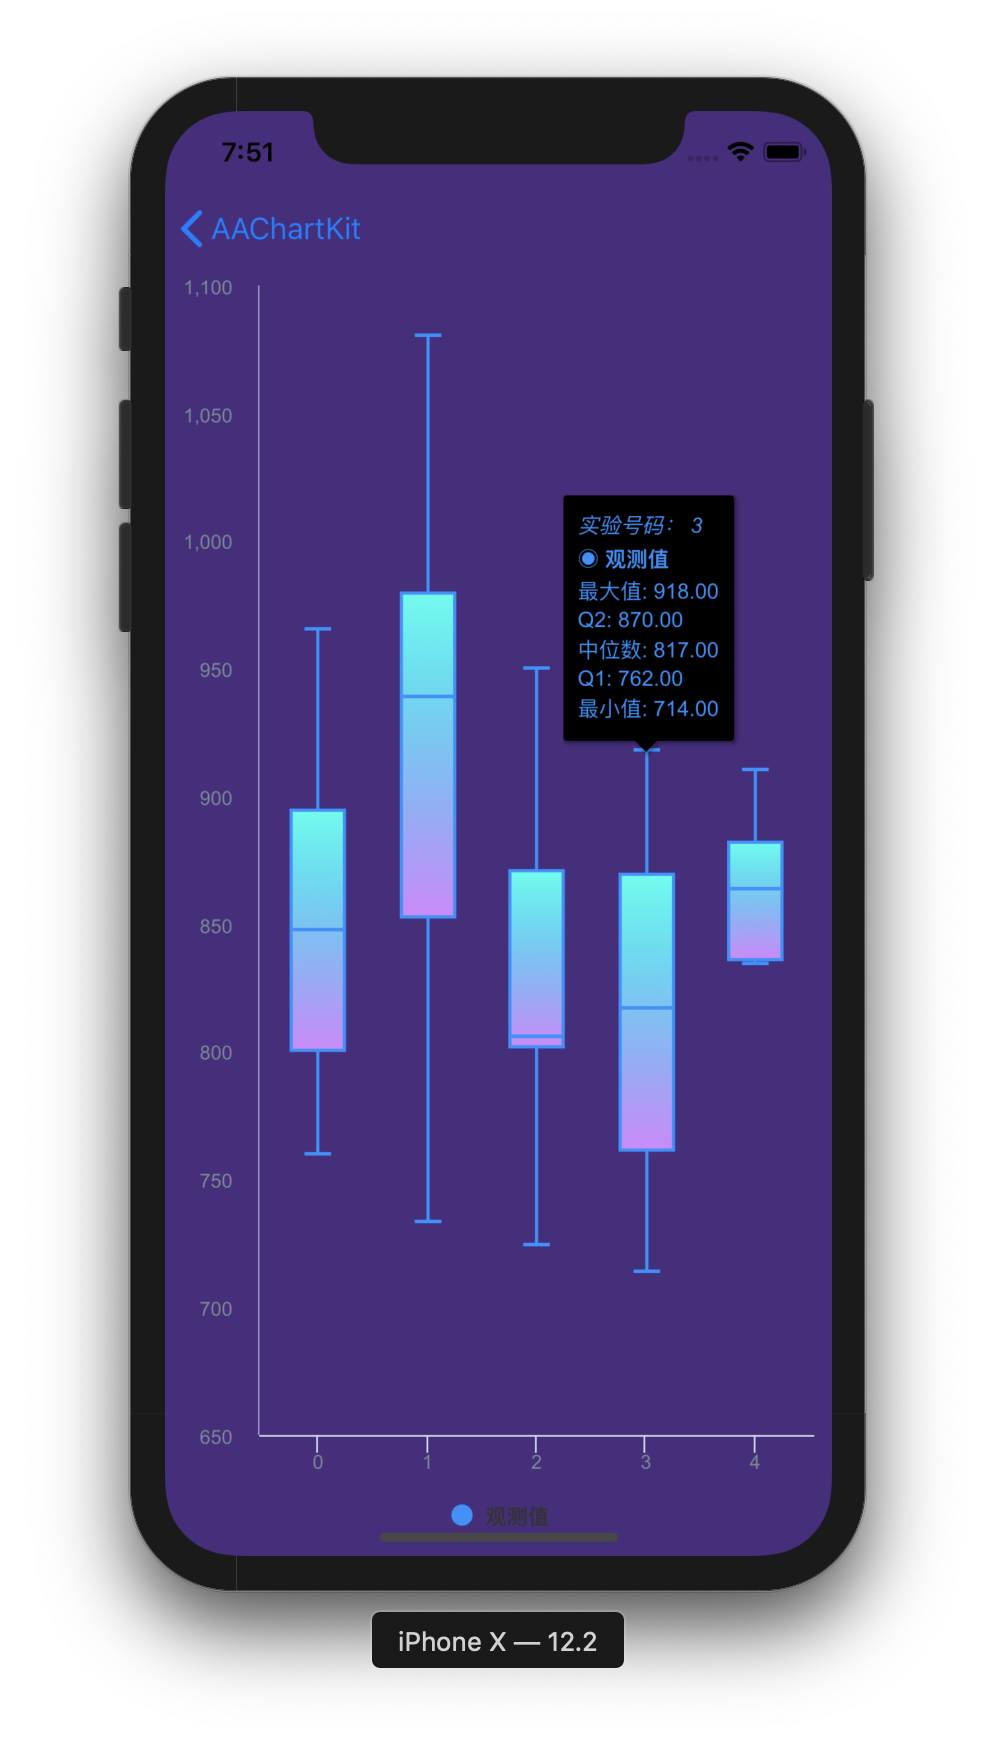
Boxplot ("boxplot"),
Waterfall ("waterfall"),
Polygon ("polygon")
}
Supported zoom guesture types for now
enum class AAChartZoomType(val value: String) {
    None ("none"),
    X    ("x"),
    Y    ("y"),
    XY   ("xy"),
}
Supported animation type for now
enum class AAChartAnimationType(val value :String){
    EaseInQuad     ("easeInQuad"),
    EaseOutQuad    ("easeOutQuad"),
    EaseInOutQuad  ("easeInOutQuad"),
    EaseInCubic    ("easeInCubic"),
    EaseOutCubic   ("easeOutCubic"),
    EaseInOutCubic ("easeInOutCubic"),
    EaseInQuart    ("easeInQuart"),
    EaseOutQuart   ("easeOutQuart"),
    EaseInOutQuart ("easeInOutQuart"),
    EaseInQuint    ("easeInQuint"),
    EaseOutQuint   ("easeOutQuint"),
    EaseInOutQuint ("easeInOutQuint"),
    EaseInSine     ("easeInSine"),
    EaseOutSine    ("easeOutSine"),
    EaseInOutSine  ("easeInOutSine"),
    EaseInExpo     ("easeInExpo"),
    EaseOutExpo    ("easeOutExpo"),
    EaseInOutExpo  ("easeInOutExpo"),
    EaseInCirc     ("easeInCirc"),
    EaseOutCirc    ("easeOutCirc"),
    EaseInOutCirc  ("easeInOutCirc"),
    EaseOutBounce  ("easeOutBounce"),
    EaseInBack     ("easeInBack"),
    EaseOutBack    ("easeOutBack"),
    EaseInOutBack  ("easeInOutBack"),
    Elastic        ("elastic"),
    SwingFromTo    ("swingFromTo"),
    SwingFrom      ("swingFrom"),
    SwingTo        ("swingTo"),
    Bounce         ("bounce"),
    BouncePast     ("bouncePast"),
    EaseFromTo     ("easeFromTo"),
    EaseFrom       ("easeFrom"),
    EaseTo         ("easeTo"),
}
Here are the ten concrete animation types of AAInfographics
| Back | Bounce | Circ | Cubic | Elastic |
|---|---|---|---|---|
 |  |  |  |  |
| Expo | Quad | Quart | Quint | Sine |
|---|---|---|---|---|
 |  |  |  |  |
About AAChartModel
-
AAChartModel:chart basic properties instruction
| Property name | Description | Value Range |
|---|---|---|
| title | The chart title | Any valid string |
| subtitle | The chart subtitle | Any valid string |
| chartType | The default series type for the chart. Can be any of the chart types listed under AAChartType. | AAChartType.Column, AAChartType.Bar, AAChartType.Area, AAChartType.AreaSpline, AAChartType.Line, AAChartType.Spline, AAChartType.Pie, AAChartType.Bubble, AAChartType.Scatter, AAChartType.Pyramid, AAChartType.Funnel, AAChartType.Arearange, AAChartType.Columnrange |
| stacking | Whether to stack the values of each series on top of each other. Possible values are null to disable, "normal" to stack by value or "percent". When stacking is enabled, data must be sorted in ascending X order | AAChartStackingType.None, AAChartStackingType.Normal, AAChartStackingType.Percent |
| symbol | A predefined shape or symbol for the marker. When null, the symbol is pulled from options.symbols. Other possible values are "circle", "square", "diamond", "triangle" and "triangle-down" | AAChartSymbolType.Circle, AAChartSymbolType.Square, AAChartSymbolType.Diamond, AAChartSymbolType.Triangle, AAChartSymbolType.TriangleDown |
| colorsTheme | the colors theme of chart style | default value is arrayOf("#fe117c", "#ffc069", "#06caf4", "#7dffc0") |
| series | the series data of chart | a list made of AASeriesElement instance objects ,every AASeriesElement has its own type ãnameãdataãcolorãopacity value ect |
More detailed chart property setting parameters can be found in the ʻAAChartModel and ʻAAOptions files. For details, please refer to the ʻAAChartCore-Kotlin(AAInfographics)` source code.
Created By

"CODE IS FAR AWAY FROM BUG WITH THE ANIMAL PROTECTING"
* ##2 ##2
* â-##1ã â-##1
* â_â â»---ââ_â»âââ
* âããã âãããã
* âãã âã âããã
* â @^ã @^ âãã
* âãããããã â
* âãã â»ããã â
* â_ããããã _â
* âââãããâââ
* ããâãããâç¥å
½ä¿ä½
* ããâãããâæ°¸æ BUGï¼
* ããâãããâââââ----|
* ããâããããããã â£â}}}
* ããâããããããã ââ
* ããââ&&&â-â&&&âââ-|
* ãããââ«â«ã ââ«â«
* ãããââ»âã ââ»â
*
*
"CODE IS FAR AWAY FROM BUG WITH THE ANIMAL PROTECTING"
Source Codeâ
| Language Version | Project Name | Source Code Link |
|---|---|---|
| Kotlin | AAInfographics | https://github.com/AAChartModel/AAChartCore-Kotlin |
| Java | AAChartCore | https://github.com/AAChartModel/AAChartCore |
| Swift | AAInfographics | https://github.com/AAChartModel/AAChartKit-Swift |
| Objective C | AAChartKit | https://github.com/AAChartModel/AAChartKit |
LICENSE
![]()
AAInfographics is available under the MIT license. See the LICENSE file for more information.
Contact
- ð ð ð ð WARM TIPS!!! ð ð ð ð
- Please contact me on GitHub,if there are any problems encountered in use.
- GitHub Issues : https://github.com/AAChartModel/AAChartCore-Kotlin/issues
- And if you want to contribute for this project, please contact me as well
- GitHub : https://github.com/AAChartModel
- StackOverflow : https://stackoverflow.com/users/7842508/codeforu
- JianShu : http://www.jianshu.com/u/f1e6753d4254
- SegmentFault : https://segmentfault.com/u/huanghunbieguan
Todo list
- Support for the user to add delegate events after the graphics content loading was completed
- Support graphics to refresh global content dynamically
- Support graphics to refresh pure data (
series) content dynamically - Support color layer gradient effects
- Support horizontal screen (full screen) effect
- Support setting graphics rendering animation freely
- Support for users to configure
AAOptionsmodel object properties freely - Support stacking the graphics
- Support reversing the graphics axis
- Support rendering the scatter chart
- Support rendering the column range map
- Support rendering the area range graph
- Support rendering the polar chart
- Support rendering the step line chart
- Support rendering the step area chart
- Support rendering the rectangular tree hierarchy diagrams
- Support rendering the circular progress bar chart
- Support adding clicked event callbacks for graphics
- Support graphics to refresh pure data in real time and scroll dynamically
- Support rendered graphics to generate image files
- Support generating image files saved to the system album
Top Related Projects
Android Graph Library for creating zoomable and scrollable line and bar graphs.
A powerful 🚀 Android chart view / graph view library, supporting line- bar- pie- radar- bubble- and candlestick charts as well as scaling, panning and animations.
Android Library to rapidly develop attractive and insightful charts in android applications.
Charts library for Android compatible with API 8+, several chart types with scaling, scrolling and animations 📊
AnyChart Android Chart is an amazing data visualization library for easily creating interactive charts in Android apps. It runs on API 19+ (Android 4.4) and features dozens of built-in chart types.
Make a cool intro for your Android app.
Convert designs to code with AI
Introducing Visual Copilot: A new AI model to turn Figma designs to high quality code using your components.
Try Visual Copilot