 MPAndroidChart
A powerful 🚀 Android chart view / graph view library, supporting line- bar- pie- radar- bubble- and candlestick charts as well as scaling, panning and animations.
Top Related Projects
Beautiful charts for iOS/tvOS/OSX! The Apple side of the crossplatform MPAndroidChart.
📈📊🚀🚀🚀An elegant modern declarative data visualization chart framework for iOS, iPadOS and macOS. Extremely powerful, supports line, spline, area, areaspline, column, bar, pie, scatter, angular gauges, arearange, areasplinerange, columnrange, bubble, box plot, error bars, funnel, waterfall and polar chart types. 极其精美而又强大的现代化声明式数据可视化图表框架,支持柱状图、条形图、折线图、曲线图、折线填充图、曲线填充图、气泡图、扇形图、环形图、散点图、雷达图、混合图等各种类型的多达几十种的信息图图表,完全满足工作所需.
FL Chart is a highly customizable Flutter chart library that supports Line Chart, Bar Chart, Pie Chart, Scatter Chart, Radar Chart and Candlestick Chart.
Promises for Swift & ObjC.
Android Graph Library for creating zoomable and scrollable line and bar graphs.
Quick Overview
MPAndroidChart is a powerful and flexible charting library for Android applications. It provides a wide range of chart types and customization options, allowing developers to create visually appealing and interactive charts with ease.
Pros
- Extensive chart types: Supports line, bar, pie, scatter, bubble, candlestick, and more chart types
- High performance: Optimized for handling large datasets and smooth animations
- Customizable: Offers numerous styling and configuration options for charts and their components
- Active development: Regularly updated with new features and bug fixes
Cons
- Steep learning curve: Due to its extensive features, it may take time to master all aspects of the library
- Limited documentation: While documentation exists, it may not cover all use cases or be as comprehensive as desired
- Android-specific: Not suitable for cross-platform development or web applications
Code Examples
- Creating a basic line chart:
val entries = ArrayList<Entry>()
for (i in 0 until 10) {
    entries.add(Entry(i.toFloat(), (Math.random() * 10).toFloat()))
}

val dataSet = LineDataSet(entries, "Sample Data")
val lineData = LineData(dataSet)

chart.data = lineData
chart.invalidate()
- Customizing chart appearance:
val dataSet = LineDataSet(entries, "Sample Data")
dataSet.color = Color.RED
dataSet.valueTextColor = Color.BLUE
dataSet.lineWidth = 2f
dataSet.setCircleColor(Color.GREEN)

chart.description.isEnabled = false
chart.setTouchEnabled(true)
chart.isDragEnabled = true
chart.setScaleEnabled(true)
- Adding animations to a bar chart:
val barDataSet = BarDataSet(entries, "Bar Data")
val barData = BarData(barDataSet)

chart.data = barData
chart.animateY(1000)
Getting Started
- Add the dependency to your app's
build.gradlefile:
dependencies {
    implementation 'com.github.PhilJay:MPAndroidChart:v3.1.0'
}
- Add the chart view to your layout XML:
<com.github.mikephil.charting.charts.LineChart
    android:id="@+id/chart"
    android:layout_width="match_parent"
    android:layout_height="match_parent" />
- Initialize and use the chart in your Activity or Fragment:
import com.github.mikephil.charting.charts.LineChart
import com.github.mikephil.charting.data.Entry
import com.github.mikephil.charting.data.LineData
import com.github.mikephil.charting.data.LineDataSet

class MainActivity : AppCompatActivity() {
    private lateinit var chart: LineChart

    override fun onCreate(savedInstanceState: Bundle?) {
        super.onCreate(savedInstanceState)
        setContentView(R.layout.activity_main)

        chart = findViewById(R.id.chart)
        // Configure and populate the chart
    }
}
Competitor Comparisons
Beautiful charts for iOS/tvOS/OSX! The Apple side of the crossplatform MPAndroidChart.
Pros of Charts
- Written in Swift, providing better performance and native iOS integration
- Supports both iOS and macOS platforms
- More modern and actively maintained codebase
Cons of Charts
- Limited to Apple platforms, not cross-platform like MPAndroidChart
- Smaller community and fewer resources compared to MPAndroidChart
- Steeper learning curve for developers not familiar with Swift
Code Comparison
MPAndroidChart (Java):
LineDataSet dataSet = new LineDataSet(entries, "Label");
LineData lineData = new LineData(dataSet);
chart.setData(lineData);
chart.invalidate();
Charts (Swift):
let dataSet = LineChartDataSet(entries: entries, label: "Label")
let data = LineChartData(dataSet: dataSet)
chartView.data = data
chartView.notifyDataSetChanged()
Both libraries offer similar functionality for creating charts, but Charts uses Swift syntax and conventions, while MPAndroidChart uses Java. The main difference lies in the language-specific features and the platforms they support. Charts is tailored for iOS and macOS development, while MPAndroidChart is designed for Android applications. Developers should choose based on their target platform and programming language preferences.
📈📊🚀🚀🚀An elegant modern declarative data visualization chart framework for iOS, iPadOS and macOS. Extremely powerful, supports line, spline, area, areaspline, column, bar, pie, scatter, angular gauges, arearange, areasplinerange, columnrange, bubble, box plot, error bars, funnel, waterfall and polar chart types. 极其精美而又强大的现代化声明式数据可视化图表框架,支持柱状图、条形图、折线图、曲线图、折线填充图、曲线填充图、气泡图、扇形图、环形图、散点图、雷达图、混合图等各种类型的多达几十种的信息图图表,完全满足工作所需.
Pros of AAChartKit
- Cross-platform support for iOS, Android, and web applications
- Simpler API and easier to use for basic charting needs
- Extensive customization options for chart appearance
Cons of AAChartKit
- Less comprehensive documentation compared to MPAndroidChart
- Fewer advanced chart types and features
- Smaller community and fewer third-party resources
Code Comparison
MPAndroidChart:
LineDataSet dataSet = new LineDataSet(entries, "Label");
LineData lineData = new LineData(dataSet);
chart.setData(lineData);
chart.invalidate();
AAChartKit:
let chartModel = AAChartModel()
    .chartType(.line)
    .title("Chart Title")
    .series([
        AASeriesElement()
            .name("Series Name")
            .data([1, 2, 3, 4, 5])
    ])
MPAndroidChart offers more granular control over chart elements, while AAChartKit provides a more concise and declarative approach to chart creation. MPAndroidChart is specifically designed for Android, offering deep integration with the platform, whereas AAChartKit aims for cross-platform compatibility at the expense of some platform-specific optimizations.
Both libraries have their strengths, with MPAndroidChart excelling in advanced customization and performance for Android, while AAChartKit offers simplicity and cross-platform support. The choice between them depends on the specific requirements of your project and the platforms you need to support.
FL Chart is a highly customizable Flutter chart library that supports Line Chart, Bar Chart, Pie Chart, Scatter Chart, Radar Chart and Candlestick Chart.
Pros of fl_chart
- Cross-platform support for Flutter, allowing development for both iOS and Android
- Simpler API and easier to use for basic charting needs
- More modern and actively maintained, with frequent updates
Cons of fl_chart
- Less feature-rich compared to MPAndroidChart
- Limited to Flutter projects, not suitable for native Android development
- Smaller community and fewer resources available online
Code Comparison
MPAndroidChart:
LineDataSet dataSet = new LineDataSet(entries, "Label");
LineData lineData = new LineData(dataSet);
chart.setData(lineData);
chart.invalidate();
fl_chart:
LineChartData data = LineChartData(
  lineBarsData: [
    LineChartBarData(spots: spots, isCurved: true),
  ],
);
LineChart(data);
Both libraries offer straightforward ways to create line charts, but fl_chart's syntax is more concise and Flutter-friendly. MPAndroidChart provides more customization options out of the box, while fl_chart focuses on simplicity and ease of use.
MPAndroidChart is specifically designed for Android development, offering deep integration with the Android ecosystem. fl_chart, being a Flutter library, provides cross-platform support but may lack some platform-specific optimizations.
Overall, the choice between these libraries depends on the project requirements, target platforms, and the developer's familiarity with the respective ecosystems.
Promises for Swift & ObjC.
Pros of PromiseKit
- Simplifies asynchronous programming in Swift and Objective-C
- Extensive ecosystem with extensions for popular iOS frameworks
- Robust error handling and chaining capabilities
Cons of PromiseKit
- Limited to iOS and macOS development, unlike MPAndroidChart's Android focus
- Steeper learning curve for developers new to promise-based programming
- Less suitable for data visualization tasks
Code Comparison
PromiseKit:
firstly {
    fetchUser()
}.then { user in
    fetchAvatar(for: user)
}.done { avatar in
    self.imageView.image = avatar
}.catch { error in
    print("Error: \(error)")
}
MPAndroidChart:
LineChart chart = findViewById(R.id.chart);
List<Entry> entries = new ArrayList<>();
entries.add(new Entry(1f, 10f));
entries.add(new Entry(2f, 20f));
LineDataSet dataSet = new LineDataSet(entries, "Label");
LineData lineData = new LineData(dataSet);
chart.setData(lineData);
chart.invalidate();
While PromiseKit excels in handling asynchronous operations and simplifying complex workflows, MPAndroidChart is specifically designed for creating charts and graphs in Android applications. The code examples demonstrate their different focuses, with PromiseKit handling asynchronous tasks and MPAndroidChart creating a simple line chart.
Android Graph Library for creating zoomable and scrollable line and bar graphs.
Pros of GraphView
- Simpler API and easier to use for basic charting needs
- Smaller library size, potentially reducing app bloat
- Better documentation and examples for beginners
Cons of GraphView
- Limited chart types and customization options
- Less active development and community support
- Fewer advanced features for complex data visualization
Code Comparison
MPAndroidChart:
LineChart chart = findViewById(R.id.chart);
LineDataSet dataSet = new LineDataSet(entries, "Label");
LineData lineData = new LineData(dataSet);
chart.setData(lineData);
chart.invalidate();
GraphView:
GraphView graph = findViewById(R.id.graph);
LineGraphSeries<DataPoint> series = new LineGraphSeries<>(dataPoints);
graph.addSeries(series);
Summary
MPAndroidChart offers more advanced features and customization options, making it suitable for complex charting needs. It has a steeper learning curve but provides greater flexibility. GraphView, on the other hand, is simpler to use and more lightweight, making it a good choice for basic charting requirements or projects with limited resources. The choice between the two depends on the specific needs of your project, the complexity of the charts you want to create, and your familiarity with charting libraries.
Convert  designs to code with AI

Introducing Visual Copilot: A new AI model to turn Figma designs to high quality code using your components.
Try Visual CopilotREADME

:zap: A powerful & easy to use chart library for Android :zap:
Charts is the iOS version of this library
Table of Contents
Gradle Setup
repositories {
    maven { url 'https://jitpack.io' }
}

dependencies {
    implementation 'com.github.PhilJay:MPAndroidChart:v3.1.0'
}
Maven Setup
<!-- <repositories> section of pom.xml -->
<repository>
    <id>jitpack.io</id>
   <url>https://jitpack.io</url>
</repository>

<!-- <dependencies> section of pom.xml -->
<dependency>
    <groupId>com.github.PhilJay</groupId>
    <artifactId>MPAndroidChart</artifactId>
    <version>v3.1.0</version>
</dependency>
Documentation :notebook_with_decorative_cover:
See the documentation for examples and general use of MPAndroidChart.
See the javadocs for more advanced documentation.
Examples :eyes:
Download the MPAndroidChart Example App or look at the source code.
Questions & Issues :thinking:
This repository's issue tracker is only for bugs and feature requests. The maintainers ask that you refrain from asking questions about how to use MPAndroidChart through the issue tracker.
Please read the documentation first, then ask all your questions on stackoverflow.com for the fastest answer.
Donations :heart:
This project needs you! If you would like to support this project's further development, the creator of this project or the continuous maintenance of this project, feel free to donate. Your donation is highly appreciated (and I love food, coffee and beer). Thank you!
PayPal
- Donate 5 $: Thank's for creating this project, here's a coffee (or some beer) for you!
- Donate 10 $: Wow, I am stunned. Let me take you to the movies!
- Donate 15 $: I really appreciate your work, let's grab some lunch!
- Donate 25 $: That's some awesome stuff you did right there, dinner is on me!
- Or you can also choose what you want to donate, all donations are awesome!
Social Media :fire:
If you like this library, please tell others about it :two_hearts: :two_hearts:
If you like, you can follow me on Twitter @PhilippJahoda.
More Examples :+1:
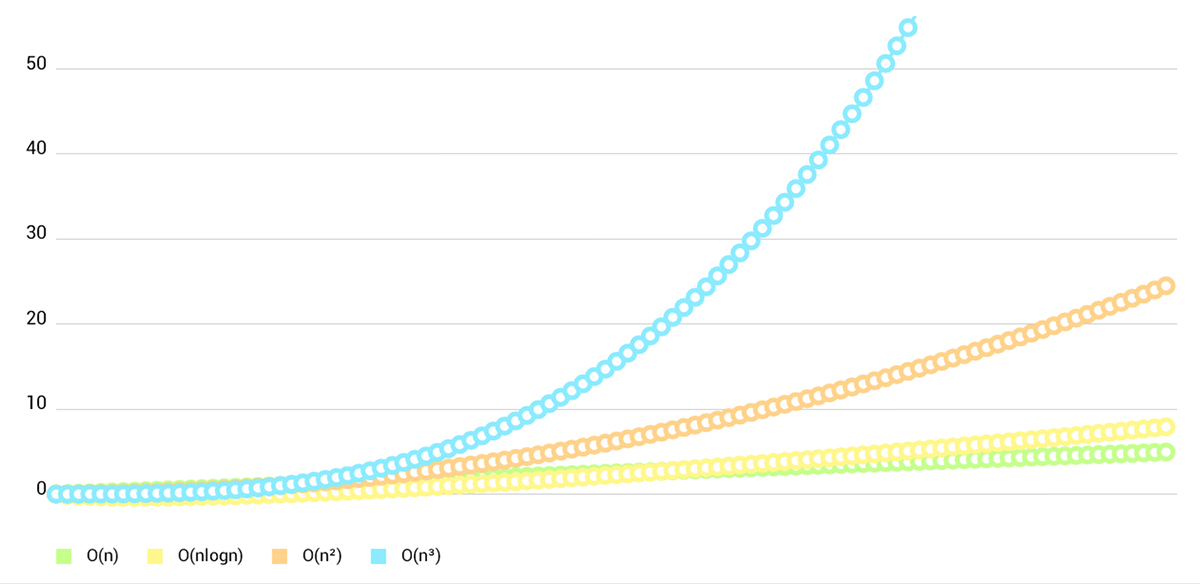
LineChart (with legend, simple design)

LineChart (with legend, simple design)

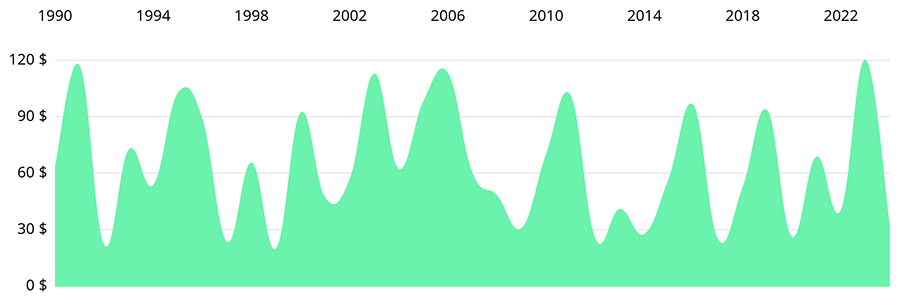
LineChart (cubic lines)

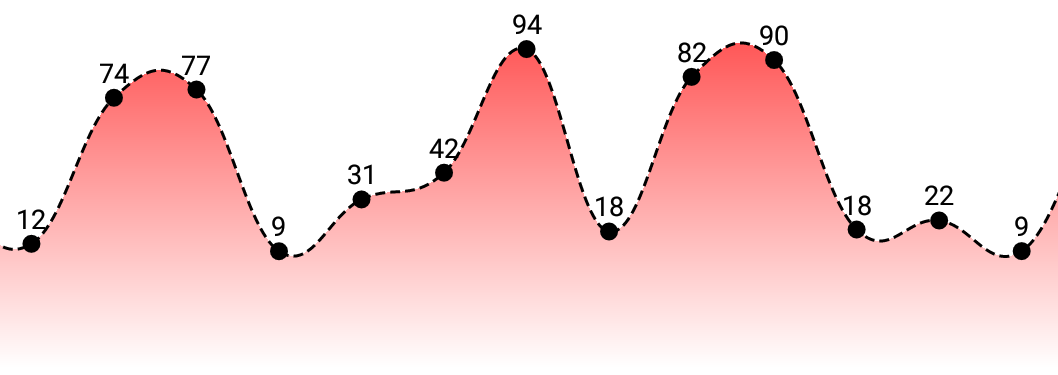
LineChart (gradient fill)

BarChart (with legend, simple design)

BarChart (grouped DataSets)

Horizontal-BarChart

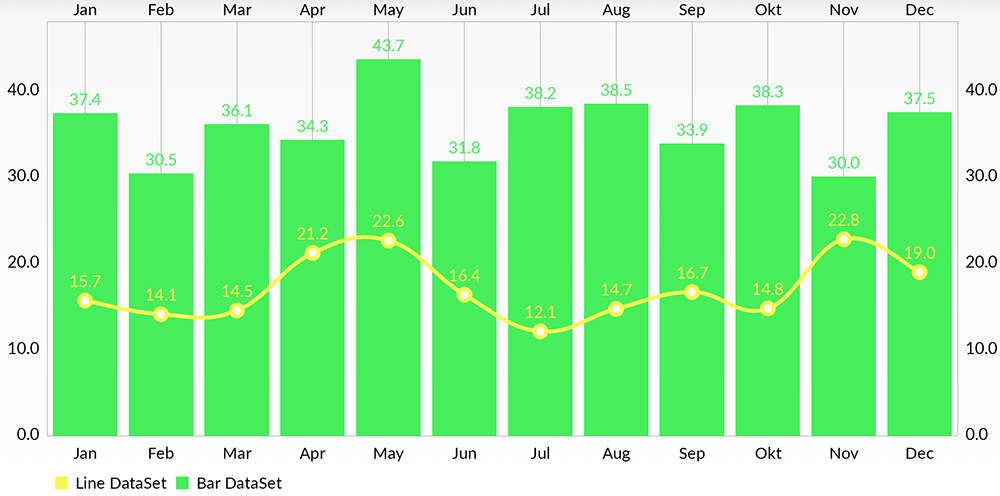
Combined-Chart (bar- and linechart in this case)

PieChart (with selection, ...)

ScatterChart (with squares, triangles, circles, ... and more)

CandleStickChart (for financial data)

BubbleChart (area covered by bubbles indicates the yValue)

RadarChart (spider web chart)

License :page_facing_up:
Copyright 2020 Philipp Jahoda
Licensed under the Apache License, Version 2.0 (the "License"); you may not use this file except in compliance with the License. You may obtain a copy of the License at
Unless required by applicable law or agreed to in writing, software distributed under the License is distributed on an "AS IS" BASIS, WITHOUT WARRANTIES OR CONDITIONS OF ANY KIND, either express or implied. See the License for the specific language governing permissions and limitations under the License.
Special Thanks :heart:
These people rock!
- danielgindi - Daniel Gindi
- mikegr - Michael Greifeneder
- tony - Tony
- almic - Mick A.
- jitpack.io - JitPack.io
Top Related Projects
Beautiful charts for iOS/tvOS/OSX! The Apple side of the crossplatform MPAndroidChart.
📈📊🚀🚀🚀An elegant modern declarative data visualization chart framework for iOS, iPadOS and macOS. Extremely powerful, supports line, spline, area, areaspline, column, bar, pie, scatter, angular gauges, arearange, areasplinerange, columnrange, bubble, box plot, error bars, funnel, waterfall and polar chart types. 极其精美而又强大的现代化声明式数据可视化图表框架,支持柱状图、条形图、折线图、曲线图、折线填充图、曲线填充图、气泡图、扇形图、环形图、散点图、雷达图、混合图等各种类型的多达几十种的信息图图表,完全满足工作所需.
FL Chart is a highly customizable Flutter chart library that supports Line Chart, Bar Chart, Pie Chart, Scatter Chart, Radar Chart and Candlestick Chart.
Promises for Swift & ObjC.
Android Graph Library for creating zoomable and scrollable line and bar graphs.
Convert  designs to code with AI

Introducing Visual Copilot: A new AI model to turn Figma designs to high quality code using your components.
Try Visual Copilot


