 Charts
Beautiful charts for iOS/tvOS/OSX! The Apple side of the crossplatform MPAndroidChart.
Top Related Projects
Beautiful charts for iOS/tvOS/OSX! The Apple side of the crossplatform MPAndroidChart.
A powerful 🚀 Android chart view / graph view library, supporting line- bar- pie- radar- bubble- and candlestick charts as well as scaling, panning and animations.
📈📊🚀🚀🚀An elegant modern declarative data visualization chart framework for iOS, iPadOS and macOS. Extremely powerful, supports line, spline, area, areaspline, column, bar, pie, scatter, angular gauges, arearange, areasplinerange, columnrange, bubble, box plot, error bars, funnel, waterfall and polar chart types. 极其精美而又强大的现代化声明式数据可视化图表框架,支持柱状图、条形图、折线图、曲线图、折线填充图、曲线填充图、气泡图、扇形图、环形图、散点图、雷达图、混合图等各种类型的多达几十种的信息图图表,完全满足工作所需.
Promises for Swift & ObjC.
The better way to deal with JSON data in Swift.
Quick Overview
Charts is a powerful and flexible charting library for iOS, tvOS, and macOS. It provides a wide range of chart types and customization options, making it easy to create beautiful and interactive visualizations in Swift applications. The library is built on top of Core Graphics, Core Animation, and Gesture Recognizer, ensuring high performance and smooth animations.
Pros
- Extensive chart types: Supports line, bar, scatter, pie, radar, and many other chart types
- High customization: Offers numerous options to customize colors, fonts, labels, and animations
- Swift-native: Written in Swift, providing a natural and idiomatic API for Swift developers
- Active community: Regular updates, bug fixes, and feature additions from a large contributor base
Cons
- Learning curve: Can be complex for beginners due to its extensive feature set
- Performance issues: May experience slowdowns with large datasets or complex animations
- Limited Android support: Primarily focused on Apple platforms, lacking direct Android compatibility
- Documentation gaps: Some advanced features or edge cases may lack comprehensive documentation
Code Examples
- Creating a basic line chart:
let entries = [ChartDataEntry(x: 1, y: 1), ChartDataEntry(x: 2, y: 3), ChartDataEntry(x: 3, y: 2)]
let dataSet = LineChartDataSet(entries: entries, label: "Line Chart")
let data = LineChartData(dataSet: dataSet)

let chart = LineChartView()
chart.data = data
view.addSubview(chart)
- Customizing chart appearance:
dataSet.colors = [.blue]
dataSet.circleColors = [.red]
dataSet.lineWidth = 2
dataSet.circleRadius = 6

chart.xAxis.labelPosition = .bottom
chart.rightAxis.enabled = false
chart.legend.enabled = true
chart.animate(xAxisDuration: 1.5)
- Adding multiple datasets to a bar chart:
let entries1 = [BarChartDataEntry(x: 1, y: 4), BarChartDataEntry(x: 2, y: 6), BarChartDataEntry(x: 3, y: 8)]
let entries2 = [BarChartDataEntry(x: 1, y: 2), BarChartDataEntry(x: 2, y: 4), BarChartDataEntry(x: 3, y: 6)]

let dataSet1 = BarChartDataSet(entries: entries1, label: "Dataset 1")
let dataSet2 = BarChartDataSet(entries: entries2, label: "Dataset 2")

let data = BarChartData(dataSets: [dataSet1, dataSet2])
barChartView.data = data
Getting Started
-
Install Charts using CocoaPods by adding the following to your Podfile:
pod 'Charts' -
Run
pod installin your project directory. -
Import Charts in your Swift file:
import Charts -
Create a chart view and add it to your view hierarchy:
let chartView = LineChartView(frame: CGRect(x: 0, y: 0, width: 300, height: 200)) view.addSubview(chartView) -
Populate the chart with data and customize as needed (refer to code examples above).
Competitor Comparisons
Beautiful charts for iOS/tvOS/OSX! The Apple side of the crossplatform MPAndroidChart.
Pros of Charts
- More comprehensive and feature-rich charting library
- Wider range of chart types and customization options
- Larger and more active community support
Cons of Charts
- Steeper learning curve due to more complex API
- Potentially heavier resource usage for simpler chart needs
- May require more setup and configuration
Code Comparison
Charts:
let chart = LineChartView()
chart.data = LineChartData(dataSets: [
    LineChartDataSet(entries: [ChartDataEntry(x: 1, y: 10),
                               ChartDataEntry(x: 2, y: 15),
                               ChartDataEntry(x: 3, y: 12)],
                     label: "Dataset 1")
])
Charts:
let chart = LineChartView()
chart.data = LineChartData(dataSets: [
    LineChartDataSet(entries: [ChartDataEntry(x: 1, y: 10),
                               ChartDataEntry(x: 2, y: 15),
                               ChartDataEntry(x: 3, y: 12)],
                     label: "Dataset 1")
])
Note: The code comparison shows identical snippets because both repositories refer to the same project. Charts is a single repository, and there isn't a separate ChartsOrg/Charts> repository to compare against.
A powerful 🚀 Android chart view / graph view library, supporting line- bar- pie- radar- bubble- and candlestick charts as well as scaling, panning and animations.
Pros of MPAndroidChart
- More comprehensive documentation and examples
- Wider range of chart types and customization options
- Larger and more active community, resulting in faster issue resolution
Cons of MPAndroidChart
- Steeper learning curve due to its extensive feature set
- Larger library size, which may impact app size and performance
- Less frequent updates compared to Charts
Code Comparison
MPAndroidChart:
LineChart chart = findViewById(R.id.chart);
LineDataSet dataSet = new LineDataSet(entries, "Label");
LineData lineData = new LineData(dataSet);
chart.setData(lineData);
chart.invalidate();
Charts:
let chart = LineChartView(frame: self.view.bounds)
let dataSet = LineChartDataSet(entries: entries, label: "Label")
let data = LineChartData(dataSet: dataSet)
chart.data = data
self.view.addSubview(chart)
Both libraries offer similar basic functionality for creating charts, but MPAndroidChart provides more advanced customization options out of the box. Charts, being Swift-based, integrates more seamlessly with iOS development workflows. The choice between the two often depends on the specific platform requirements and the level of chart complexity needed in the project.
📈📊🚀🚀🚀An elegant modern declarative data visualization chart framework for iOS, iPadOS and macOS. Extremely powerful, supports line, spline, area, areaspline, column, bar, pie, scatter, angular gauges, arearange, areasplinerange, columnrange, bubble, box plot, error bars, funnel, waterfall and polar chart types. 极其精美而又强大的现代化声明式数据可视化图表框架,支持柱状图、条形图、折线图、曲线图、折线填充图、曲线填充图、气泡图、扇形图、环形图、散点图、雷达图、混合图等各种类型的多达几十种的信息图图表,完全满足工作所需.
Pros of AAChartKit
- Supports both Objective-C and Swift, making it versatile for iOS developers
- Offers a wider variety of chart types, including some specialized options
- Provides more customization options for chart appearance and animations
Cons of AAChartKit
- Less mature and less widely adopted compared to Charts
- Documentation is not as comprehensive or well-organized
- May have a steeper learning curve for developers new to the library
Code Comparison
AAChartKit:
let aaChartModel = AAChartModel()
    .chartType(.area)
    .title("Sales Data")
    .series([
        AASeriesElement()
            .name("Tokyo")
            .data([7.0, 6.9, 9.5, 14.5, 18.2, 21.5, 25.2, 26.5, 23.3, 18.3, 13.9, 9.6])
    ])
Charts:
let chartView = LineChartView()
let dataSet = LineChartDataSet(entries: [
    ChartDataEntry(x: 0, y: 10),
    ChartDataEntry(x: 1, y: 5),
    ChartDataEntry(x: 2, y: 7),
    ChartDataEntry(x: 3, y: 12)
], label: "Sales")
let data = LineChartData(dataSet: dataSet)
chartView.data = data
Both libraries offer straightforward ways to create charts, but AAChartKit's syntax is more fluent and chainable, while Charts uses a more traditional object-oriented approach.
Promises for Swift & ObjC.
Pros of PromiseKit
- Simplifies asynchronous programming and error handling
- Extensive documentation and community support
- Supports multiple programming languages beyond Swift
Cons of PromiseKit
- Steeper learning curve for developers new to promises
- May introduce unnecessary complexity for simple tasks
- Less focused on data visualization compared to Charts
Code Comparison
PromiseKit:
firstly {
    fetchUser()
}.then { user in
    fetchAvatar(for: user)
}.done { avatar in
    self.imageView.image = avatar
}.catch { error in
    self.show(error)
}
Charts:
let dataSet = LineChartDataSet(entries: entries, label: "Sales")
let data = LineChartData(dataSet: dataSet)
chartView.data = data
chartView.animate(xAxisDuration: 2.0)
chartView.notifyDataSetChanged()
PromiseKit focuses on managing asynchronous operations and handling their results, while Charts is specifically designed for creating and customizing various types of charts and graphs. PromiseKit offers a more general-purpose solution for managing complex asynchronous workflows, whereas Charts excels in data visualization tasks. The choice between the two depends on the specific requirements of your project.
The better way to deal with JSON data in Swift.
Pros of SwiftyJSON
- Focused on JSON parsing and manipulation, making it lightweight and specialized
- Simple and intuitive API for working with JSON data
- Supports both mutable and immutable JSON structures
Cons of SwiftyJSON
- Limited in scope compared to Charts' comprehensive charting capabilities
- May require additional libraries for data visualization tasks
- Less frequent updates and maintenance compared to Charts
Code Comparison
SwiftyJSON:
let json = JSON(data: dataFromNetworking)
if let name = json["user"]["name"].string {
    // Do something with name
}
Charts:
let chart = LineChartView()
let dataSet = LineChartDataSet(entries: entries, label: "Sales")
let data = LineChartData(dataSet: dataSet)
chart.data = data
Summary
SwiftyJSON is a focused library for JSON handling in Swift, offering a simple API for parsing and manipulating JSON data. It's lightweight and easy to use but limited in scope compared to Charts. Charts, on the other hand, is a comprehensive charting library that provides a wide range of data visualization options. While SwiftyJSON excels in JSON processing, Charts is better suited for creating various types of charts and graphs. The choice between the two depends on the specific needs of your project – JSON handling or data visualization.
Convert  designs to code with AI

Introducing Visual Copilot: A new AI model to turn Figma designs to high quality code using your components.
Try Visual CopilotREADME
Version 4.0.0, synced to MPAndroidChart #f6a398b
Just a heads up: Charts 5.0 has some breaking changes. Charts has now been renamed DGCharts to prevent conflicts with Apple's new Swift Charts. Please read the release/migration notes.
One more heads up: As Swift evolves, if you are not using the latest Swift compiler, you shouldn't check out the master branch. Instead, you should go to the release page and pick up whatever suits you.
- Xcode 14 / Swift 5.7 (master branch)
- iOS >= 12.0 (Use as an Embedded Framework)
- tvOS >= 12.0
- macOS >= 10.13
Okay so there's this beautiful library called MPAndroidChart by Philipp Jahoda which has become very popular amongst Android developers, but there was no decent solution to create charts for iOS.
I've chosen to write it in Swift as it can be highly optimized by the compiler, and can be used in both Swift and ObjC project. The demo project is written in ObjC to demonstrate how it works.
An amazing feature of this library now, for Android, iOS, tvOS and macOS, is the time it saves you when developing for both platforms, as the learning curve is singleton- it happens only once, and the code stays very similar so developers don't have to go around and re-invent the app to produce the same output with a different library. (And that's not even considering the fact that there's not really another good choice out there currently...)
Having trouble running the demo?
ChartsDemo/ChartsDemo.xcodeprojis the demo project for iOS/tvOSChartsDemo-OSX/ChartsDemo-OSX.xcodeprojis the demo project for macOS- Make sure you are running a supported version of Xcode.
- Usually it is specified here a few lines above.
- In most cases it will be the latest Xcode version.
- Make sure that your project supports Swift 5.0
- Optional: Run
carthage checkoutin the project folder, to fetch dependencies (i.e testing dependencies).- If you don't have Carthage - you can get it here.
Usage
In order to correctly compile:
- Drag the
DGCharts.xcodeprojto your project - Go to your target's settings, hit the "+" under the "Frameworks, Libraries, and Embedded Content" section, and select the DGCharts.framework
@import DGCharts- When using Swift in an ObjC project:
- You need to import your Bridging Header. Usually it is "YourProject-Swift.h", so in ChartsDemo it's "ChartsDemo-Swift.h". Do not try to actually include "ChartsDemo-Swift.h" in your project :-)
- (Xcode 8.1 and earlier) Under "Build Options", mark "Embedded Content Contains Swift Code"
- (Xcode 8.2+) Under "Build Options", mark "Always Embed Swift Standard Libraries"
- When using Realm.io:
- Note that the Realm framework is not linked with Charts - it is only there for optional bindings. Which means that you need to have the framework in your project, and in a compatible version to whatever is compiled with DGCharts. We will do our best to always compile against the latest version.
- You'll need to add
ChartsRealmas a dependency too.
3rd party tutorials
Video tutorials
- Chart in Swift - Setting Up a Basic Line Chart Using iOS Charts(Alex Nagy)
- Charts Framework in SwiftUI - Bar Chart (Stewart Lynch)
Blog posts
- Using Realm and Charts with Swift 3 in iOS 10 (Sami Korpela)
- Creating a Line Chart in Swift 3 and iOS 10 (Osian Smith)
- Beginning Set-up and Example Using Charts with Swift 3
- Creating a Radar Chart in Swift (David Piper)
- Plotting in IOS using Charts framework with SwiftUI (Evgeny Basisty)
- Set Up a Basic Bar Chart Using iOS-Charts (Penny Huang)
- iOS-Charts Tutorial: Highlight Selected Value With a Custom Marker (Penny Huang)
- Drawing Charts in iOS Before SwiftUI (Gennady Stepanov)
Want your tutorial to show here? Create a PR!
Troubleshooting
Can't compile?
- Please note the difference between installing a compiled framework from CocoaPods or Carthage, and copying the source code.
- Please read the Usage section again.
- Search in the issues
- Try to politely ask in the issues section
Other problems / feature requests
- Search in the issues
- Try to politely ask in the issues section
CocoaPods Install
Add pod 'DGCharts' to your Podfile. "DGCharts" is the name of the library.
For Realm support, please add pod 'ChartsRealm' too.
Note: pod 'ios-charts'
Carthage Install
DGCharts now include Carthage prebuilt binaries.
github "danielgindi/Charts" == 5.1.0
github "danielgindi/Charts" ~> 5.1.0
In order to build the binaries for a new release, use carthage build --no-skip-current && carthage archive Charts.
Swift Package Manager Install
Swift Package Manager
dependencies: [
    .package(url: "https://github.com/danielgindi/Charts.git", .upToNextMajor(from: "5.1.0"))
]
3rd party bindings
Xamarin (by @Flash3001): iOS - GitHub/NuGet. Android - GitHub/NuGet.
Help
If you like what you see here, and want to support the work being done in this repository, you could:
- Contribute code, issues and pull requests
- Let people know this library exists (:fire: spread the word :fire:)
 (You can buy me a beer, or you can buy me dinner :-)
Note: The author of MPAndroidChart is the reason that this library exists, and is accepting donations on his page. He deserves them!
Questions & Issues
If you are having questions or problems, you should:
- Make sure you are using the latest version of the library. Check the release-section.
- Study the Android version's Documentation-Wiki
- Search or open questions on stackoverflow with the
ios-chartstag - Search known issues for your problem (open and closed)
- Create new issues (please :fire: search known issues before :fire:, do not create duplicate issues)
Features
Core features:
- 8 different chart types
- Scaling on both axes (with touch-gesture, axes separately or pinch-zoom)
- Dragging / Panning (with touch-gesture)
- Combined-Charts (line-, bar-, scatter-, candle-stick-, bubble-)
- Dual (separate) Axes
- Customizable Axes (both x- and y-axis)
- Highlighting values (with customizable popup-views)
- Save chart to camera-roll / export to PNG/JPEG
- Predefined color templates
- Legends (generated automatically, customizable)
- Animations (build up animations, on both x- and y-axis)
- Limit lines (providing additional information, maximums, ...)
- Fully customizable (paints, typefaces, legends, colors, background, gestures, dashed lines, ...)
- Plotting data directly from Realm.io mobile database (here)
Chart types:
Screenshots are currently taken from the original repository, as they render exactly the same :-)
-
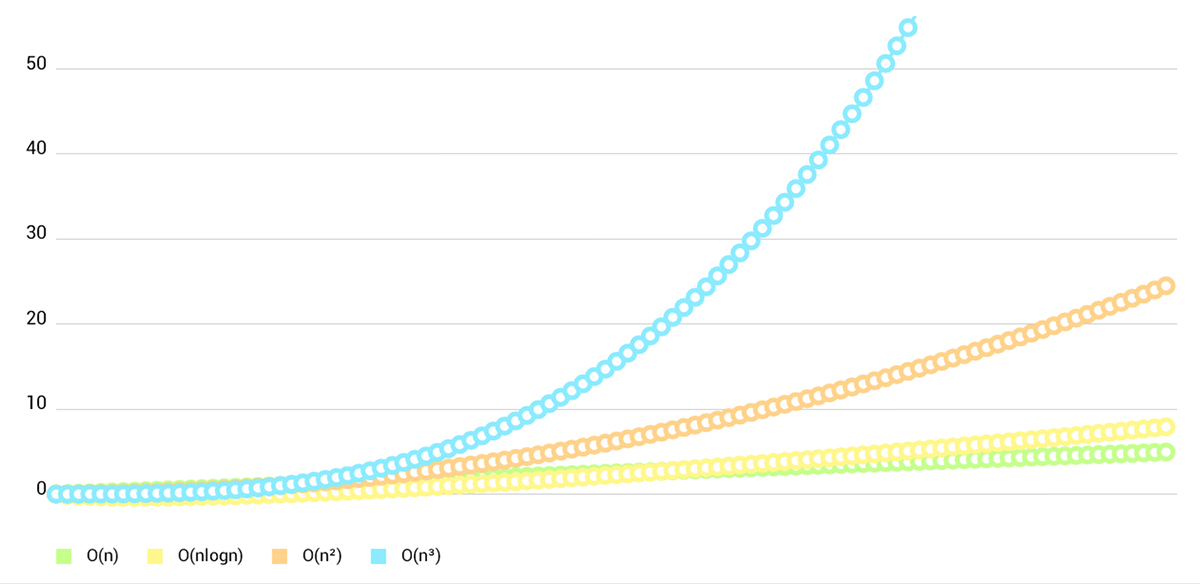
LineChart (with legend, simple design)

-
LineChart (with legend, simple design)

-
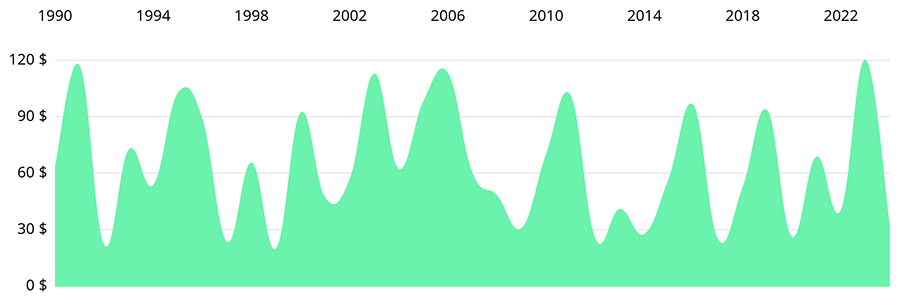
LineChart (cubic lines)

-
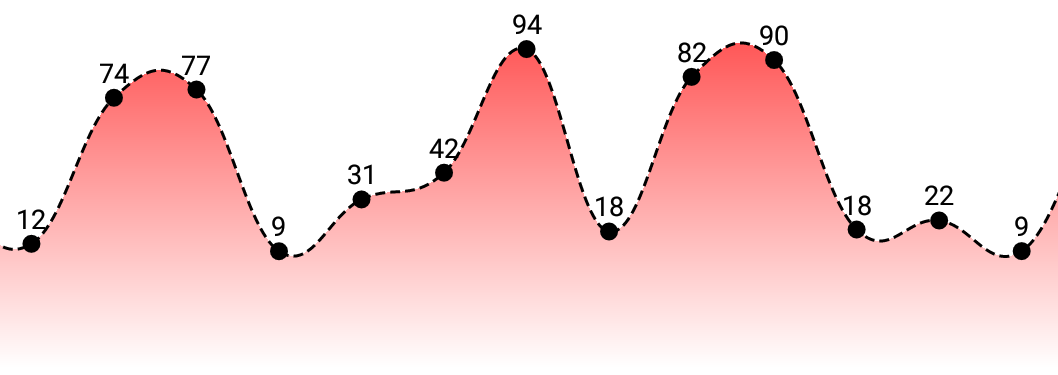
LineChart (gradient fill)

-
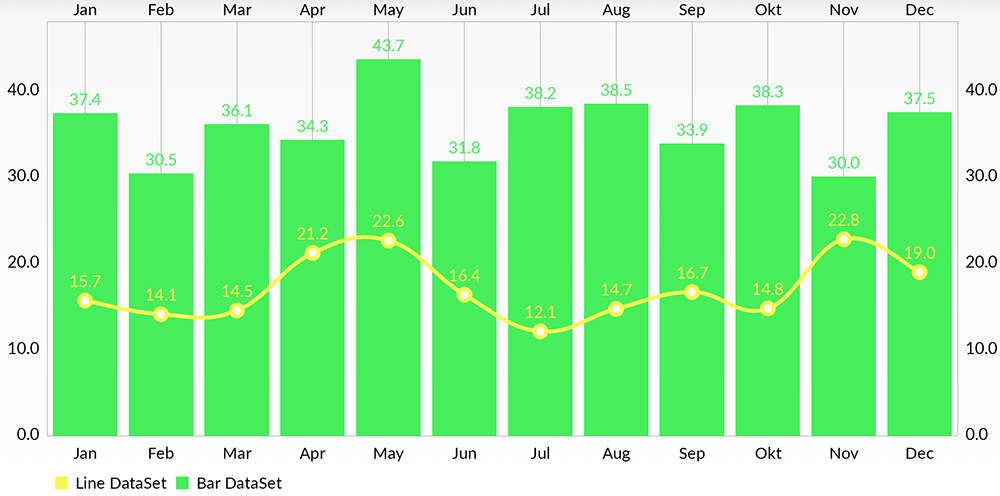
Combined-Chart (bar- and linechart in this case)

-
BarChart (with legend, simple design)

- BarChart (grouped DataSets)

- Horizontal-BarChart

- PieChart (with selection, ...)

- ScatterChart (with squares, triangles, circles, ... and more)

- CandleStickChart (for financial data)

- BubbleChart (area covered by bubbles indicates the value)

- RadarChart (spider web chart)

Documentation
Currently there's no need for documentation for the iOS/tvOS/macOS version, as the API is 95% the same as on Android.
You can read the official MPAndroidChart documentation here: Wiki
Or you can see the Charts Demo project in both Objective-C and Swift (ChartsDemo-iOS, as well as macOS ChartsDemo-macOS) and learn the how-tos from it.
Special Thanks
Goes to @liuxuan30, @petester42 and @AlBirdie for new features, bugfixes, and lots and lots of involvement in our open-sourced community! You guys are a huge help to all of those coming here with questions and issues, and I couldn't respond to all of those without you.
Our amazing sponsors
Debricked: Use open source securely
License
Copyright 2016 Daniel Cohen Gindi & Philipp Jahoda
Licensed under the Apache License, Version 2.0 (the "License"); you may not use this file except in compliance with the License. You may obtain a copy of the License at
http://www.apache.org/licenses/LICENSE-2.0
Unless required by applicable law or agreed to in writing, software distributed under the License is distributed on an "AS IS" BASIS, WITHOUT WARRANTIES OR CONDITIONS OF ANY KIND, either express or implied. See the License for the specific language governing permissions and limitations under the License.
Top Related Projects
Beautiful charts for iOS/tvOS/OSX! The Apple side of the crossplatform MPAndroidChart.
A powerful 🚀 Android chart view / graph view library, supporting line- bar- pie- radar- bubble- and candlestick charts as well as scaling, panning and animations.
📈📊🚀🚀🚀An elegant modern declarative data visualization chart framework for iOS, iPadOS and macOS. Extremely powerful, supports line, spline, area, areaspline, column, bar, pie, scatter, angular gauges, arearange, areasplinerange, columnrange, bubble, box plot, error bars, funnel, waterfall and polar chart types. 极其精美而又强大的现代化声明式数据可视化图表框架,支持柱状图、条形图、折线图、曲线图、折线填充图、曲线填充图、气泡图、扇形图、环形图、散点图、雷达图、混合图等各种类型的多达几十种的信息图图表,完全满足工作所需.
Promises for Swift & ObjC.
The better way to deal with JSON data in Swift.
Convert  designs to code with AI

Introducing Visual Copilot: A new AI model to turn Figma designs to high quality code using your components.
Try Visual Copilot


