 AAChartKit
📈📊🚀🚀🚀An elegant modern declarative data visualization chart framework for iOS, iPadOS and macOS. Extremely powerful, supports line, spline, area, areaspline, column, bar, pie, scatter, angular gauges, arearange, areasplinerange, columnrange, bubble, box plot, error bars, funnel, waterfall and polar chart types. 极其精美而又强大的现代化声明式数据可视化图表框架,支持柱状图、条形图、折线图、曲线图、折线填充图、曲线填充图、气泡图、扇形图、环形图、散点图、雷达图、混合图等各种类型的多达几十种的信息图图表,完全满足工作所需.
Top Related Projects

Highcharts JS, the JavaScript charting framework

Beautiful charts for iOS/tvOS/OSX! The Apple side of the crossplatform MPAndroidChart.

A powerful 🚀 Android chart view / graph view library, supporting line- bar- pie- radar- bubble- and candlestick charts as well as scaling, panning and animations.

Promises for Swift & ObjC.

Elegant HTTP Networking in Swift

A delightful networking framework for iOS, macOS, watchOS, and tvOS.
Quick Overview
AAChartKit is an elegant and powerful iOS chart library for creating interactive and customizable charts in Swift. It provides a wide range of chart types and offers extensive customization options, making it suitable for various data visualization needs in iOS applications.
Pros
- Easy to use with a simple and intuitive API
- Supports a wide variety of chart types (line, bar, area, pie, etc.)
- Highly customizable with numerous styling and animation options
- Responsive and interactive charts with smooth animations
Cons
- Limited to iOS platform, not cross-platform
- Documentation could be more comprehensive, especially for advanced features
- Some users report occasional performance issues with large datasets
- Dependency on JavaScript for rendering charts may not be ideal for all use cases
Code Examples
- Creating a basic line chart:
let aaChartModel = AAChartModel()
    .chartType(.line)
    .title("Line Chart")
    .subtitle("Basic Line Chart")
    .categories(["Jan", "Feb", "Mar", "Apr", "May", "Jun"])
    .series([
        AASeriesElement()
            .name("Tokyo")
            .data([7.0, 6.9, 9.5, 14.5, 18.2, 21.5])
    ])

let aaChartView = AAChartView()
aaChartView.aa_drawChartWithChartModel(aaChartModel)
- Customizing chart appearance:
let aaChartModel = AAChartModel()
    .chartType(.column)
    .title("Customized Column Chart")
    .yAxisTitle("Fruit Consumption")
    .colorsTheme(["#fe117c", "#ffc069", "#06caf4", "#7dffc0"])
    .series([
        AASeriesElement()
            .name("Jane")
            .data([3, 2, 1, 3, 4])
    ])

aaChartView.aa_drawChartWithChartModel(aaChartModel)
- Adding multiple series to a chart:
let aaChartModel = AAChartModel()
    .chartType(.area)
    .title("Multi-Series Area Chart")
    .categories(["Jan", "Feb", "Mar", "Apr", "May", "Jun"])
    .series([
        AASeriesElement()
            .name("Tokyo")
            .data([7.0, 6.9, 9.5, 14.5, 18.2, 21.5]),
        AASeriesElement()
            .name("New York")
            .data([0.2, 0.8, 5.7, 11.3, 17.0, 22.0])
    ])

aaChartView.aa_drawChartWithChartModel(aaChartModel)
Getting Started
-
Install AAChartKit using CocoaPods by adding the following to your Podfile:
pod 'AAChartKit' -
Import AAChartKit in your Swift file:
import AAChartKit -
Create an AAChartView and add it to your view hierarchy:
let aaChartView = AAChartView() view.addSubview(aaChartView) -
Configure and draw the chart:
let aaChartModel = AAChartModel()
    .chartType(.line)
    .title("My First Chart")
    .series([
        AASeriesElement()
            .name("Data")
            .data([1, 2, 3, 4, 5])
    ])

aaChartView.aa_drawChartWithChartModel(aaChartModel)
Competitor Comparisons
Highcharts JS, the JavaScript charting framework
Pros of Highcharts
- More extensive documentation and examples
- Wider range of chart types and customization options
- Larger community and ecosystem
Cons of Highcharts
- Commercial license required for most use cases
- Steeper learning curve due to more complex API
- Larger file size, which may impact performance
Code Comparison
AAChartKit:
let aaChartModel = AAChartModel()
    .chartType(.area)
    .title("Chart Title")
    .series([
        AASeriesElement()
            .name("Series 1")
            .data([1, 2, 3, 4, 5])
    ])
Highcharts:
Highcharts.chart('container', {
    chart: { type: 'area' },
    title: { text: 'Chart Title' },
    series: [{
        name: 'Series 1',
        data: [1, 2, 3, 4, 5]
    }]
});
Summary
AAChartKit is a simpler, open-source alternative primarily for iOS development, while Highcharts offers a more comprehensive charting solution with broader platform support. AAChartKit may be preferable for smaller projects or those with budget constraints, whereas Highcharts is better suited for complex, feature-rich applications that require extensive customization and cross-platform compatibility.
Beautiful charts for iOS/tvOS/OSX! The Apple side of the crossplatform MPAndroidChart.
Pros of Charts
- More mature and widely adopted project with a larger community
- Supports a broader range of chart types and customization options
- Better documentation and more extensive examples
Cons of Charts
- Steeper learning curve due to more complex API
- Larger library size, which may impact app performance
- Less frequent updates compared to AAChartKit
Code Comparison
AAChartKit:
let aaChartModel = AAChartModel()
    .chartType(.area)
    .title("Chart Title")
    .series([
        AASeriesElement()
            .name("Series 1")
            .data([1, 2, 3, 4, 5])
    ])
Charts:
let chartView = LineChartView()
let dataSet = LineChartDataSet(entries: [
    ChartDataEntry(x: 1, y: 1),
    ChartDataEntry(x: 2, y: 2),
    ChartDataEntry(x: 3, y: 3),
    ChartDataEntry(x: 4, y: 4),
    ChartDataEntry(x: 5, y: 5)
], label: "Series 1")
chartView.data = LineChartData(dataSet: dataSet)
AAChartKit offers a more concise and fluent API for creating charts, while Charts provides more granular control over chart elements but requires more verbose code.
A powerful 🚀 Android chart view / graph view library, supporting line- bar- pie- radar- bubble- and candlestick charts as well as scaling, panning and animations.
Pros of MPAndroidChart
- More extensive and feature-rich charting library for Android
- Highly customizable with a wide range of chart types and options
- Active community and frequent updates
Cons of MPAndroidChart
- Steeper learning curve due to its complexity
- Limited to Android platform only
Code Comparison
MPAndroidChart:
LineChart chart = findViewById(R.id.chart);
LineDataSet dataSet = new LineDataSet(entries, "Label");
LineData lineData = new LineData(dataSet);
chart.setData(lineData);
chart.invalidate();
AAChartKit:
let aaChartView = AAChartView()
let aaChartModel = AAChartModel()
    .chartType(.line)
    .title("Chart Title")
    .series([
        AASeriesElement()
            .name("Series Name")
            .data([1, 2, 3, 4, 5])
    ])
aaChartView.aa_drawChartWithChartModel(aaChartModel)
Summary
MPAndroidChart offers more advanced features and customization options for Android developers, but comes with a steeper learning curve. AAChartKit provides a simpler API and cross-platform support (iOS and Android), making it easier to use for basic charting needs. The choice between the two depends on the specific requirements of the project, target platforms, and the level of chart complexity needed.
Promises for Swift & ObjC.
Pros of PromiseKit
- Focuses on asynchronous programming and simplifies complex async operations
- Extensive documentation and community support
- Supports multiple programming languages beyond iOS/Swift
Cons of PromiseKit
- Steeper learning curve for developers new to promises
- May introduce unnecessary complexity for simple projects
- Less suitable for projects primarily focused on data visualization
Code Comparison
AAChartKit example:
let aaChartModel = AAChartModel()
    .chartType(.area)
    .title("Chart Title")
    .subtitle("Chart Subtitle")
    .dataLabelsEnabled(false)
    .series([
        AASeriesElement()
            .name("Tokyo")
            .data([7.0, 6.9, 9.5, 14.5, 18.2, 21.5, 25.2, 26.5, 23.3, 18.3, 13.9, 9.6])
    ])
PromiseKit example:
firstly {
    fetch(userID)
}.then { user in
    fetch(user.friendIDs)
}.then { friends in
    self.updateUI(friends)
}.catch { error in
    self.handle(error)
}
While AAChartKit focuses on creating charts with a fluent API, PromiseKit provides a way to handle asynchronous operations more elegantly. The choice between the two depends on the specific needs of your project, with AAChartKit being more suitable for data visualization tasks and PromiseKit for managing complex asynchronous workflows.
Elegant HTTP Networking in Swift
Pros of Alamofire
- Comprehensive networking library with a wide range of features
- Well-maintained and actively developed with a large community
- Supports modern Swift concurrency features
Cons of Alamofire
- Larger codebase and potential overhead for simple networking tasks
- Steeper learning curve for beginners compared to URLSession
Code Comparison
AAChartKit (Chart creation):
let aaChartModel = AAChartModel()
    .chartType(.area)
    .title("Title")
    .subtitle("Subtitle")
    .dataLabelsEnabled(false)
    .series([
        AASeriesElement()
            .name("Tokyo")
            .data([7.0, 6.9, 9.5, 14.5, 18.2, 21.5, 25.2, 26.5, 23.3, 18.3, 13.9, 9.6])
    ])
Alamofire (Network request):
AF.request("https://api.example.com/data")
    .responseDecodable(of: [DataModel].self) { response in
        switch response.result {
        case .success(let data):
            print("Received data: \(data)")
        case .failure(let error):
            print("Error: \(error)")
        }
    }
Note that these libraries serve different purposes: AAChartKit is for creating charts, while Alamofire is for networking. The code comparison shows typical usage for each library's primary function.
A delightful networking framework for iOS, macOS, watchOS, and tvOS.
Pros of AFNetworking
- Comprehensive networking library for iOS and macOS
- Robust and well-maintained with a large community
- Supports a wide range of networking tasks, including HTTP requests, authentication, and caching
Cons of AFNetworking
- Larger and more complex than AAChartKit, which focuses solely on charting
- May be overkill for projects that only require charting functionality
- Steeper learning curve due to its broader scope
Code Comparison
AFNetworking (HTTP request):
AFHTTPSessionManager *manager = [AFHTTPSessionManager manager];
[manager GET:@"https://api.example.com/data" parameters:nil progress:nil success:^(NSURLSessionTask *task, id responseObject) {
    NSLog(@"JSON: %@", responseObject);
} failure:^(NSURLSessionTask *operation, NSError *error) {
    NSLog(@"Error: %@", error);
}];
AAChartKit (Creating a chart):
AAChartModel *chartModel = AAChartModel.new
.chartTypeSet(AAChartTypeColumn)
.titleSet(@"Chart Title")
.seriesSet(@[
    AASeriesElement.new
    .nameSet(@"Tokyo")
    .dataSet(@[@7.0, @6.9, @9.5, @14.5, @18.2])
]);
While AFNetworking is a powerful networking library, AAChartKit is specifically designed for creating charts and graphs. The choice between the two depends on the project's requirements and scope.
Convert  designs to code with AI

Introducing Visual Copilot: A new AI model to turn Figma designs to high quality code using your components.
Try Visual CopilotREADME
![]()
AAChartKit
![]()
![]()
![]()
![]()
![]()
![]()
![]()
![]()


![]()
![]()
English Document ð¬ð§ | ç®ä½ä¸æææ¡£ ð¨ð³
The Swift version of AAChartKit can be found here:
https://github.com/AAChartModel/AAChartKit-Swift
Preface
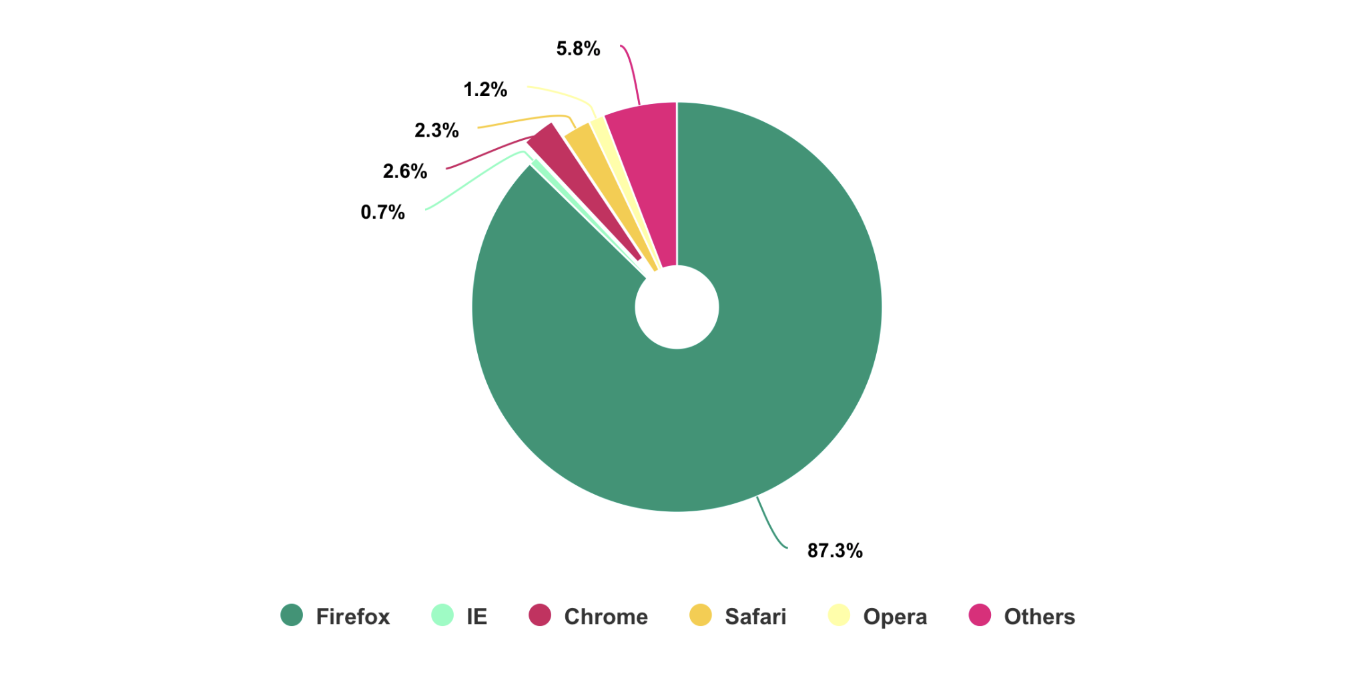
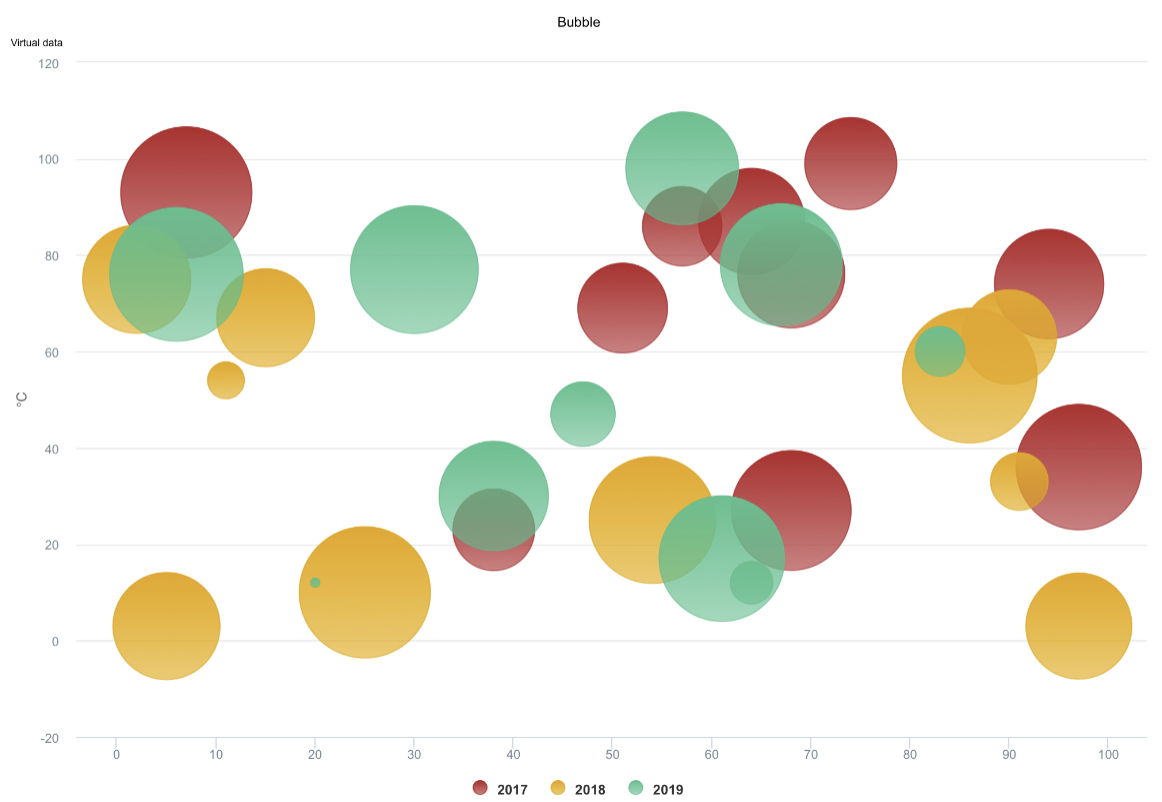
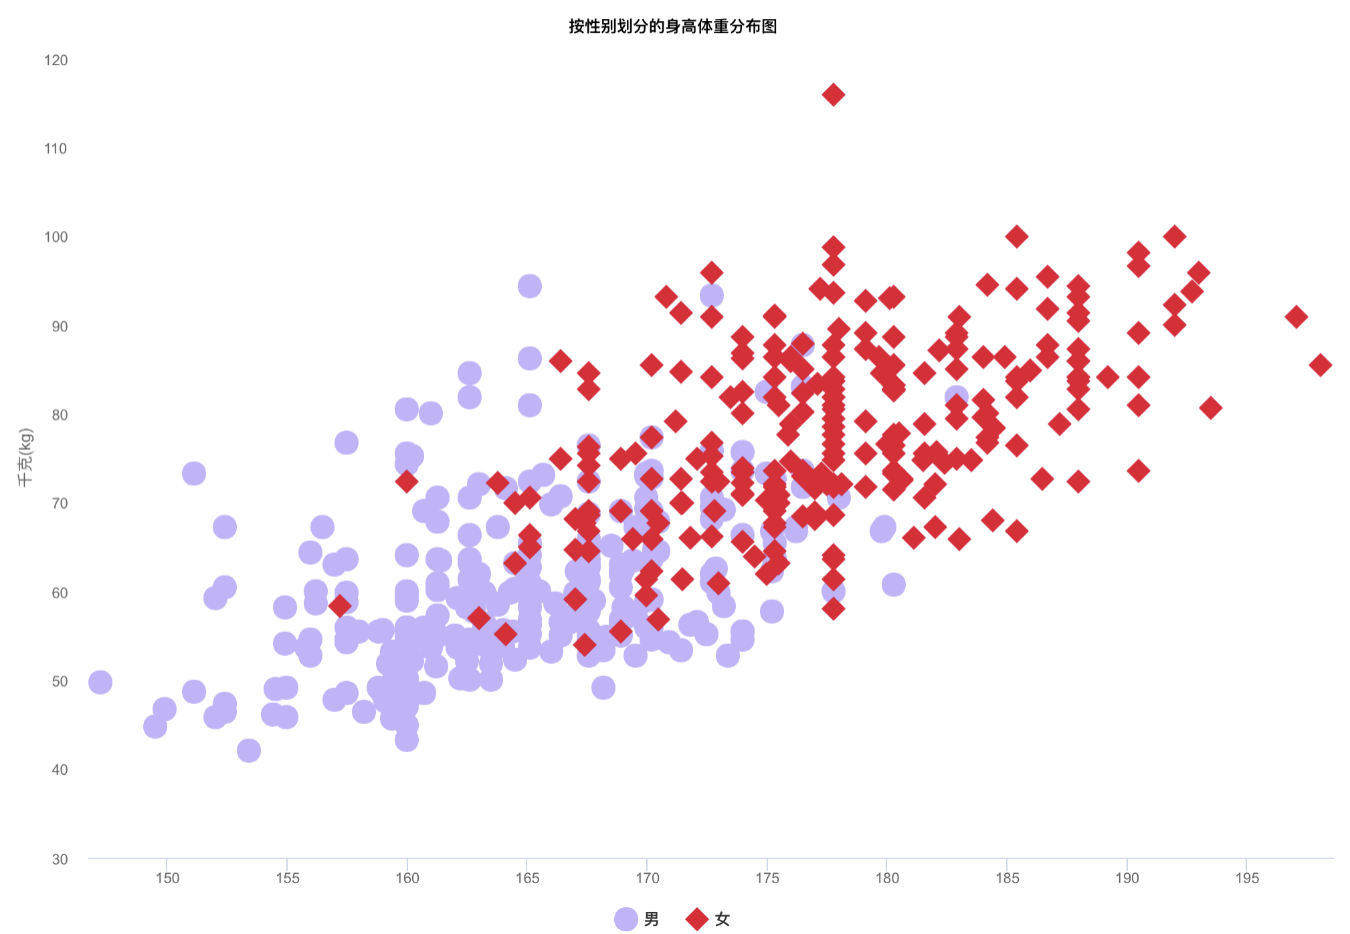
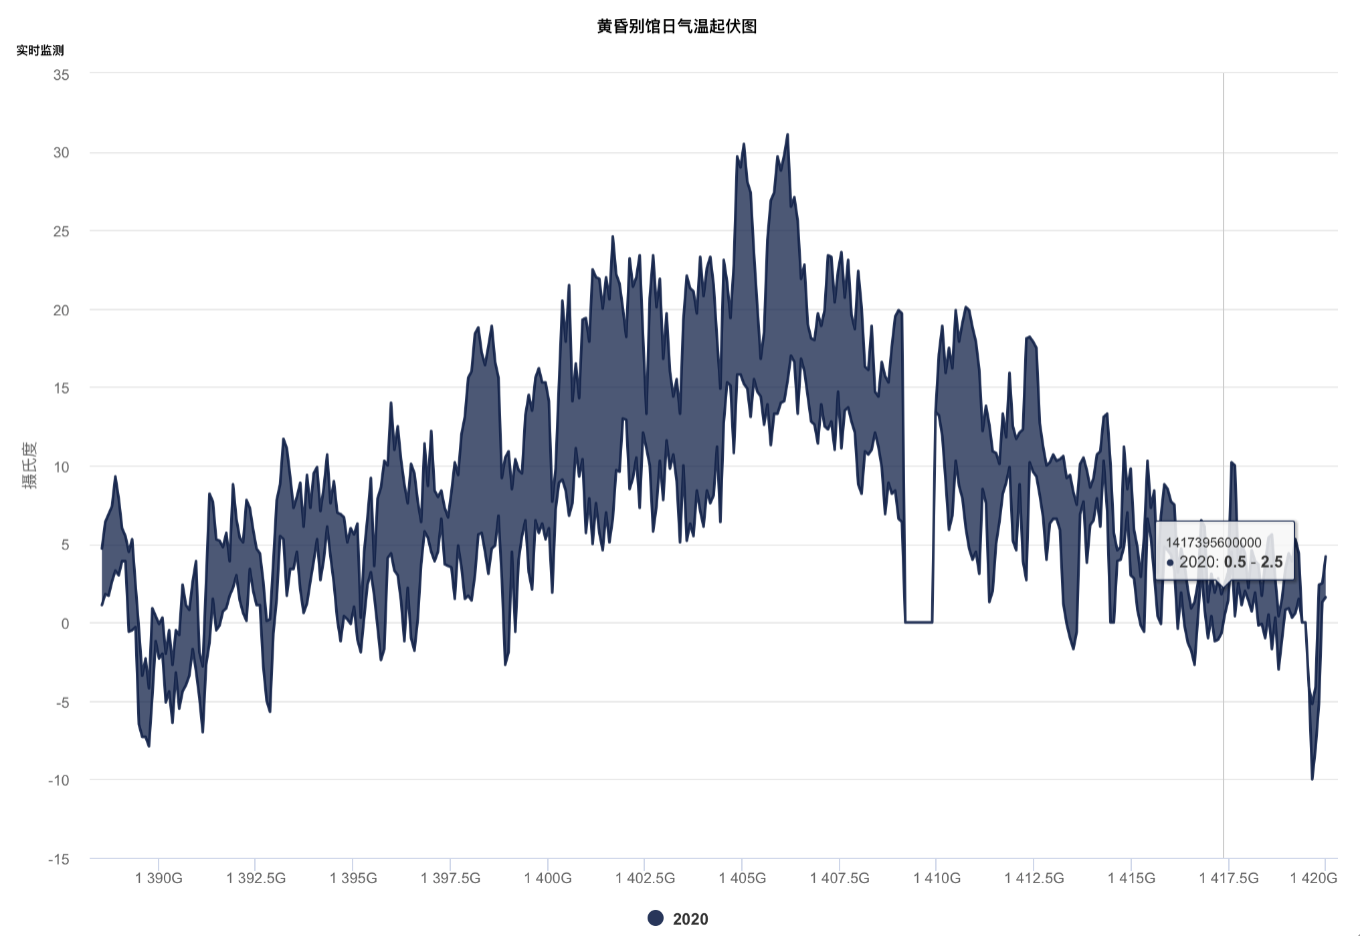
AAChartKit is an elegant and friendly (user-friendly && enviroment-friendly) chart framework for iOS, based on the open source Highcharts JS libraries. AAChartKit is extremely powerful, easy to configure and a pleasure to use. Currently AAChartKit includes support for the following chart types: column chart, bar chart, area chart, area spline chart, line chart, spline chart, radar chart, polar chart, pie chart, bubble chart, pyramid chart, funnel chart, column range and area range chart. More chart types are planned to be supported. AAChartKit gives you easy and fast access to a wide range of chart types, hassle-free and quick to integrate into your own project.
Features
-
ð Environment friendly. Support
iOSãiPadOSandmacOS. Totally supportObjective-Clanguage, and there are more types version such asSwiftlanguage version AAInfographics ãJavalanguage version AAChartCore ãKotlinlanguage version AAInfographics . To get more details you can see the source code links list. -
ð Powerful and easy to use. It supports
column chart,bar chart,area chart,areaspline chart,line chart,spline chart,radar chart,polar chart,pie chart,bubble chart,pyramid chart,funnel chart,columnrange chart,arearange chart,mixed chartand other graphics. Support for more chart types is planned. -
ð Modern Declarative Syntax. Unlike previous imperative programming techniques, drawing any custom chart in AAChartKit, you don't need to care about the inner implementation details which is annoying && boring. Describe what you want, you will get what you described.
-
ð® Interactive and animated. The charts
animationeffect is exquisite, delicate, smooth and beautiful. -
â Chain programming. Supports
chain programming syntaxlike Masonry . -
ð¦ Minimalist.
AAChartView + AAChartModel = Chart. The AAChartKit follows a minimalist formula: Chart view + Chart model = The chart you want, just like the powerful and beautiful charts lib AAInfographics. -
ð± Interaction event callback. Support for monitoring user click events and single finger move over events, which can be used to achieve double charts linked-working and even multiple charts linkage, as well as other more complex custom user interaction effects.
Beauty Appreciation
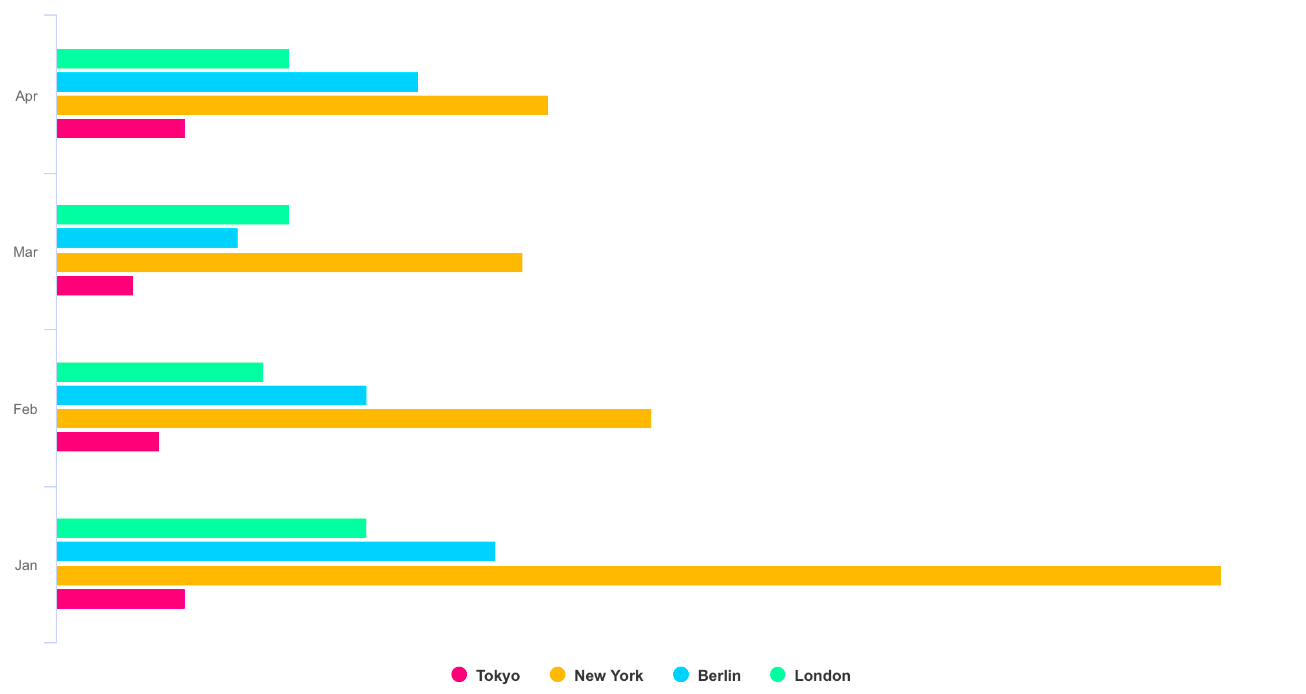
| Column Chart | Column Range Chart | Area Chart |
|---|---|---|
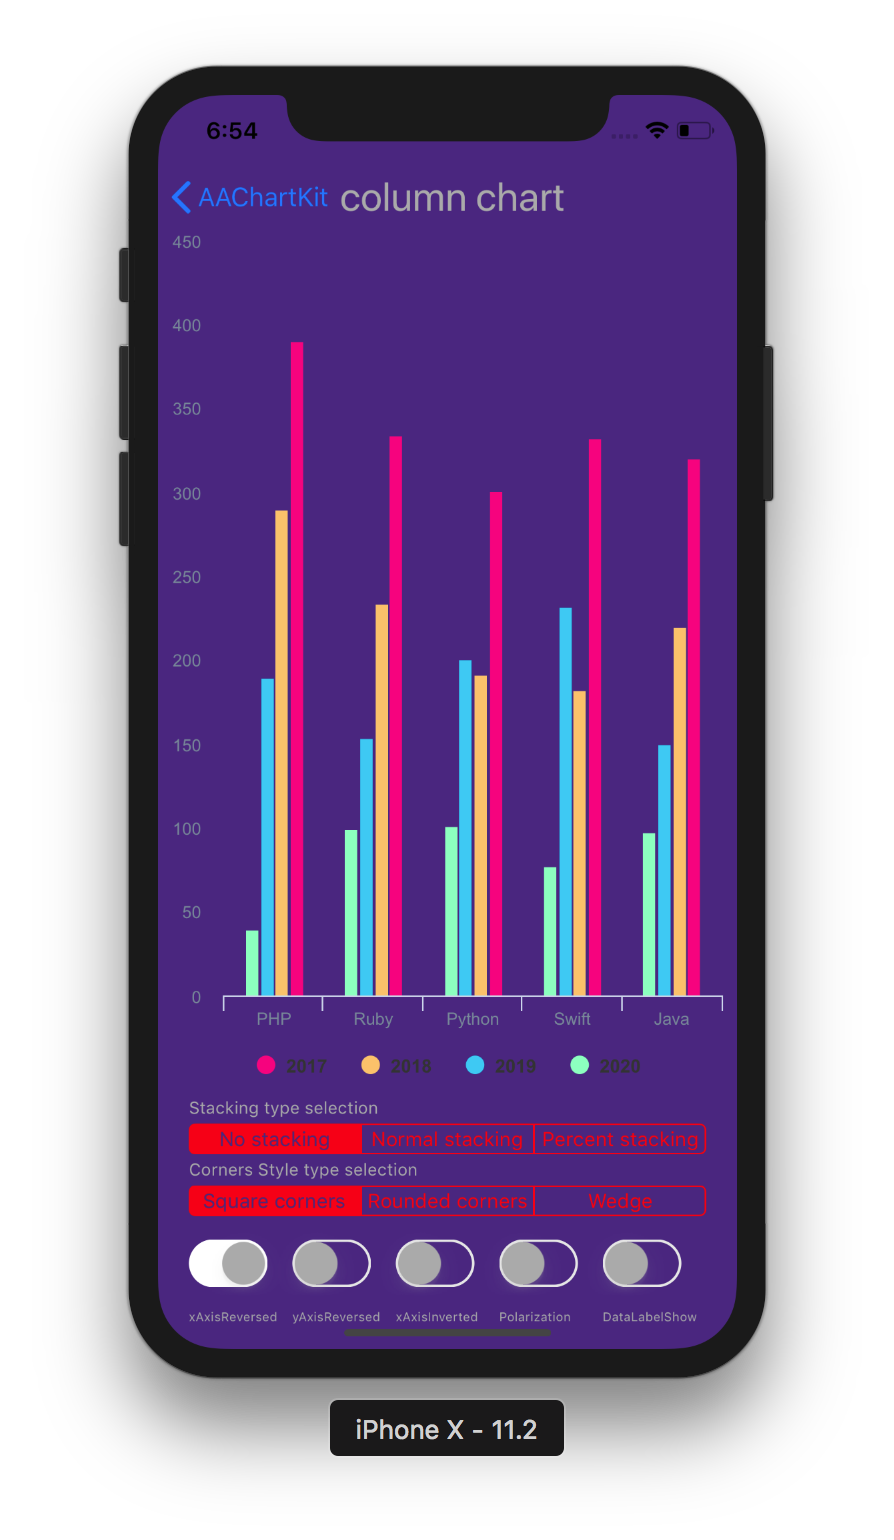 | 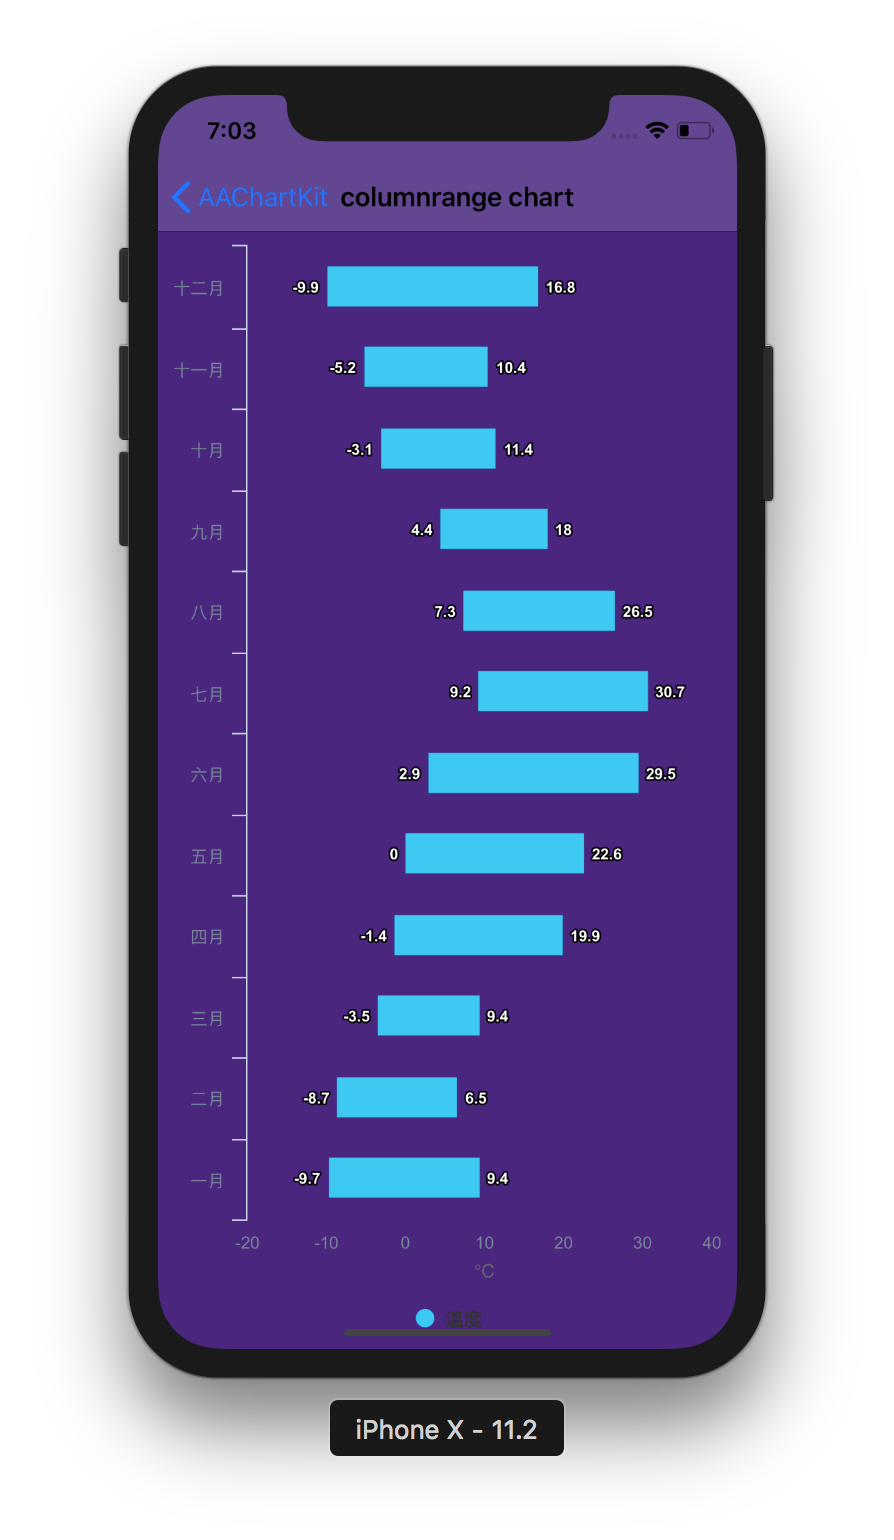 | 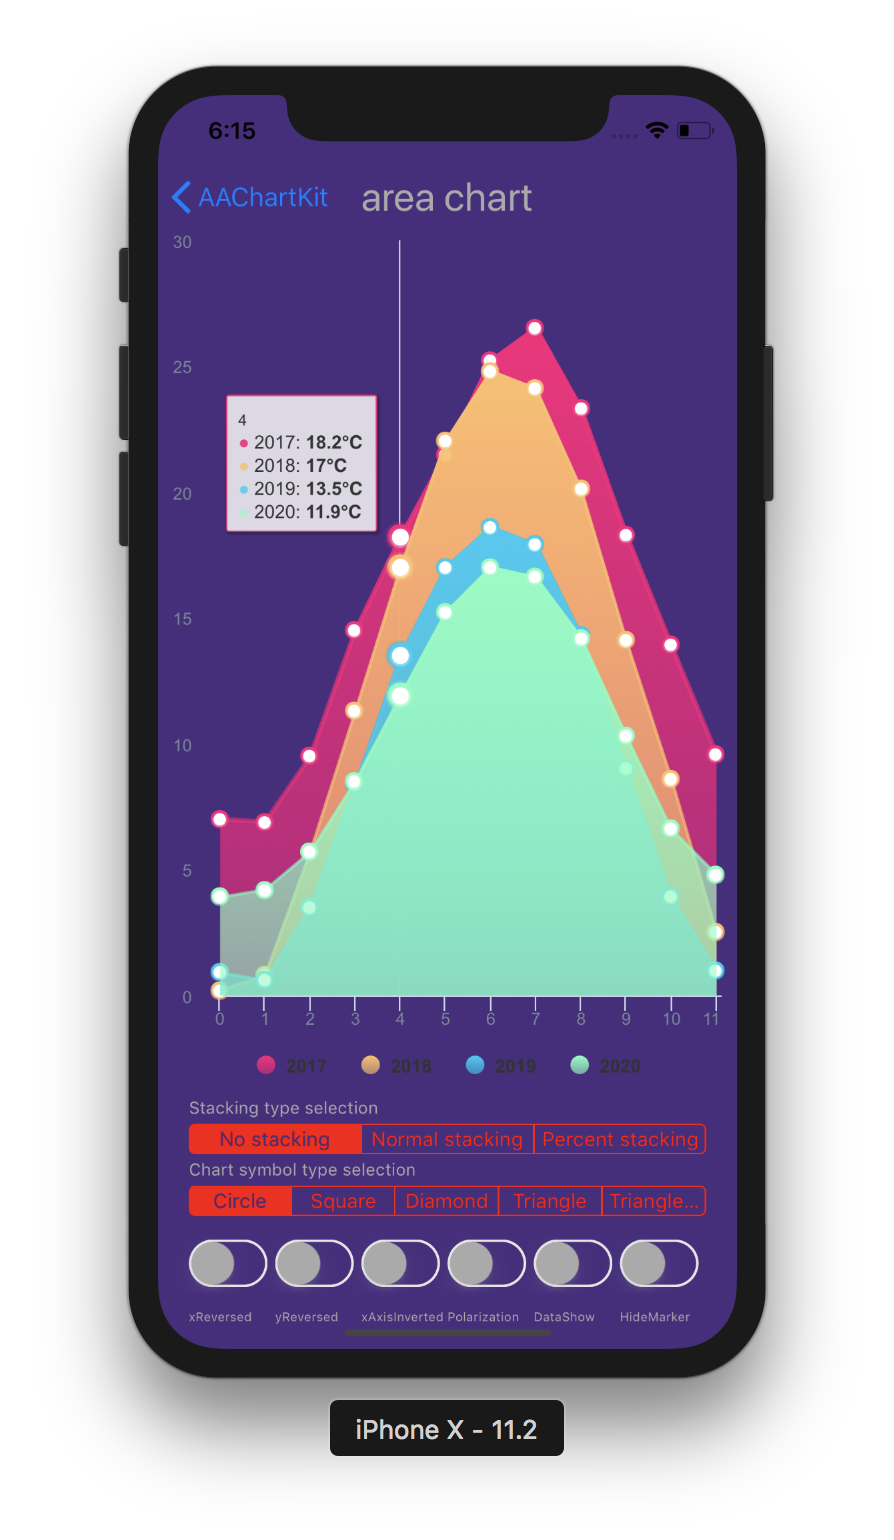 |
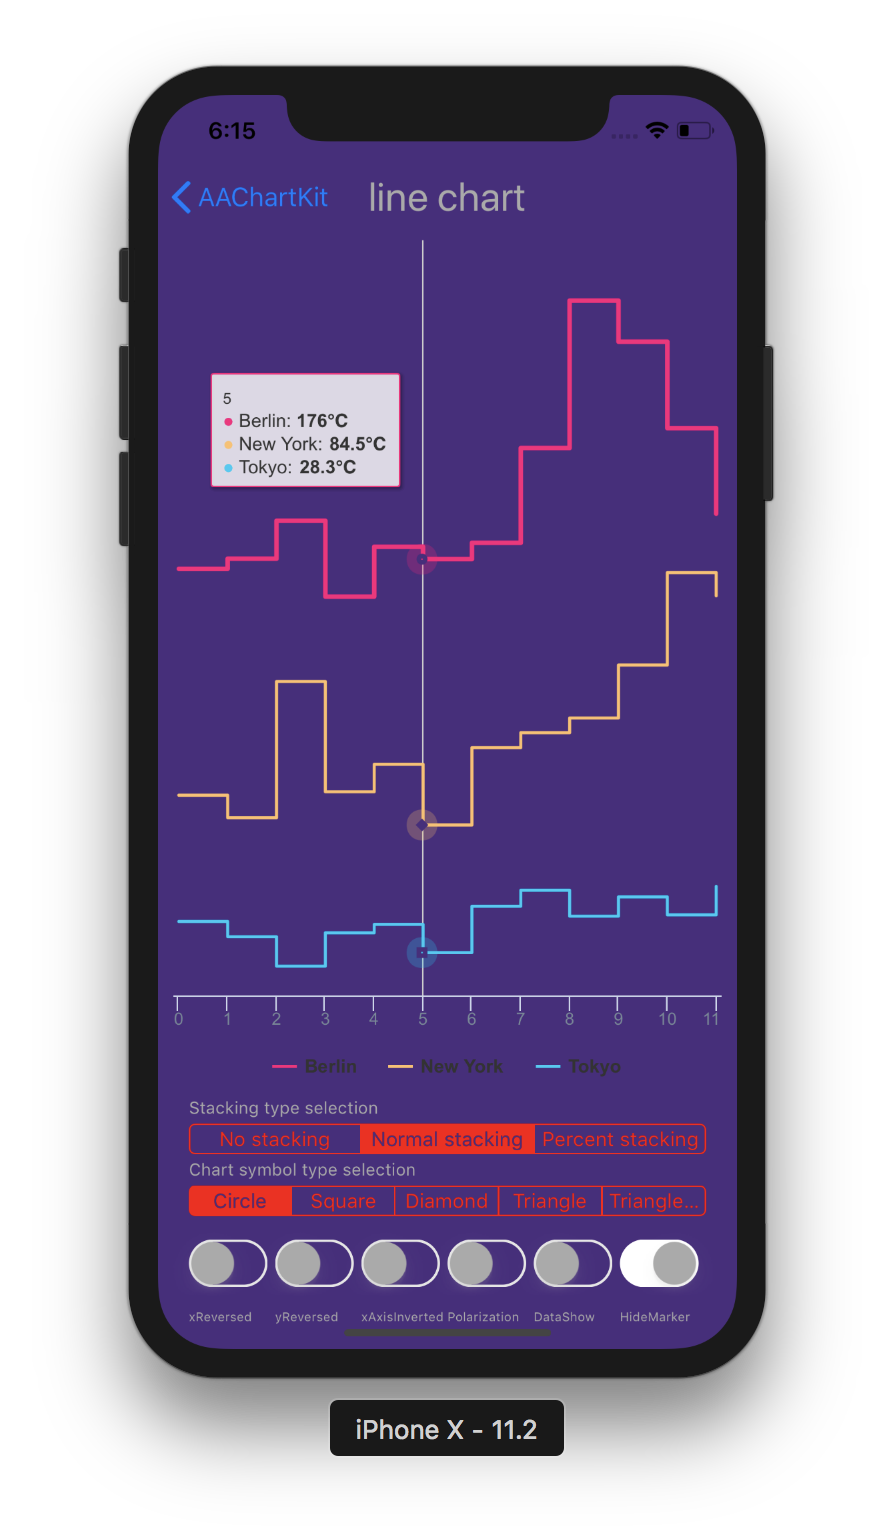
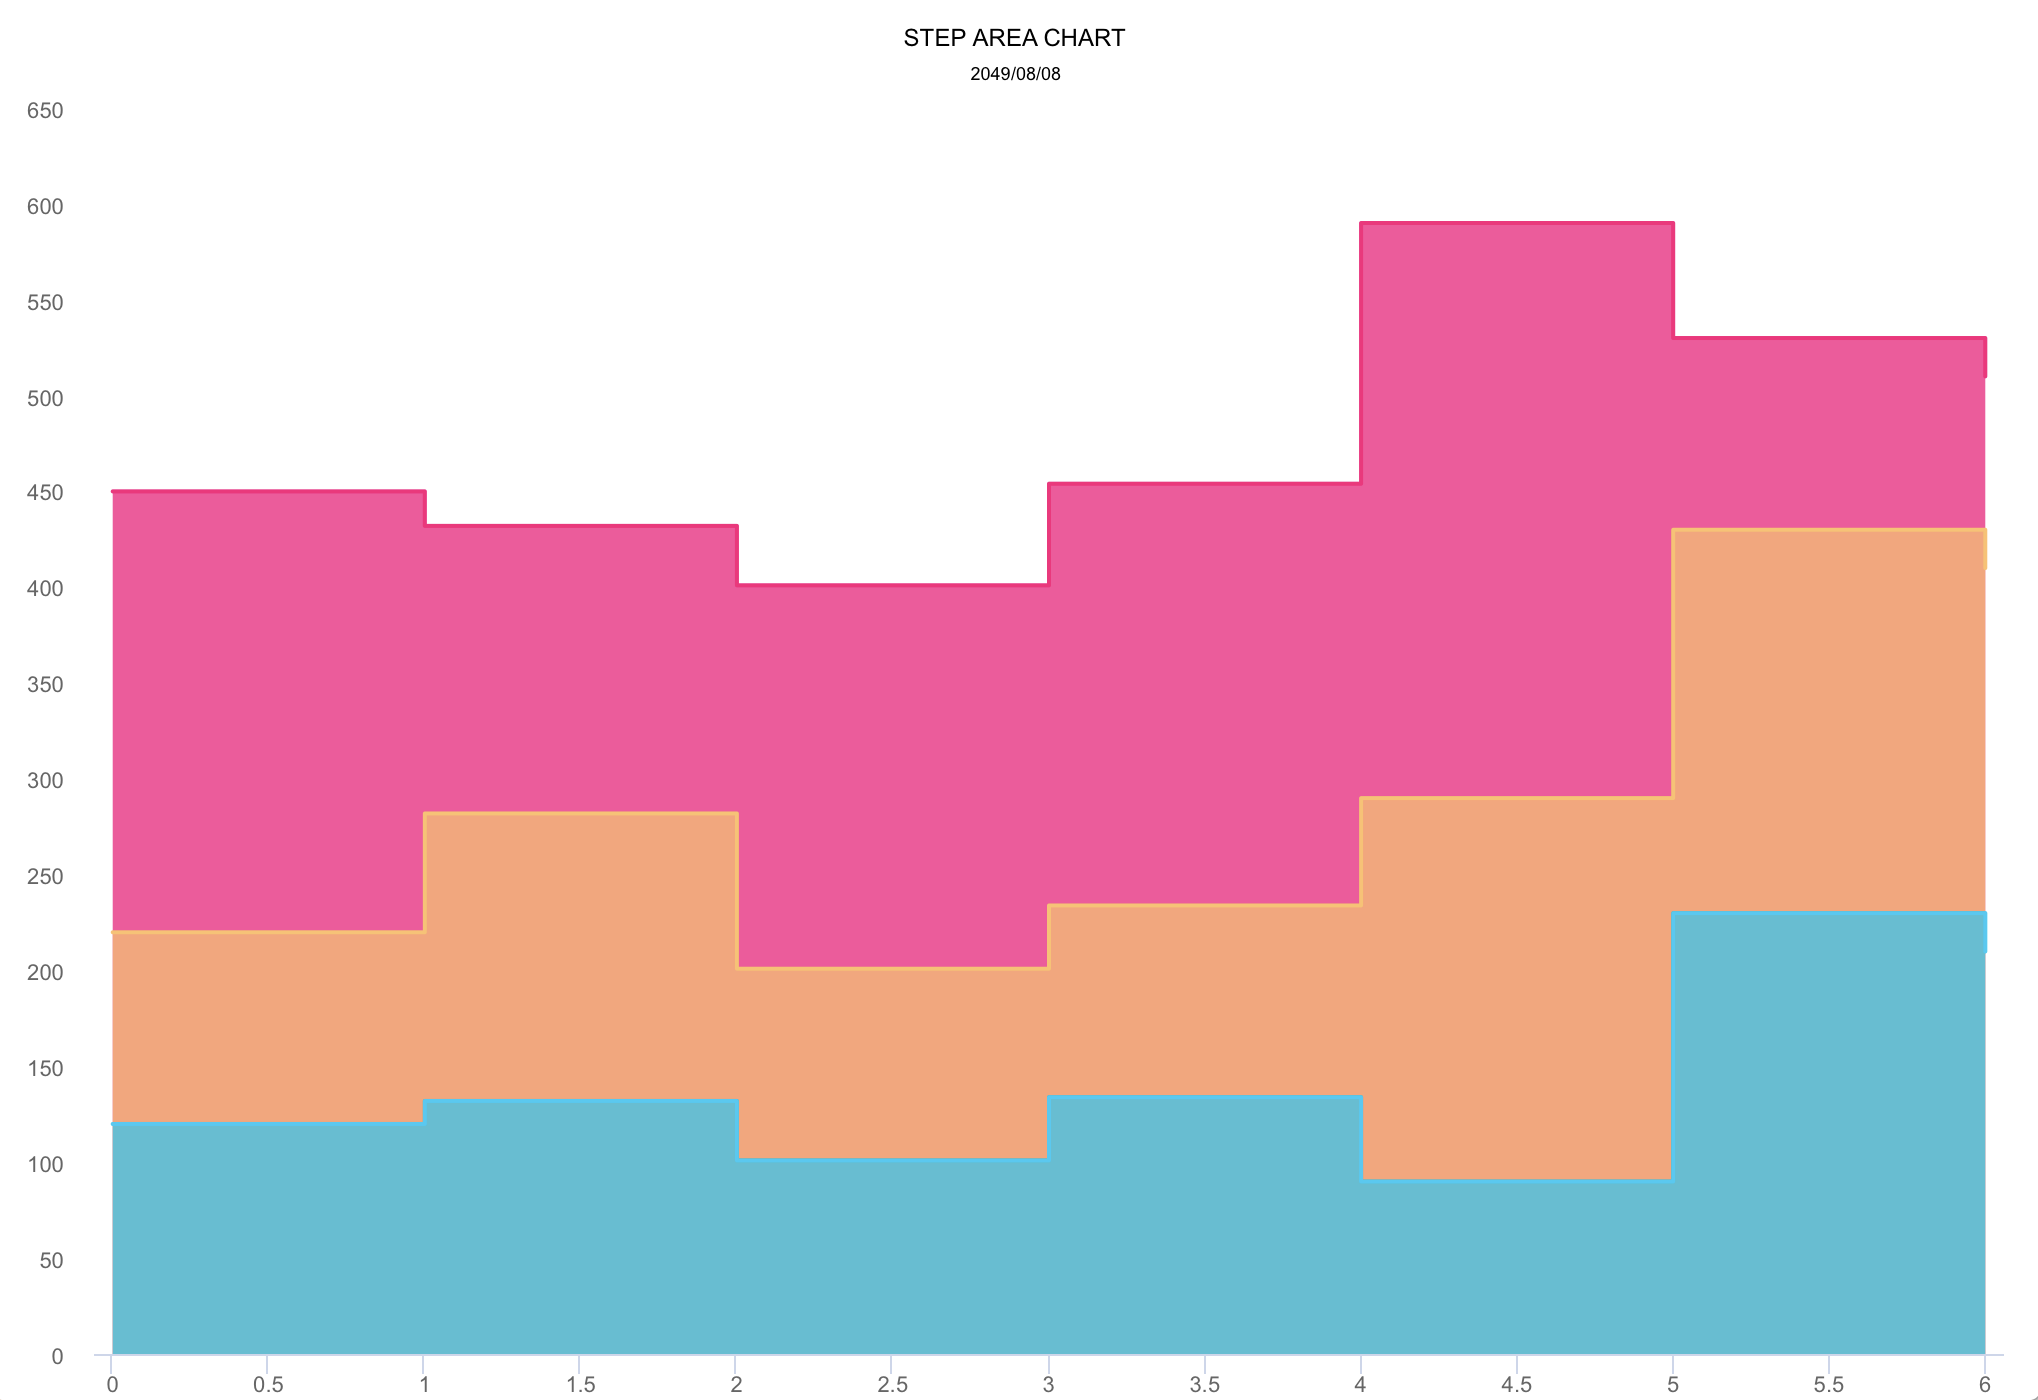
| Line Chart | Step Area Chart | Step Line Chart |
|---|---|---|
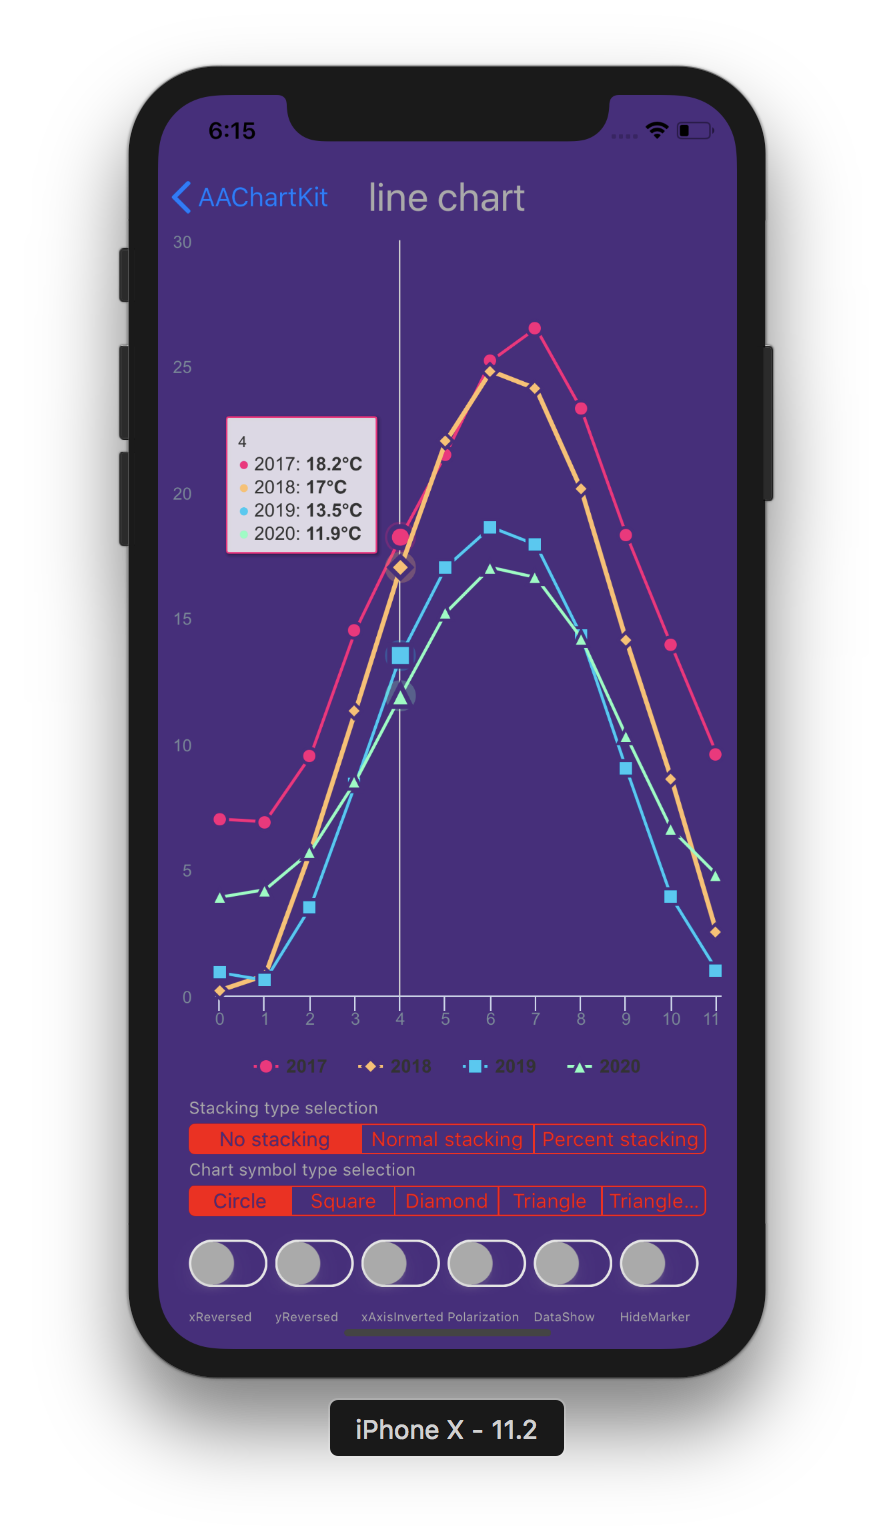 |  |  |
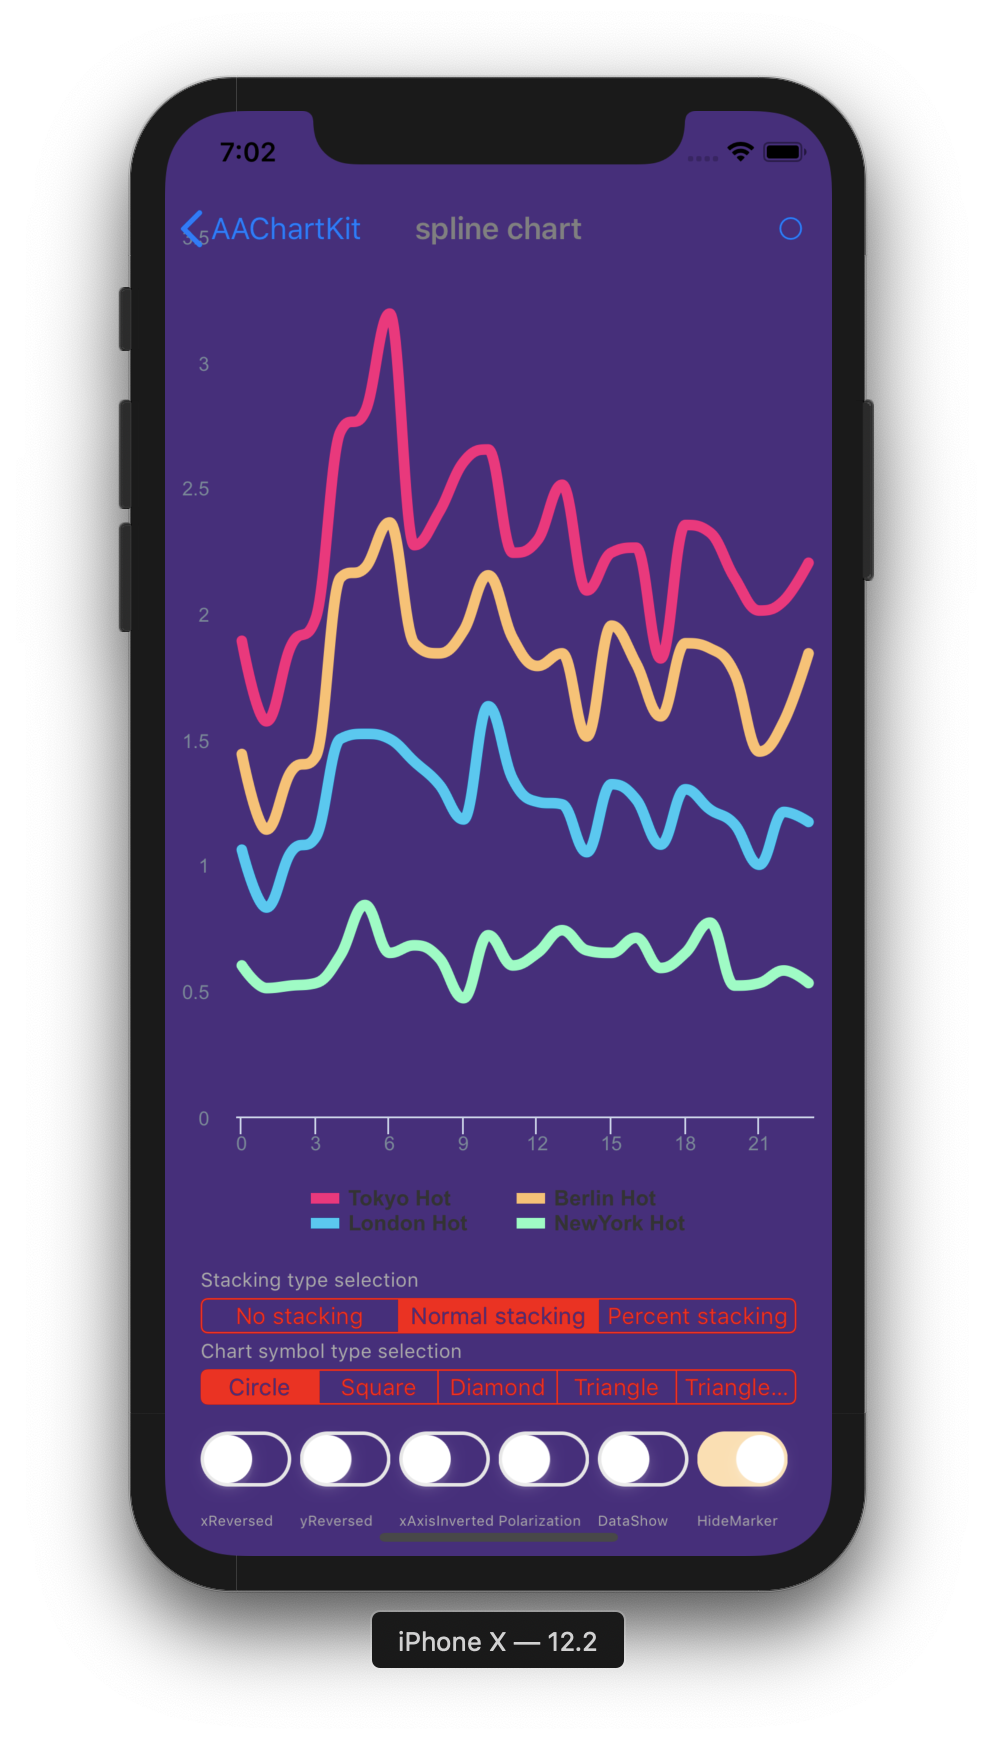
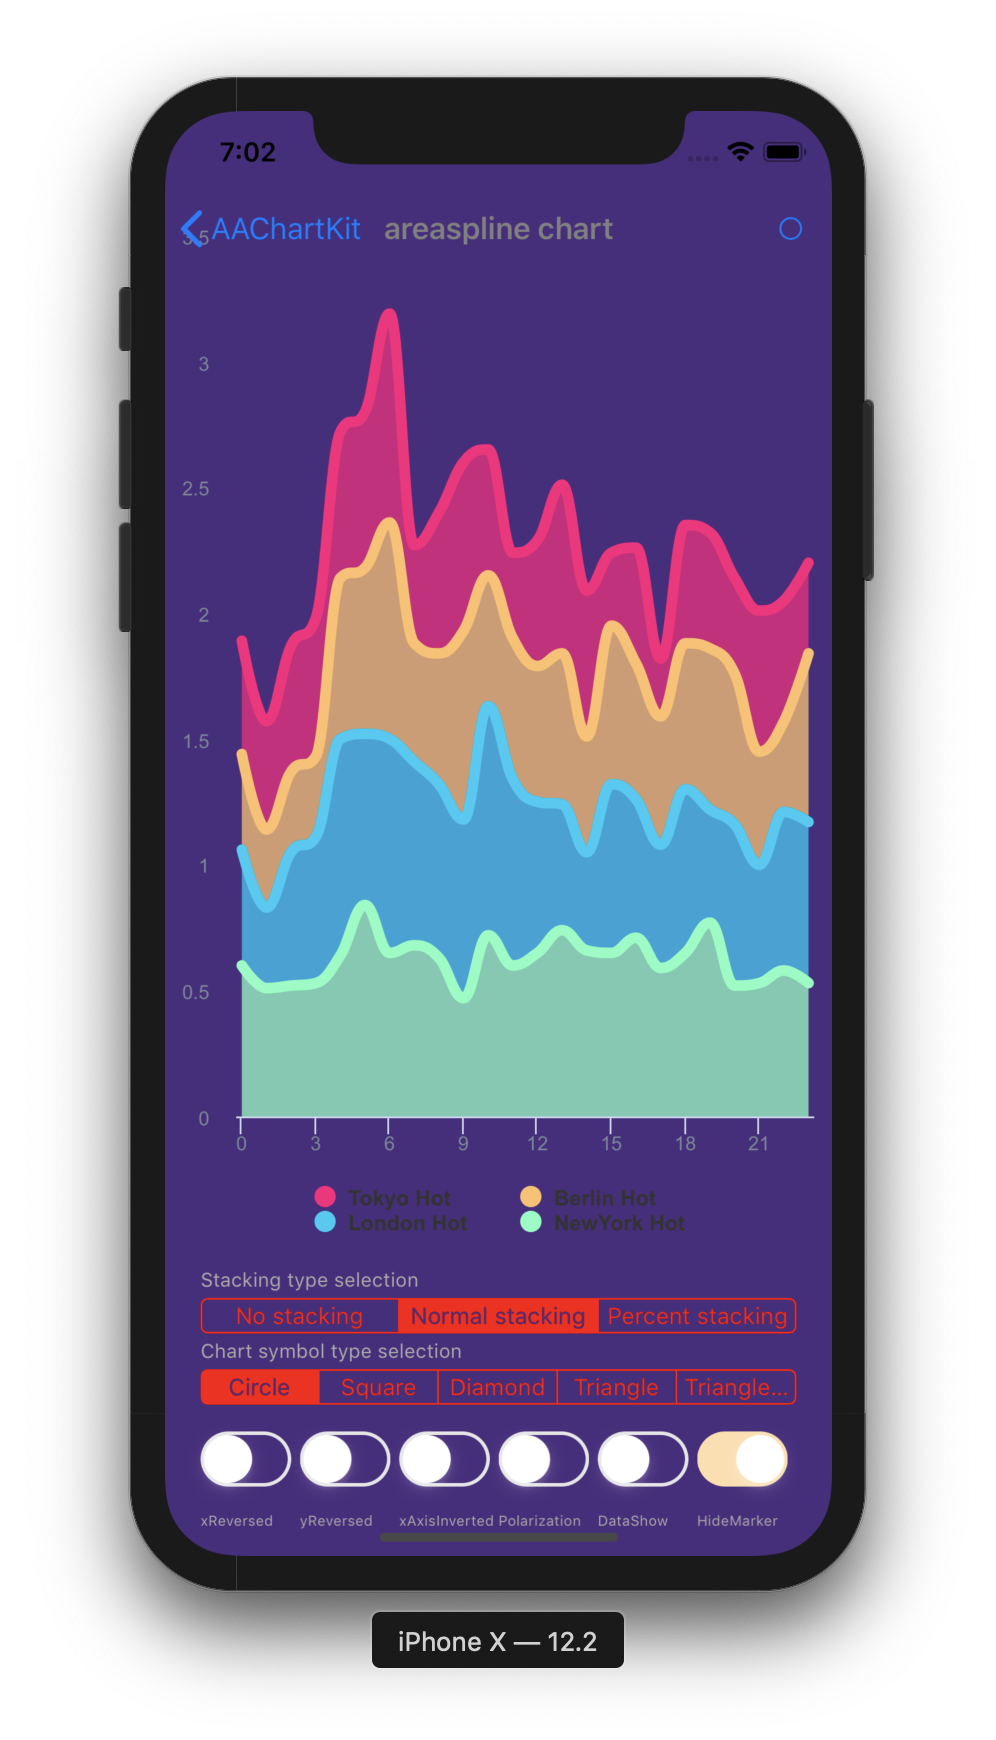
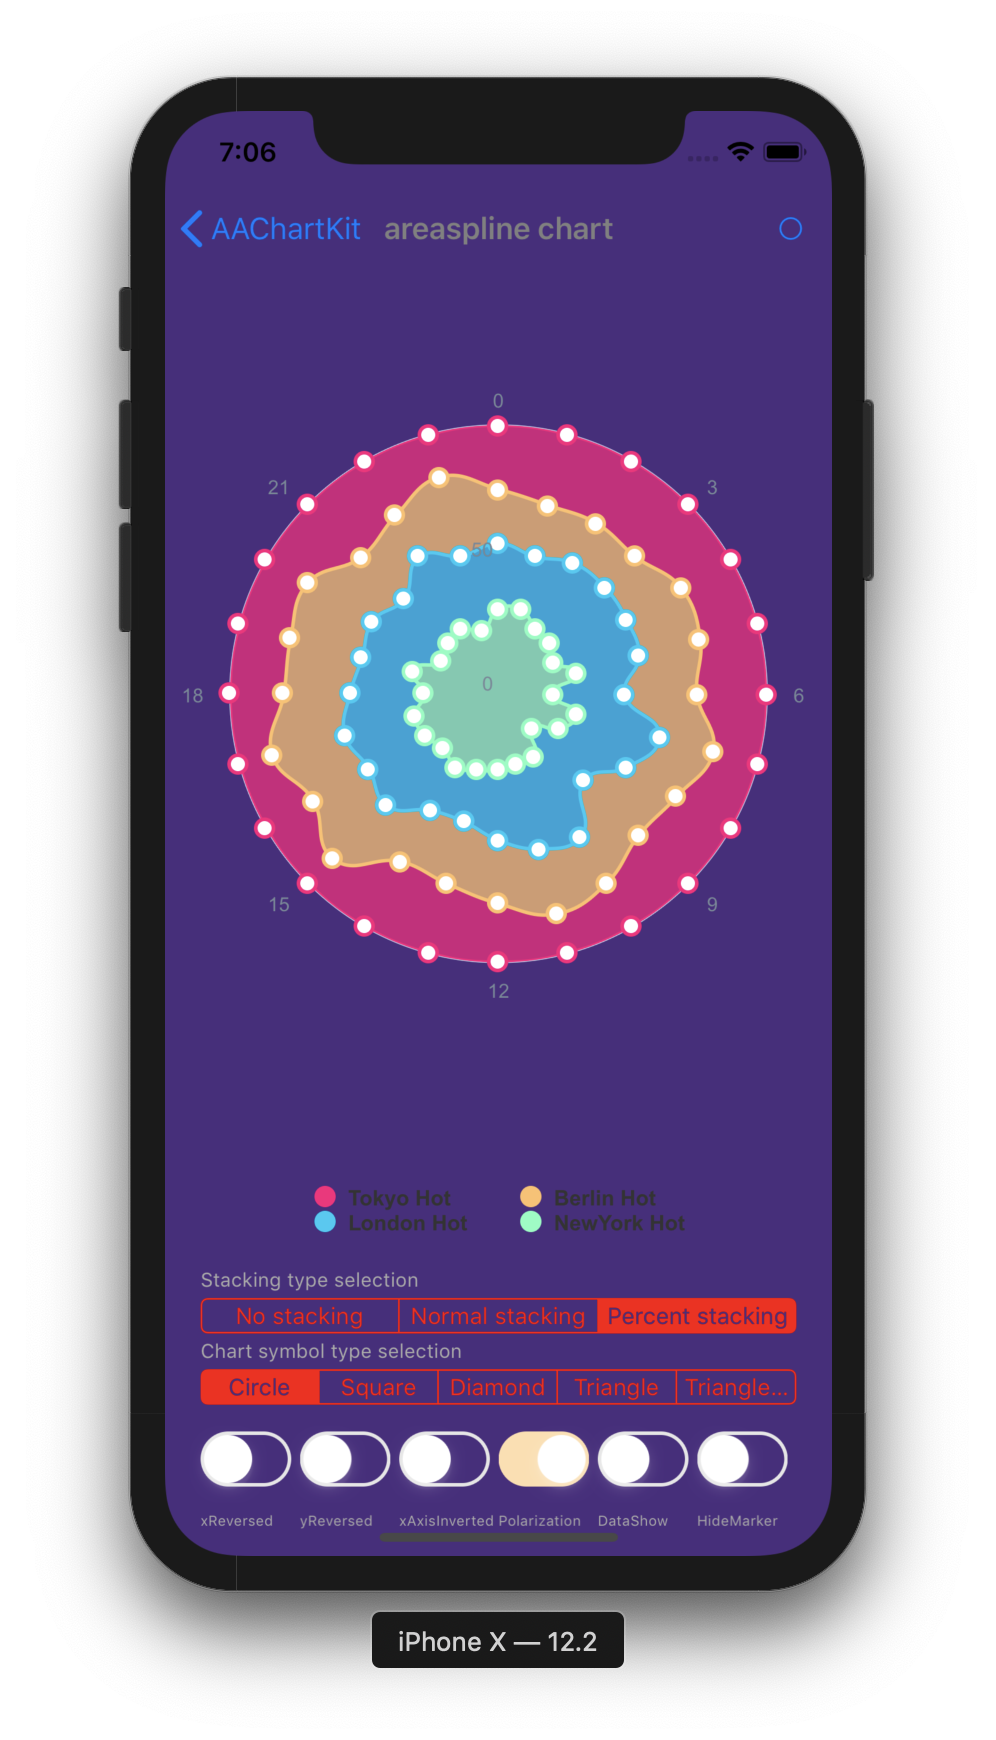
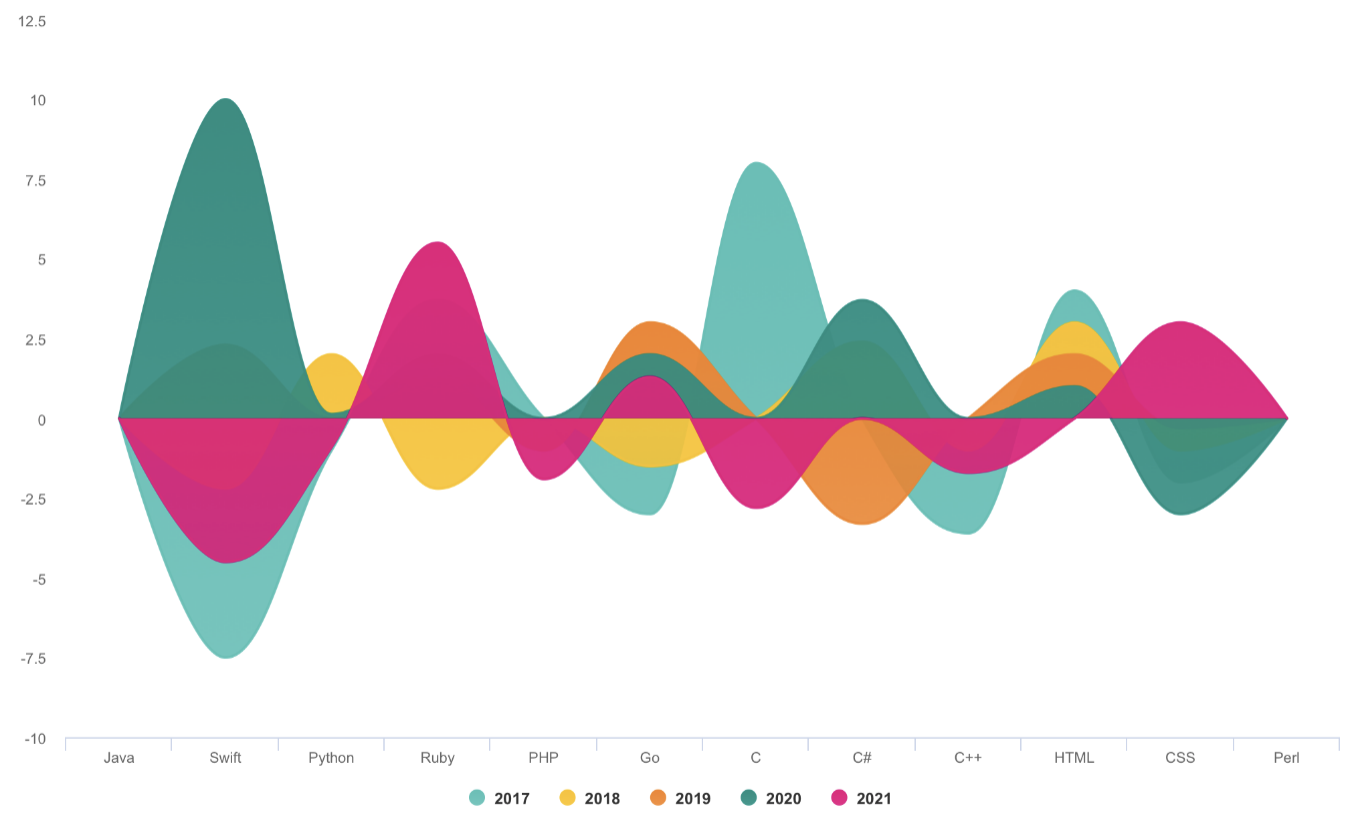
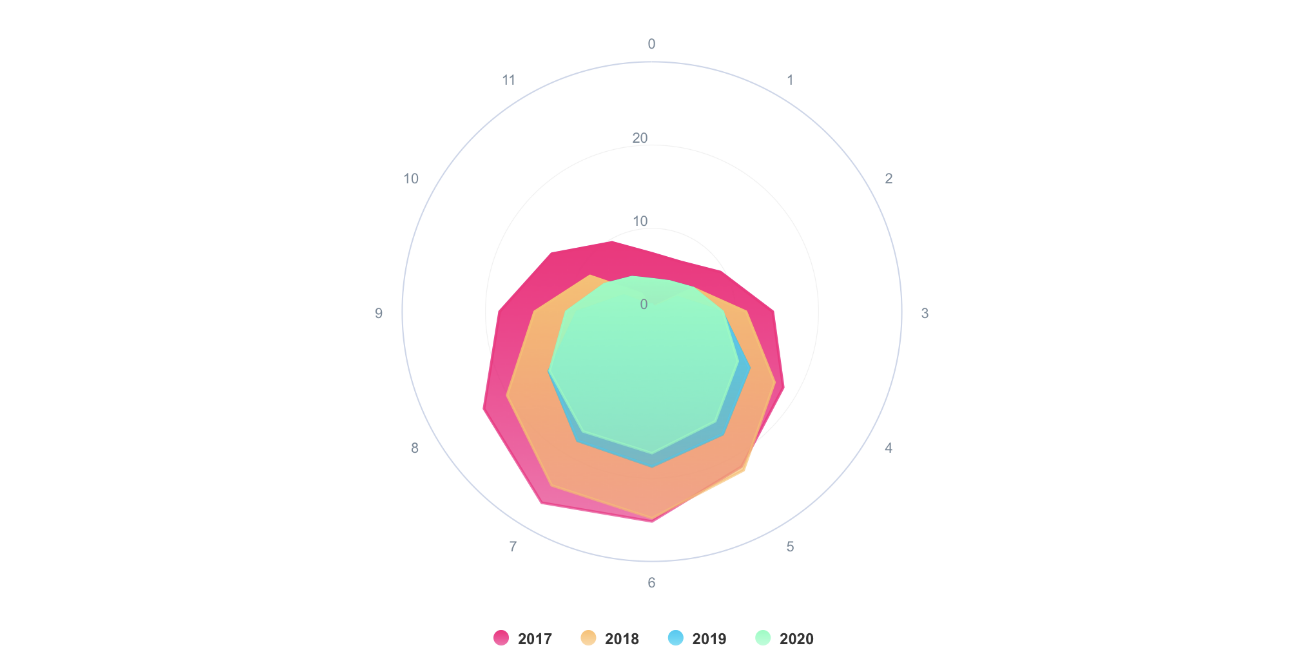
| Spline Chart | Areaspline Chart | Stacked Polar Chart |
|---|---|---|
 |  |  |
| Bubble Chart | Arearange Average Value Chart | Column Mixed Line Chart |
|---|---|---|
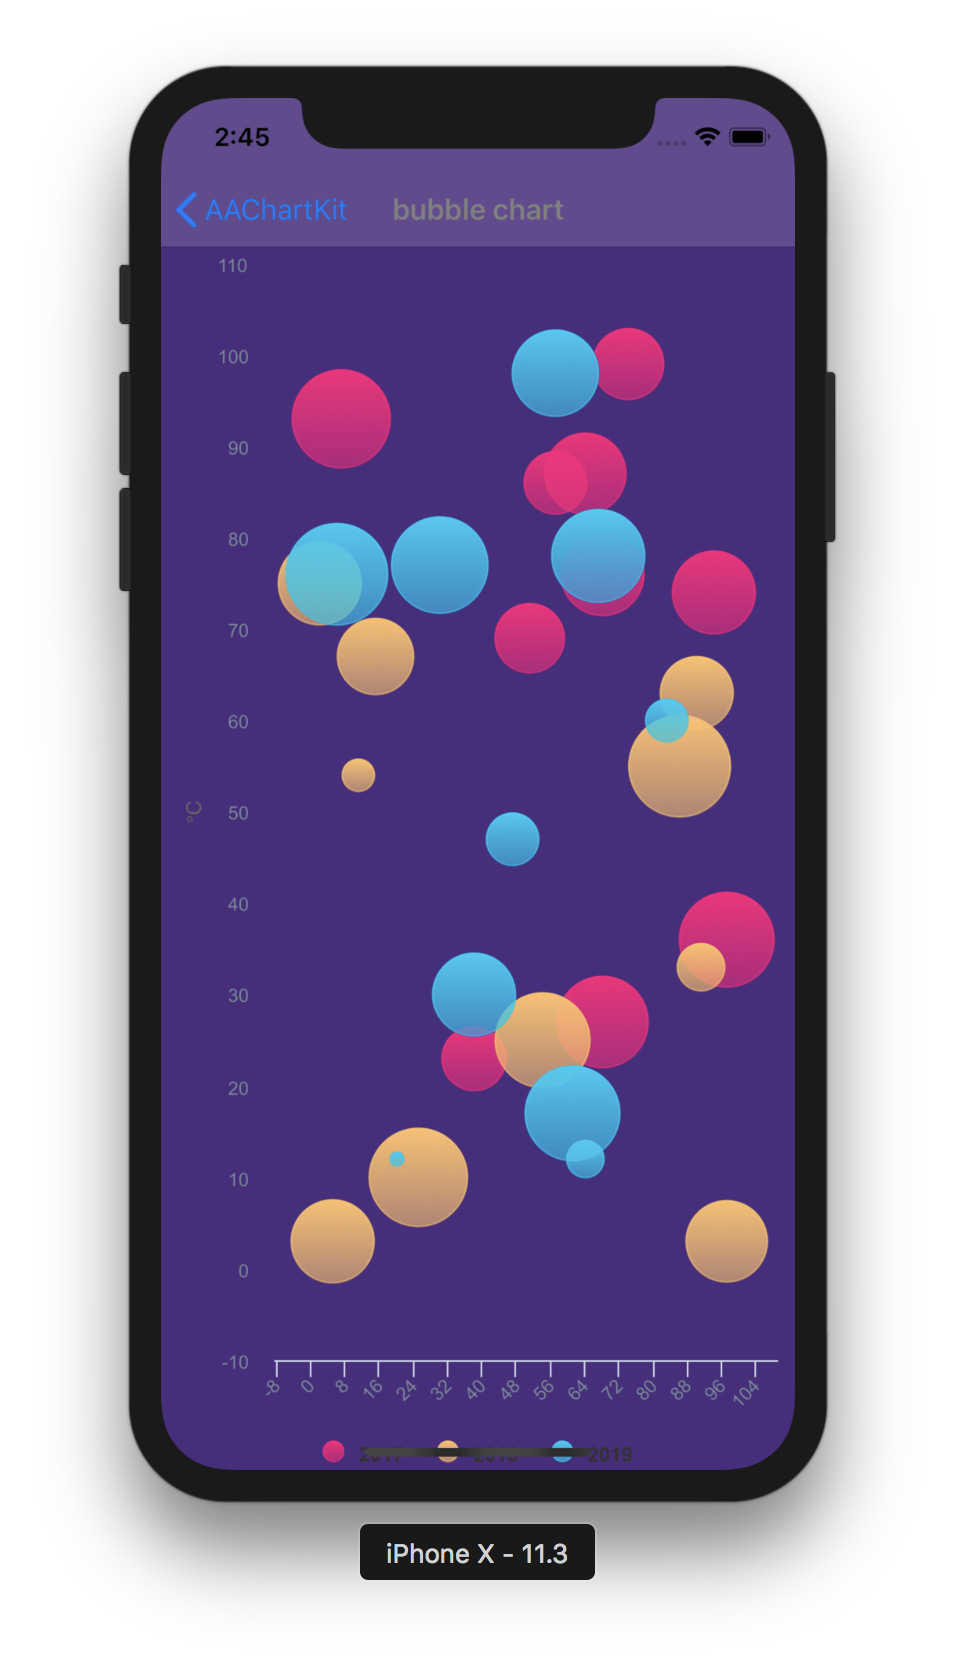 | 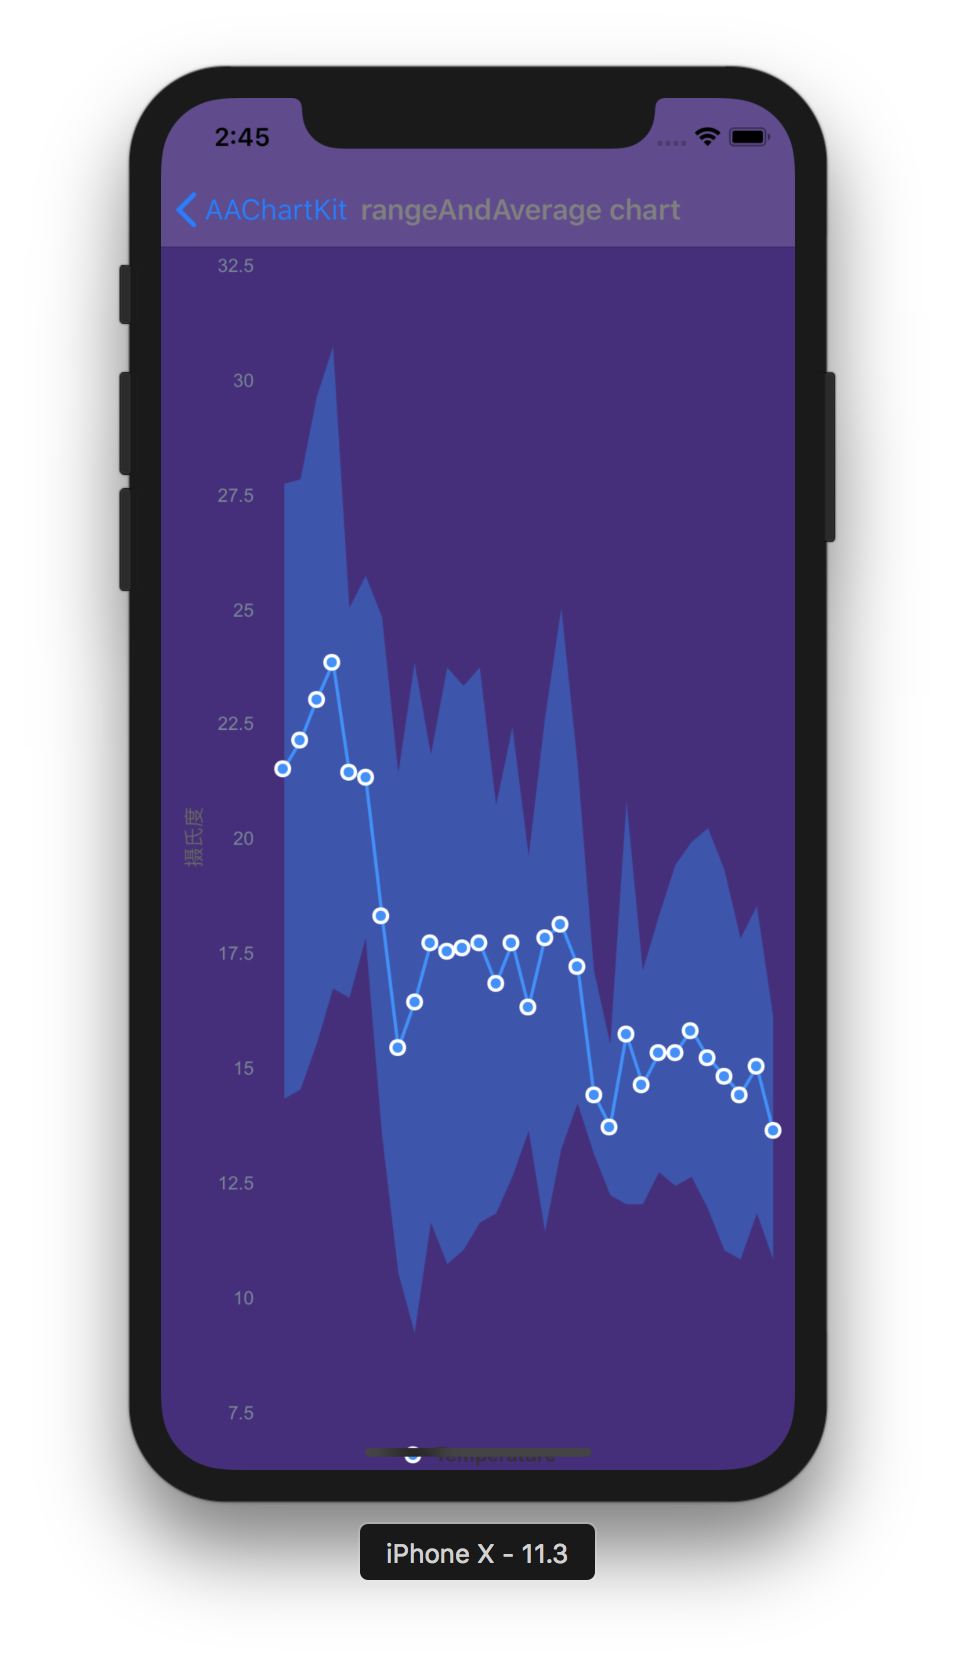 | 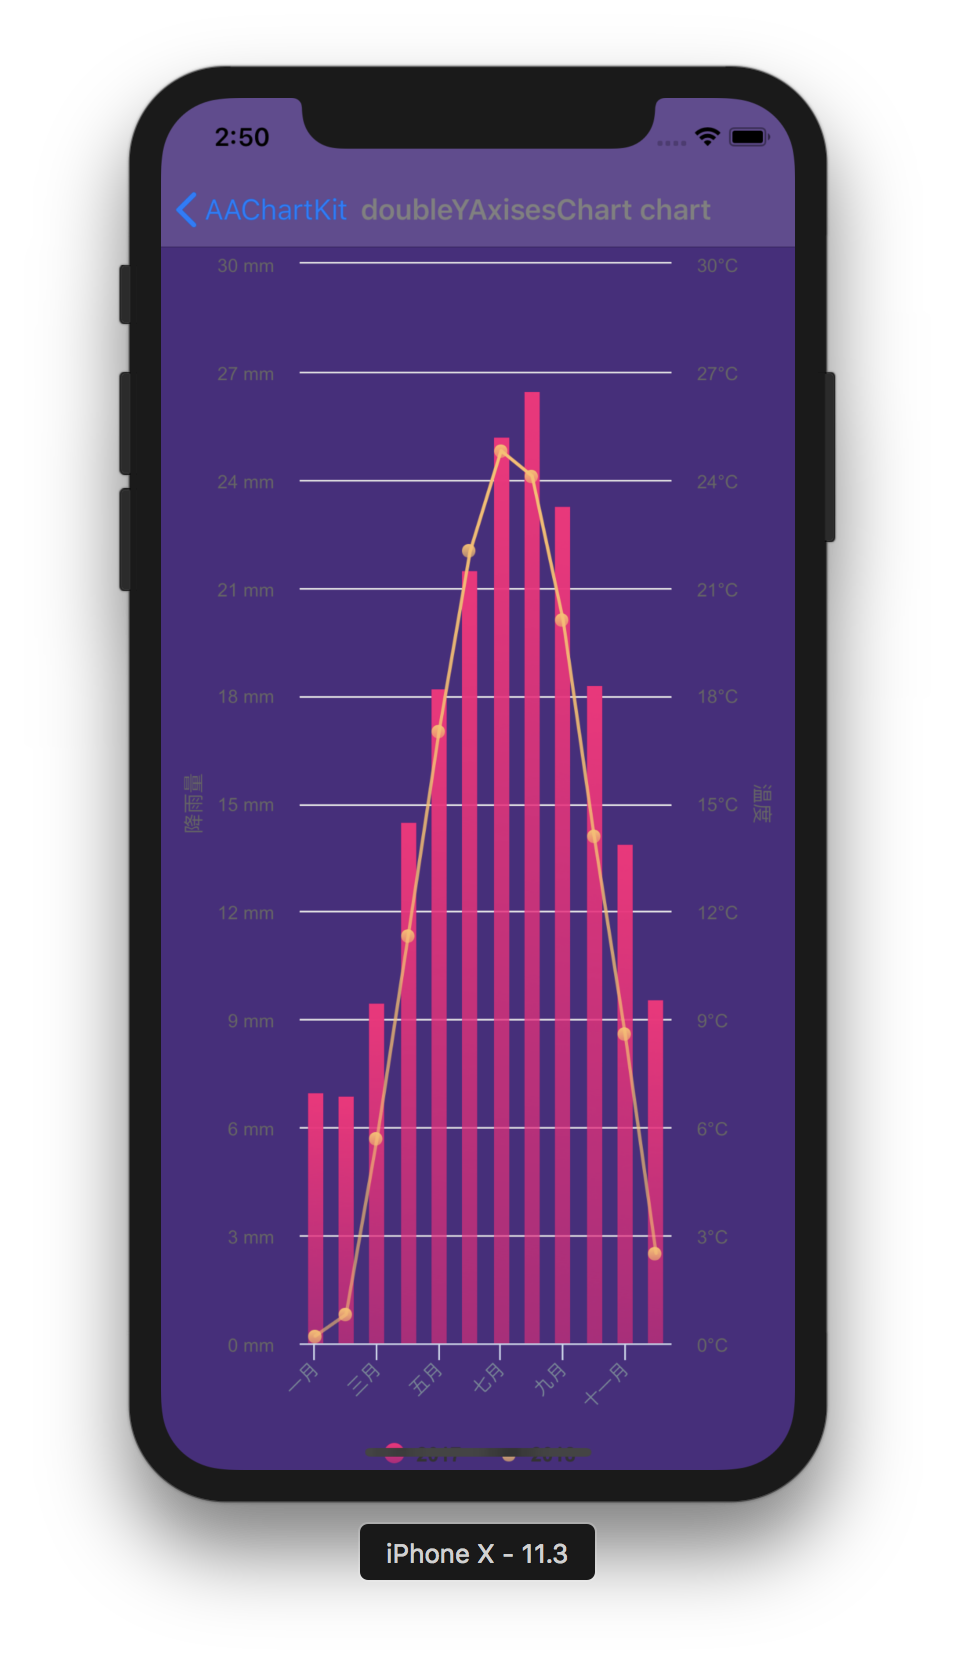 |
| Scatter Chart | Boxplot Chart | Mirror Column Chart |
|---|---|---|
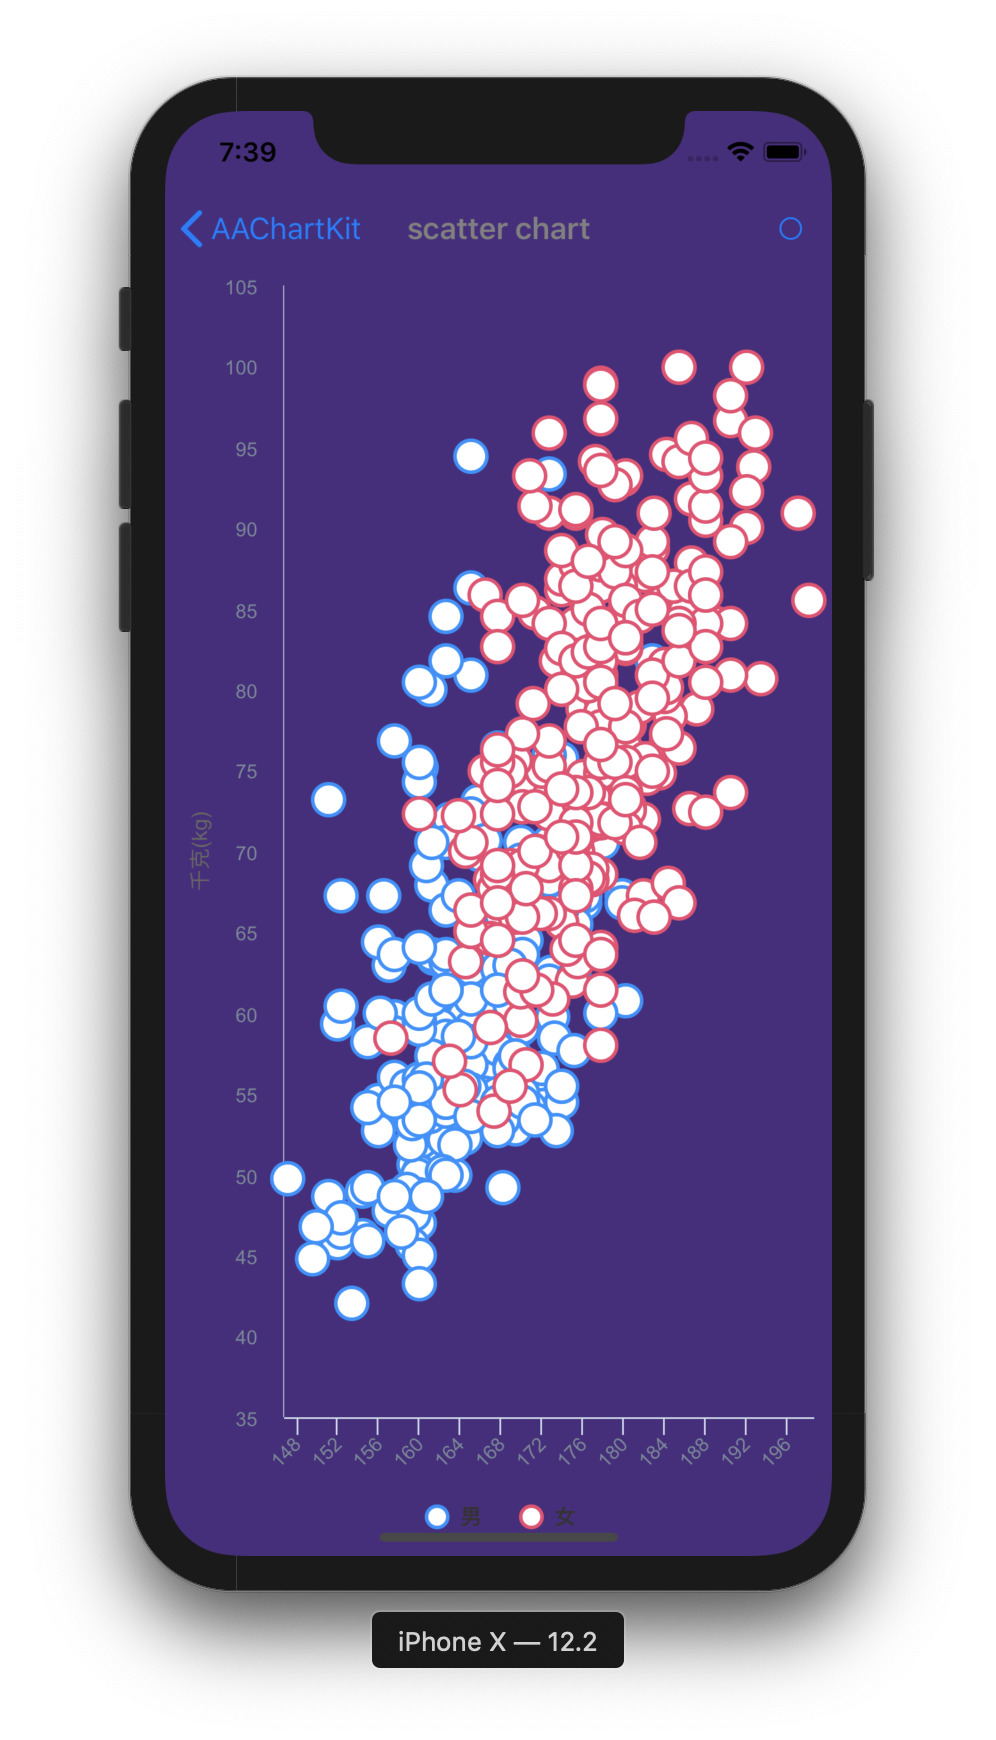 | 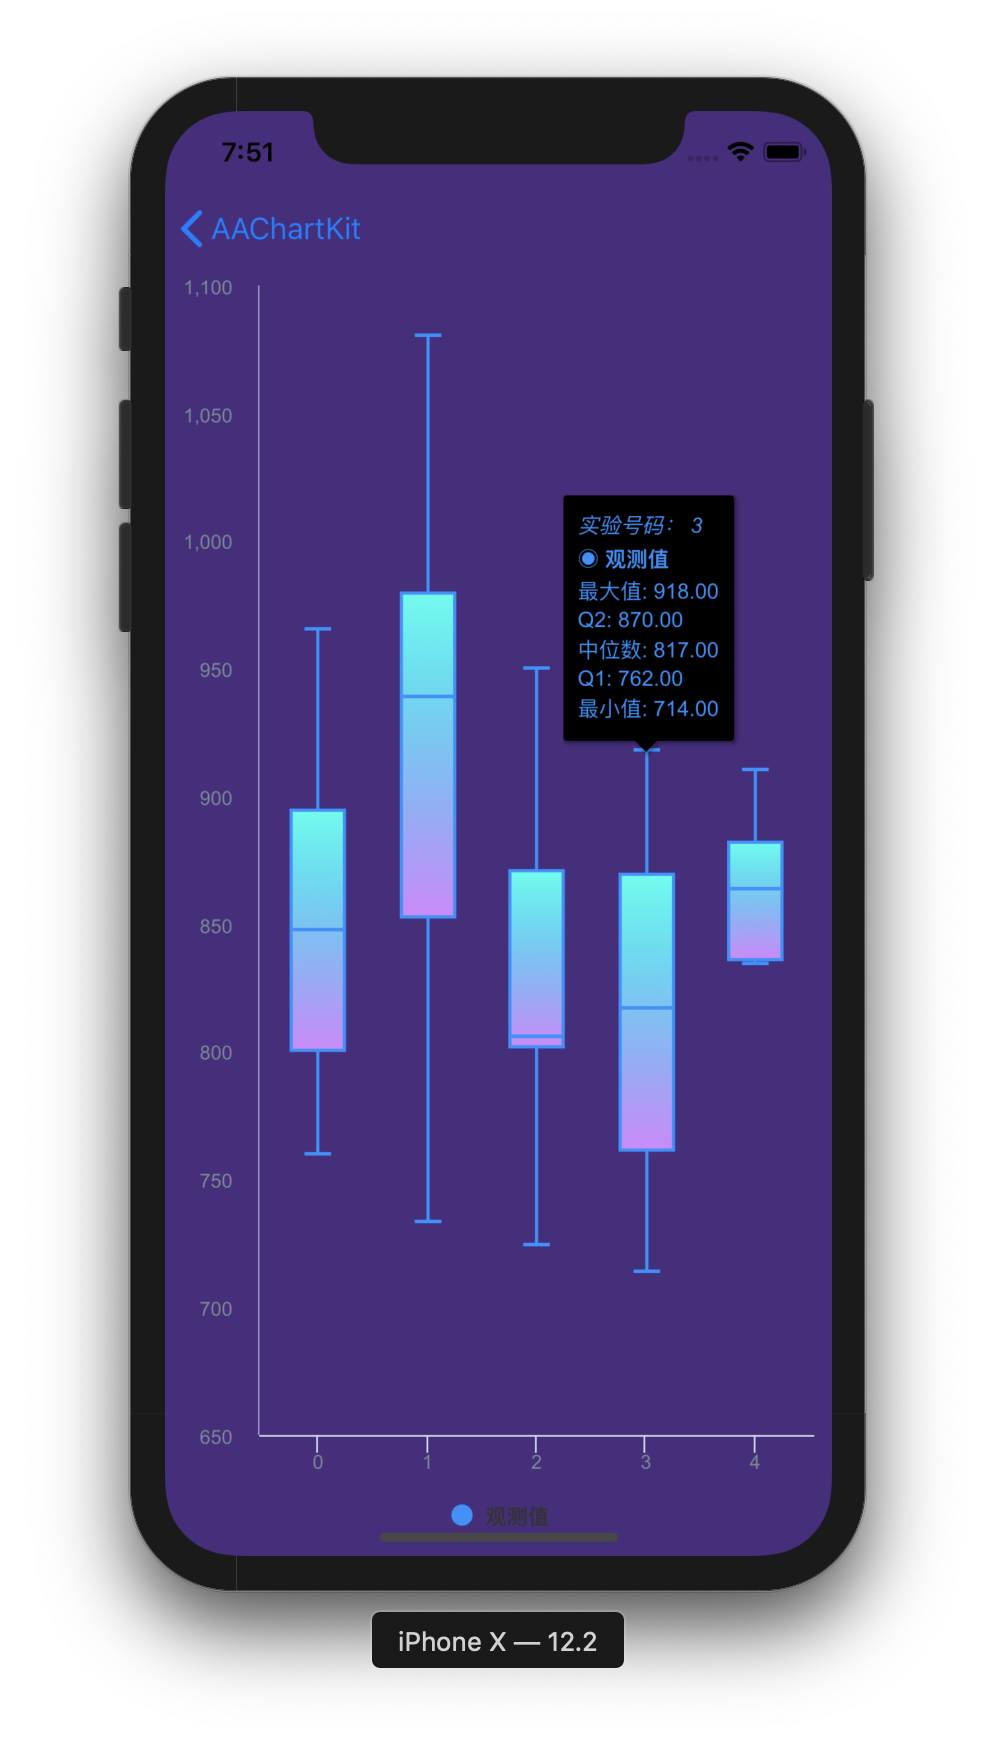 | 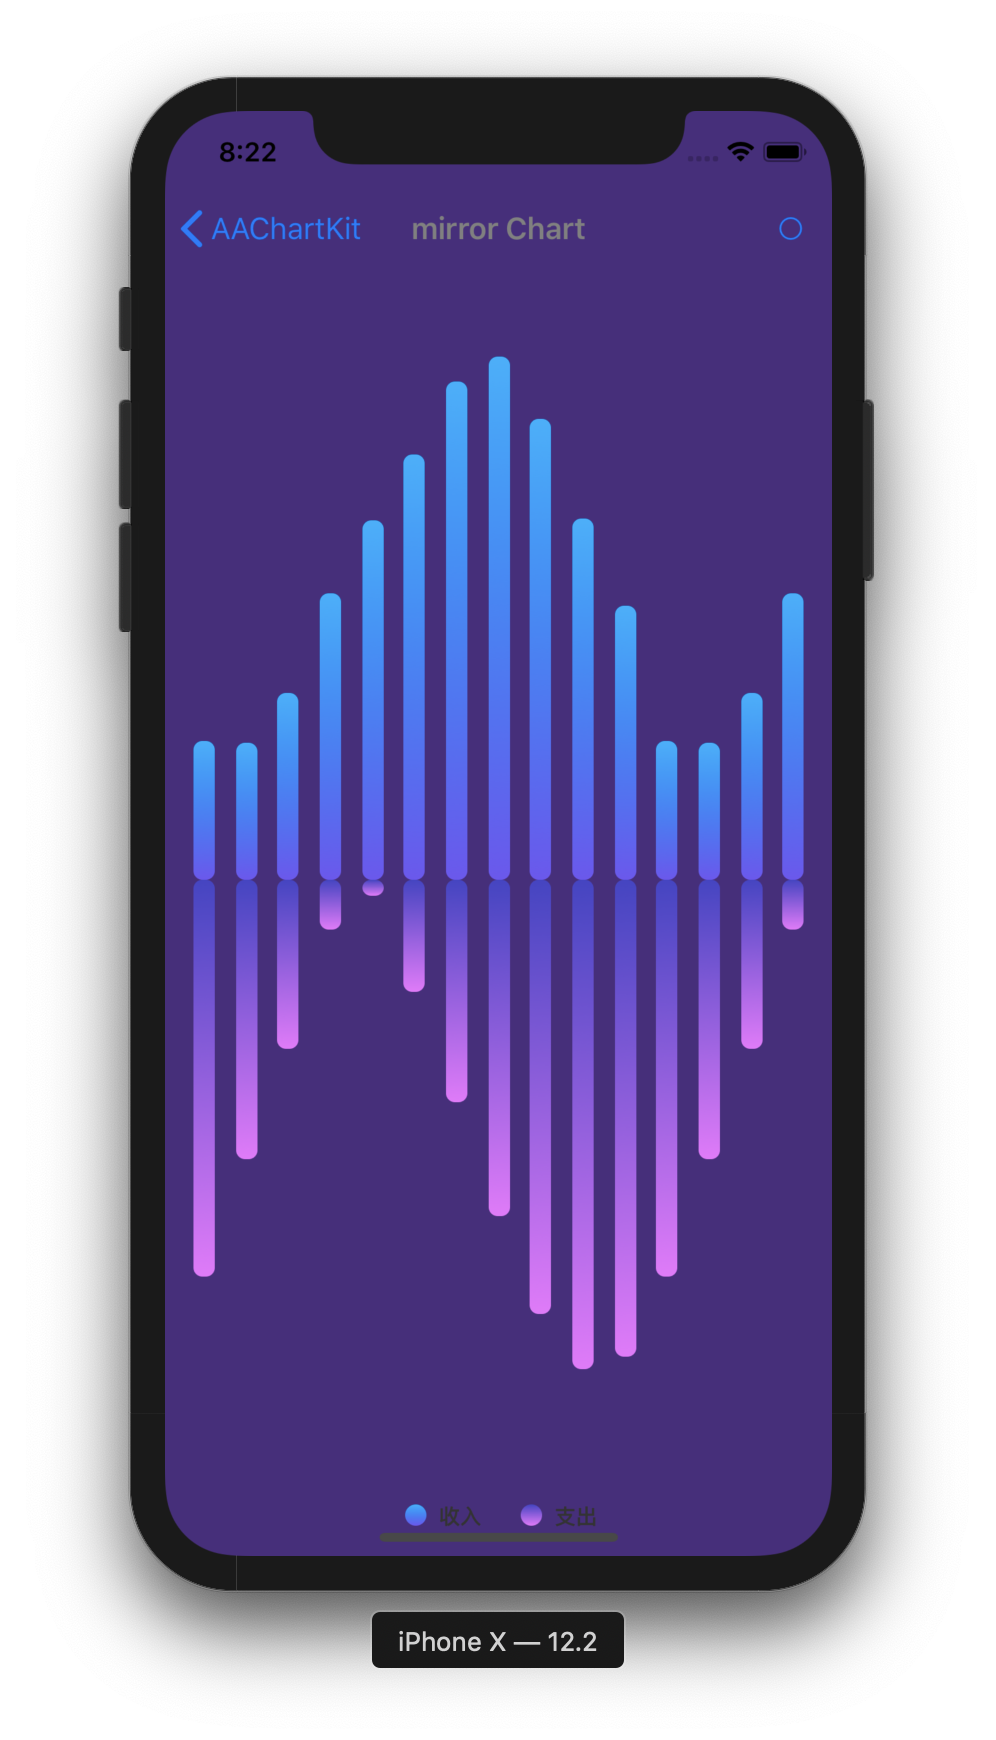 |
Installation
CocoaPods (recommended practice)
- Add following content
pod 'AAChartKit', :git => 'https://github.com/AAChartModel/AAChartKit.git'
to your Podfile.
- Run
pod installorpod update.
Manually (old school way)
-
Drag the
AAChartKitLibfolder into your project. -
Add the following to your
.pchfile.
#import "AAGlobalMacro.h"
Usage
- Add the following to your view controller file:
#import "AAChartKit.h"
- Create an instance object of chart view:
AAChartView
CGFloat chartViewWidth  = self.view.frame.size.width;
CGFloat chartViewHeight = self.view.frame.size.height - 250;
_aaChartView = [[AAChartView alloc]init];
_aaChartView.frame = CGRectMake(0, 60, chartViewWidth, chartViewHeight);
//_aaChartView.scrollEnabled = NO;
[self.view addSubview:_aaChartView];
- Configure the chart model properties:
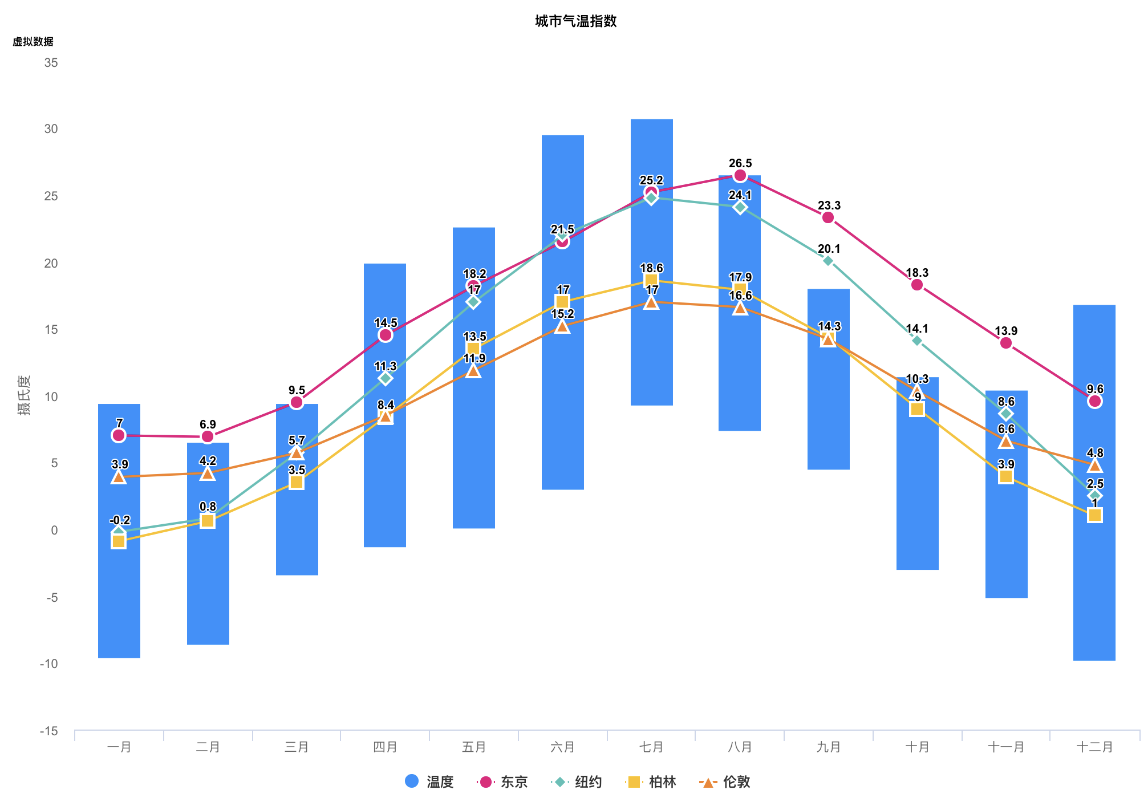
AAChartModel
AAChartModel *aaChartModel = AAChartModel.new
.chartTypeSet(AAChartTypeArea)
.titleSet(@"THE HEAT OF PROGRAMMING LANGUAGE")
.subtitleSet(@"Virtual Data")
.categoriesSet(@[@"Java",@"Swift",@"Python",@"Ruby", @"PHP",@"Go",@"C",@"C#",@"C++"])
.yAxisTitleSet(@"Degrees Celsius")
.seriesSet(@[
    AASeriesElement.new
        .nameSet(@"2017")
        .dataSet(@[@7.0, @6.9, @9.5, @14.5, @18.2, @21.5, @25.2, @26.5, @23.3, @18.3, @13.9, @9.6]),
    AASeriesElement.new
        .nameSet(@"2018")
        .dataSet(@[@0.2, @0.8, @5.7, @11.3, @17.0, @22.0, @24.8, @24.1, @20.1, @14.1, @8.6, @2.5]),
    AASeriesElement.new
        .nameSet(@"2019")
        .dataSet(@[@0.9, @0.6, @3.5, @8.4, @13.5, @17.0, @18.6, @17.9, @14.3, @9.0, @3.9, @1.0]),
    AASeriesElement.new
        .nameSet(@"2020")
        .dataSet(@[@3.9, @4.2, @5.7, @8.5, @11.9, @15.2, @17.0, @16.6, @14.2, @10.3, @6.6, @4.8]),
]);
- Draw the chart (this method is only called the first time you create an AAChartView instance object)
//The chart view object calls the instance object of AAChartModel and draws the final graphic
[_aaChartView aa_drawChartWithChartModel:aaChartModel];
ððð Congratulations! Everything was done!!! You will get what you want!!! ððð
Update chart content
If you want to refresh chart content, you should do something as follow. According to your actual needs, select the function that fits you.
- Refresh the chart data (this method is recommended for updating the series data dynamically)
//Refresh the chart dynamically only when the series attribute of the AAChartModel object is updated
[_aaChartView aa_onlyRefreshTheChartDataWithChartModelSeries:aaChartModelSeriesArray];
- Refresh the chart, minus the chart data (this method is recommended for subsequent refreshes after the first drawing of graphics has completed. If you want to update the chart data only, you should use the function
aa_onlyRefreshTheChartDataWithChartModelSeries)
//Refresh the chart after the AAChartModel content is updated
[_aaChartView aa_refreshChartWithChartModel:aaChartModel];
Samples
-
line chart
-
column chart
-
 bar chart
-
special area chart one

-
special area chart two
-
special area chart three

-
radar chart
-
polar chart
-
pie chart
-
bubble chart
-
scatter chart
-
arearange chart
-
step area chart
-
mixed chart
More graphics
- Note: The following
DEMO pictureis aGIF dynamic picturewhich has a size of around 6M. If you don't see any dynamic preview, then this is because the picture resources were not fully loaded. In such a case please be patient and wait for the contents to finish loading. Maybe you need to reload this page.
Special instructions
Support user click events and move over events
you can monitor the user touch events message through implementing delegate function for AAChartView instance object
//Set AAChartView events delegate
self.aaChartView.delegate = self;
//implement AAChartView user touch events delegate function
#pragma mark -- AAChartView delegate
- (void)aaChartView:(AAChartView *)aaChartView moveOverEventWithMessage:(AAMoveOverEventMessageModel *)message {
NSLog(@"ðselected point series element name: %@",message.name);
}
The received touch events message contain following content
@interface AAMoveOverEventMessageModel : NSObject

@property (nonatomic, copy)   NSString *name;
@property (nonatomic, strong) NSNumber *x;
@property (nonatomic, strong) NSNumber *y;
@property (nonatomic, copy)   NSString *category;
@property (nonatomic, strong) NSDictionary *offset;
@property (nonatomic, assign) NSUInteger index;

@end
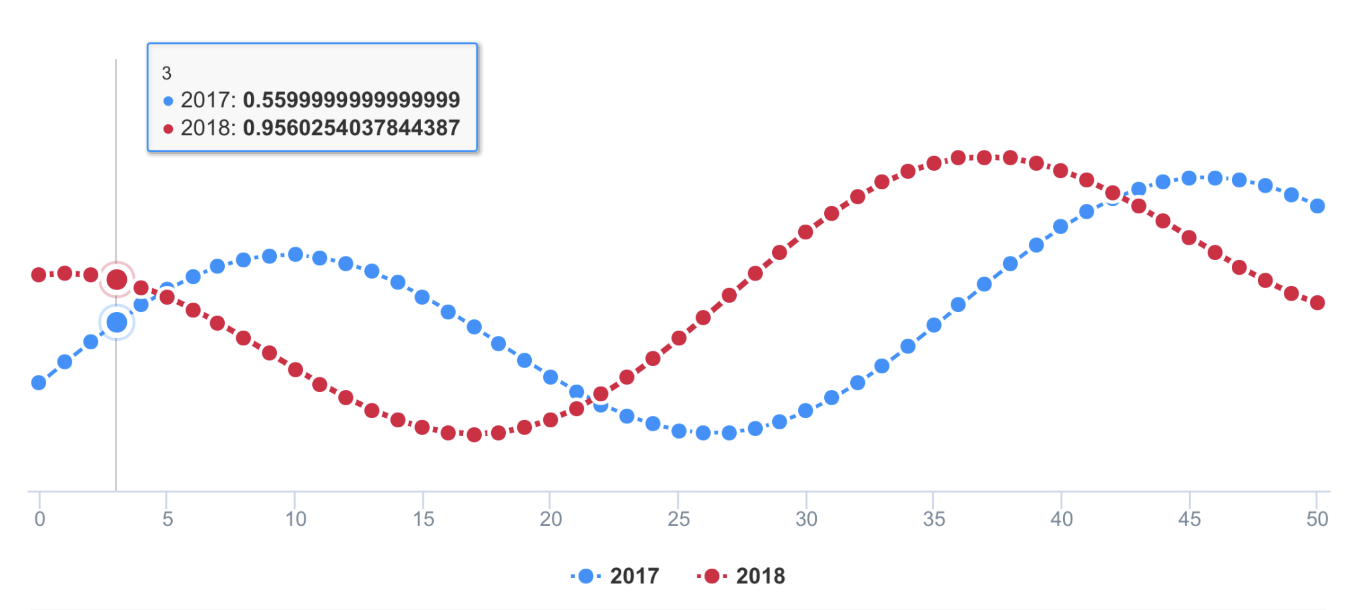
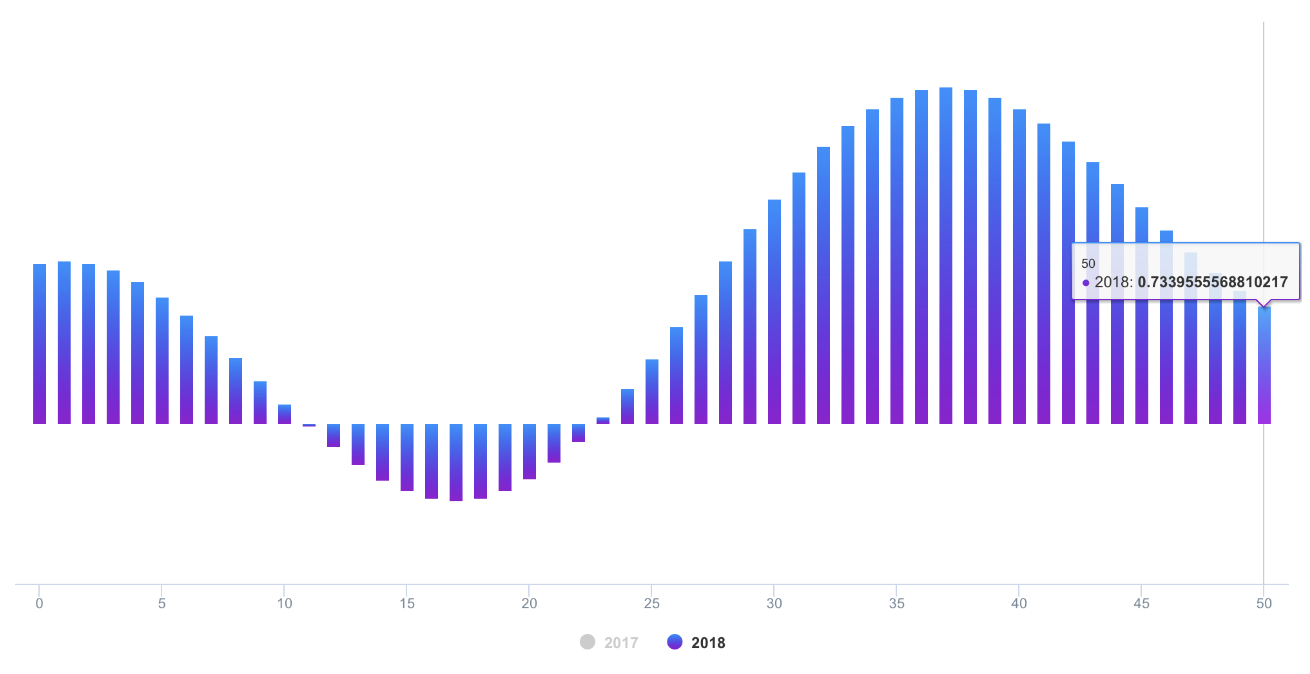
Monitoring user click events can achieve a variety of custom functions. For example, you can implement Double Charts Linkage through user click event callbacks. The example effects are as follows
Support for custom the style of chart AATooltip through JavaScript function
As we all know, AAChartKit support using HTML String. Most of time, the headerFormat ãpointFormatãfooterFormat HTML string is enough for customizing chart tooltip string content, However, sometimes the needs of APP is so weird to satified, in this time, you can even customize the chart tooltip style via formatter JavaScript function.
For example
- configuring AATooltip instance object properties as follow:
/*Custom Tooltip Style ---*/
AATooltip *tooltip = aaOptions.tooltip;
tooltip
.useHTMLSet(true)
.formatterSet(@AAJSFunc(function () {
return ' ð ð ð ð ð ð ð ð <br/> '
+ ' Support JavaScript Function Just Right Now !!! <br/> '
+ ' The Gold Price For <b>2020 '
+ this.x
+ ' </b> Is <b> '
+ this.y
+ ' </b> Dollars ';
}))
.valueDecimalsSet(@2)
.backgroundColorSet(@"#000000")
.borderColorSet(@"#000000")
.styleSet(AAStyleColorSize(@"#FFD700", 12))
;
you can get the customized tooltip style chart like thisð

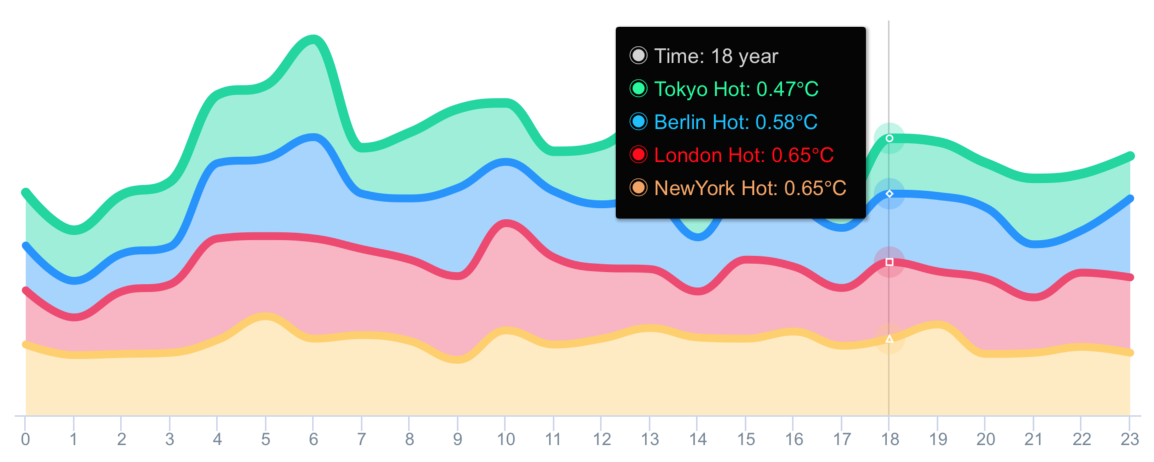
- configuring AATooltip instance object properties as follow:
aaOptions.tooltip
.useHTMLSet(true)
.formatterSet(@AAJSFunc(function () {
let wholeContentStr ='<span style=\"' + 'color:lightGray; font-size:13px\"' + '>â Time: ' + this.x + ' year</span><br/>';
let length = this.points.length;
for (let i = 0; i < length; i++) {
let thisPoint = this.points[i];
let yValue = thisPoint.y;
if (yValue != 0) {
let spanStyleStartStr = '<span style=\"' + 'color:'+ thisPoint.color + '; font-size:13px\"' + '>â ';
let spanStyleEndStr = '</span> <br/>';
wholeContentStr += spanStyleStartStr + thisPoint.series.name + ': ' + thisPoint.y + 'â' + spanStyleEndStr;
}
}
return wholeContentStr;
}))
.backgroundColorSet(@"#050505")
.borderColorSet(@"#050505")
;
you can get the customized tooltip style chart like thisð
Support value range segmentation
-
chart with value range segmentation
bands ð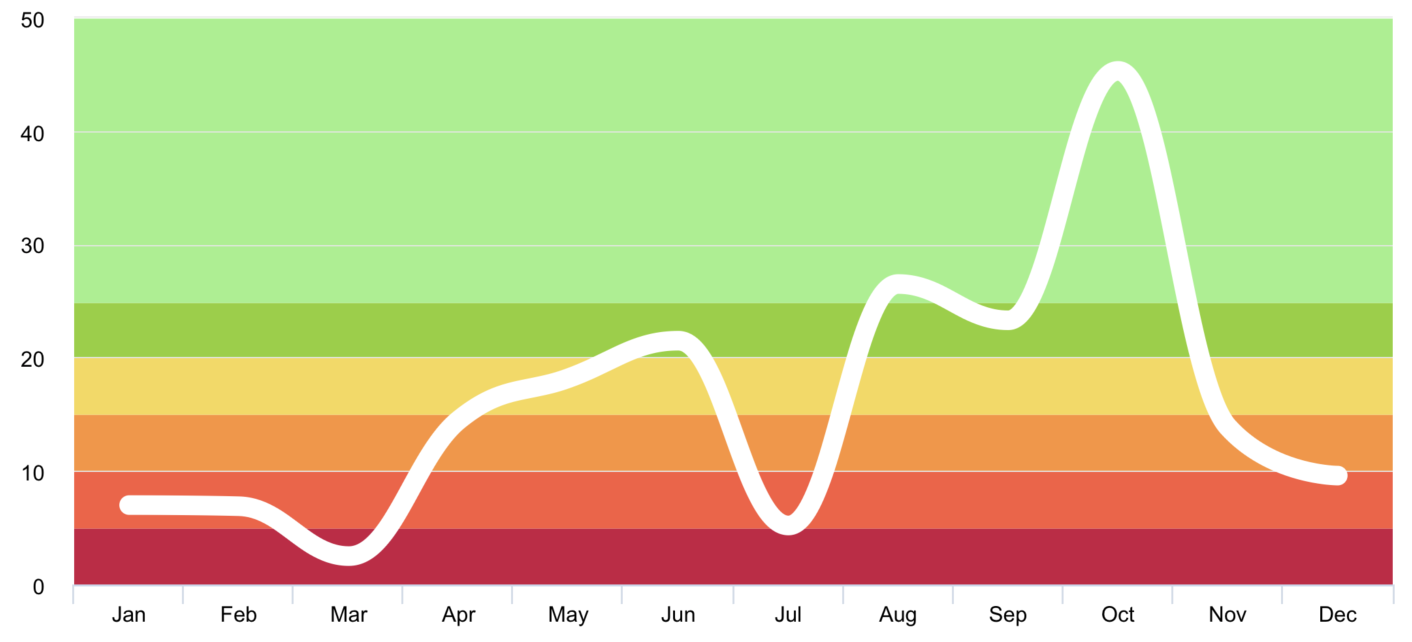
-
chart with value range segmentation
lines ð§¶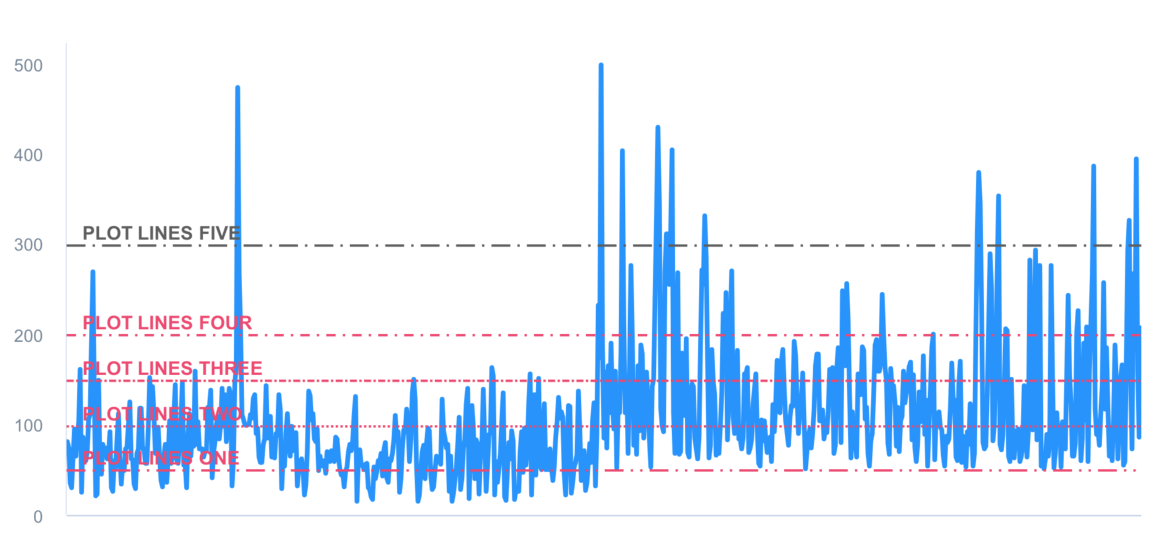
-
chart with value range segmentation
zones ð§±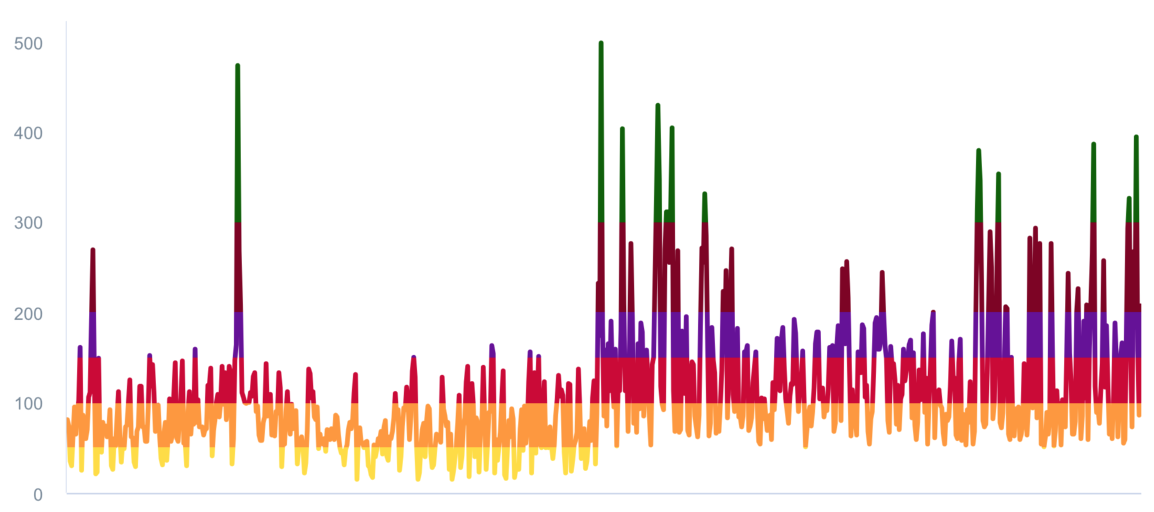
Support scrolling update chart data

Support data sorting with animation effect
Supported chart types for now
typedef NSString *AAChartType;

AACHARTKIT_EXTERN AAChartType const AAChartTypeColumn;          //column chart
AACHARTKIT_EXTERN AAChartType const AAChartTypeBar;             //bar chart
AACHARTKIT_EXTERN AAChartType const AAChartTypeArea;            //area chart
AACHARTKIT_EXTERN AAChartType const AAChartTypeAreaspline;      //area spline chart
AACHARTKIT_EXTERN AAChartType const AAChartTypeLine;            //line chart
AACHARTKIT_EXTERN AAChartType const AAChartTypeSpline;          //spline chart
AACHARTKIT_EXTERN AAChartType const AAChartTypeScatter;         //scatter chart
AACHARTKIT_EXTERN AAChartType const AAChartTypePie;             //pie chart
AACHARTKIT_EXTERN AAChartType const AAChartTypeBubble;          //bubble chart
AACHARTKIT_EXTERN AAChartType const AAChartTypePyramid;         //pyramid chart
AACHARTKIT_EXTERN AAChartType const AAChartTypeFunnel;          //funnel chart
AACHARTKIT_EXTERN AAChartType const AAChartTypeColumnrange;     //column range chart
AACHARTKIT_EXTERN AAChartType const AAChartTypeArearange;       //area range chart
AACHARTKIT_EXTERN AAChartType const AAChartTypeAreasplinerange; //area spline range chart
AACHARTKIT_EXTERN AAChartType const AAChartTypeBoxplot;         //box plot chart
AACHARTKIT_EXTERN AAChartType const AAChartTypeWaterfall;       //Waterfall chart
AACHARTKIT_EXTERN AAChartType const AAChartTypePolygon;         //polygon chart
AACHARTKIT_EXTERN AAChartType const AAChartTypeGauge;           //gauge chart
AACHARTKIT_EXTERN AAChartType const AAChartTypeErrorbar;        //error bar chart
Supported zoom guesture types for now
typedef NSString *AAChartZoomType;

AACHARTKIT_EXTERN AAChartZoomType const AAChartZoomTypeNone;
AACHARTKIT_EXTERN AAChartZoomType const AAChartZoomTypeX;
AACHARTKIT_EXTERN AAChartZoomType const AAChartZoomTypeY;
AACHARTKIT_EXTERN AAChartZoomType const AAChartZoomTypeXY;
Suppported line dash style types for now
AACHARTKIT_EXTERN AAChartLineDashStyleType const AAChartLineDashStyleTypeSolid; //âââââââââââââââââââââââââââââââââââ
AACHARTKIT_EXTERN AAChartLineDashStyleType const AAChartLineDashStyleTypeShortDash; //â â â â â â â â â â â â â â â â â â
AACHARTKIT_EXTERN AAChartLineDashStyleType const AAChartLineDashStyleTypeShortDot; //âµâµâµâµâµâµâµâµâµâµâµâµâµâµâµâµâµâµâµâµâµâµâµâµâµâµâµâµ
AACHARTKIT_EXTERN AAChartLineDashStyleType const AAChartLineDashStyleTypeShortDashDot; //ââ§ââ§ââ§ââ§ââ§ââ§ââ§ââ§ââ§ââ§ââ§ââ§ââ§ââ§ââ§ââ§ââ§ââ§
AACHARTKIT_EXTERN AAChartLineDashStyleType const AAChartLineDashStyleTypeShortDashDotDot; //ââ§â§ââ§â§ââ§â§ââ§â§ââ§â§ââ§â§ââ§â§ââ§â§ââ§â§ââ§â§ââ§â§ââ§â§
AACHARTKIT_EXTERN AAChartLineDashStyleType const AAChartLineDashStyleTypeDot; //â§â§â§â§â§â§â§â§â§â§â§â§â§â§â§â§â§â§â§â§â§â§â§â§â§â§â§â§â§â§â§â§â§â§â§
AACHARTKIT_EXTERN AAChartLineDashStyleType const AAChartLineDashStyleTypeDash; //ââ ââ ââ ââ ââ ââ ââ ââ ââ ââ ââ ââ
AACHARTKIT_EXTERN AAChartLineDashStyleType const AAChartLineDashStyleTypeLongDash; //âââ âââ âââ âââ âââ âââ âââ âââ âââ
AACHARTKIT_EXTERN AAChartLineDashStyleType const AAChartLineDashStyleTypeDashDot; //âââ§âââ§âââ§âââ§âââ§âââ§âââ§âââ§âââ§âââ§âââ§âââ§
AACHARTKIT_EXTERN AAChartLineDashStyleType const AAChartLineDashStyleTypeLongDashDot; //ââââ§ââââ§ââââ§ââââ§ââââ§ââââ§ââââ§ââââ§ââââ§
AACHARTKIT_EXTERN AAChartLineDashStyleType const AAChartLineDashStyleTypeLongDashDotDot; //ââââ§â§ââââ§â§ââââ§â§ââââ§â§ââââ§â§ââââ§â§ââââ§â§
Supported animation types for now
typedef NS_ENUM(NSInteger,AAChartAnimation) {
    AAChartAnimationLinear = 0,
    AAChartAnimationEaseInQuad,
    AAChartAnimationEaseOutQuad,
    AAChartAnimationEaseInOutQuad,
    AAChartAnimationEaseInCubic,
    AAChartAnimationEaseOutCubic,
    AAChartAnimationEaseInOutCubic,
    AAChartAnimationEaseInQuart,
    AAChartAnimationEaseOutQuart,
    AAChartAnimationEaseInOutQuart,
    AAChartAnimationEaseInQuint,
    AAChartAnimationEaseOutQuint,
    AAChartAnimationEaseInOutQuint,
    AAChartAnimationEaseInSine,
    AAChartAnimationEaseOutSine,
    AAChartAnimationEaseInOutSine,
    AAChartAnimationEaseInExpo,
    AAChartAnimationEaseOutExpo,
    AAChartAnimationEaseInOutExpo,
    AAChartAnimationEaseInCirc,
    AAChartAnimationEaseOutCirc,
    AAChartAnimationEaseInOutCirc,
    AAChartAnimationEaseOutBounce,
    AAChartAnimationEaseInBack,
    AAChartAnimationEaseOutBack,
    AAChartAnimationEaseInOutBack,
    AAChartAnimationElastic,
    AAChartAnimationSwingFromTo,
    AAChartAnimationSwingFrom,
    AAChartAnimationSwingTo,
    AAChartAnimationBounce,
    AAChartAnimationBouncePast,
    AAChartAnimationEaseFromTo,
    AAChartAnimationEaseFrom,
    AAChartAnimationEaseTo,
};
Here are the ten concrete animation types of AAChartKit
| Back | Bounce | Circ | Cubic | Elastic |
|---|---|---|---|---|
 |  |  |  |  |
| Expo | Quad | Quart | Quint | Sine |
|---|---|---|---|---|
 |  |  |  |  |
AAChartModel:chart attribute list
AAPropStatementAndPropSetFuncStatement(copy,   AAChartModel, NSString *, title)
AAPropStatementAndPropSetFuncStatement(strong, AAChartModel, AAStyle  *, titleStyle)

AAPropStatementAndPropSetFuncStatement(copy,   AAChartModel, NSString *, subtitle)
AAPropStatementAndPropSetFuncStatement(strong, AAChartModel, AAStyle  *, subtitleStyle)
AAPropStatementAndPropSetFuncStatement(copy,   AAChartModel, AAChartAlignType, subtitleAlign)

AAPropStatementAndPropSetFuncStatement(copy,   AAChartModel, NSString *, backgroundColor)
AAPropStatementAndPropSetFuncStatement(strong, AAChartModel, NSArray  *, colorsTheme)
AAPropStatementAndPropSetFuncStatement(strong, AAChartModel, NSArray     <NSString *>*, categories)
AAPropStatementAndPropSetFuncStatement(strong, AAChartModel, NSArray  *, series)

AAPropStatementAndPropSetFuncStatement(copy,   AAChartModel, AAChartType,            chartType)
AAPropStatementAndPropSetFuncStatement(copy,   AAChartModel, AAChartStackingType,    stacking)
AAPropStatementAndPropSetFuncStatement(copy,   AAChartModel, AAChartSymbolType,      markerSymbol)
AAPropStatementAndPropSetFuncStatement(assign, AAChartModel, AAChartSymbolStyleType, markerSymbolStyle)
AAPropStatementAndPropSetFuncStatement(copy,   AAChartModel, AAChartZoomType,        zoomType)

AAPropStatementAndPropSetFuncStatement(assign, AAChartModel, AAChartAnimation,       animationType)
AAPropStatementAndPropSetFuncStatement(strong, AAChartModel, NSNumber *, animationDuration)
AAPropStatementAndPropSetFuncStatement(assign, AAChartModel, BOOL,       inverted)
AAPropStatementAndPropSetFuncStatement(assign, AAChartModel, BOOL,       polar)
AAPropStatementAndPropSetFuncStatement(strong, AAChartModel, NSArray  *, margin)

AAPropStatementAndPropSetFuncStatement(assign, AAChartModel, BOOL,       dataLabelsEnabled)
AAPropStatementAndPropSetFuncStatement(strong, AAChartModel, AAStyle  *, dataLabelsStyle)

AAPropStatementAndPropSetFuncStatement(assign, AAChartModel, BOOL,       xAxisVisible)
AAPropStatementAndPropSetFuncStatement(assign, AAChartModel, BOOL,       xAxisReversed)
AAPropStatementAndPropSetFuncStatement(assign, AAChartModel, BOOL,       xAxisLabelsEnabled)
AAPropStatementAndPropSetFuncStatement(strong, AAChartModel, AAStyle  *, xAxisLabelsStyle)
AAPropStatementAndPropSetFuncStatement(strong, AAChartModel, NSNumber *, xAxisTickInterval)
AAPropStatementAndPropSetFuncStatement(strong, AAChartModel, AALineStyle *, xAxisGridLineStyle)
AAPropStatementAndPropSetFuncStatement(strong, AAChartModel, AACrosshair *, xAxisCrosshair)

AAPropStatementAndPropSetFuncStatement(assign, AAChartModel, BOOL,       yAxisVisible)
AAPropStatementAndPropSetFuncStatement(assign, AAChartModel, BOOL,       yAxisReversed)
AAPropStatementAndPropSetFuncStatement(assign, AAChartModel, BOOL,       yAxisLabelsEnabled)
AAPropStatementAndPropSetFuncStatement(strong, AAChartModel, AAStyle  *, yAxisLabelsStyle)
AAPropStatementAndPropSetFuncStatement(copy,   AAChartModel, NSString *, yAxisTitle)
AAPropStatementAndPropSetFuncStatement(strong, AAChartModel, NSNumber *, yAxisLineWidth)
AAPropStatementAndPropSetFuncStatement(assign, AAChartModel, BOOL,       yAxisAllowDecimals)
AAPropStatementAndPropSetFuncStatement(strong, AAChartModel, NSArray  *, yAxisPlotLines)
AAPropStatementAndPropSetFuncStatement(strong, AAChartModel, NSNumber *, yAxisMax)
AAPropStatementAndPropSetFuncStatement(strong, AAChartModel, NSNumber *, yAxisMin)
AAPropStatementAndPropSetFuncStatement(strong, AAChartModel, NSNumber *, yAxisTickInterval)
AAPropStatementAndPropSetFuncStatement(strong, AAChartModel, NSArray  *, yAxisTickPositions)
AAPropStatementAndPropSetFuncStatement(strong, AAChartModel, AALineStyle *, yAxisGridLineStyle)
AAPropStatementAndPropSetFuncStatement(strong, AAChartModel, AACrosshair *, yAxisCrosshair)

AAPropStatementAndPropSetFuncStatement(assign, AAChartModel, BOOL,       tooltipEnabled)
AAPropStatementAndPropSetFuncStatement(assign, AAChartModel, BOOL,       tooltipShared)
AAPropStatementAndPropSetFuncStatement(copy,   AAChartModel, NSString *, tooltipValueSuffix)

AAPropStatementAndPropSetFuncStatement(assign, AAChartModel, BOOL,       connectNulls)
AAPropStatementAndPropSetFuncStatement(assign, AAChartModel, BOOL,       legendEnabled)
AAPropStatementAndPropSetFuncStatement(strong, AAChartModel, NSNumber *, borderRadius)
AAPropStatementAndPropSetFuncStatement(strong, AAChartModel, NSNumber *, markerRadius)
AAPropStatementAndPropSetFuncStatement(strong, AAChartModel, AAScrollablePlotArea *, scrollablePlotArea)
Created By:

_0_
_oo0oo_
o8888888o
88" . "88
(| -_- |)
0\ = /0
___/`---'\___
.' \\| |// '.
/ \\||| : |||// \
/ _||||| -:- |||||- \
| | \\\ - /// | |
| \_| ''\---/'' |_/ |
\ .-\__ '-' ___/-. /
___'. .' /--.--\ `. .'___
."" '< `.___\_<|>_/___.' >' "".
| | : `- \`.;`\ _ /`;.`/ - ` : | |
\ \ `_. \_ __\ /__ _/ .-` / /
=====`-.____`.___ \_____/___.-`___.-'=====
`=---='
*****************************************************
¥¥¥¥¥¥¥¥¥¥¥¥¥¥¥¥¥¥¥¥¥¥¥¥¥¥¥¥¥¥¥¥¥¥¥¥¥¥¥¥¥¥¥
â¬â¬â¬â¬â¬â¬â¬â¬â¬â¬â¬â¬â¬â¬â¬â¬â¬â¬â¬â¬â¬â¬â¬â¬â¬â¬â¬â¬â¬â¬â¬â¬â¬â¬
$$$$$$$$$$$$$$$$$$$$$$$
BUDDHA_BLESS_YOU
AWAY_FROM
BUG
Source Codeâ
Normal Versions
| Language Version | Project Name | Target Platform | Source Code Link |
|---|---|---|---|
| Swift | AAInfographics | iOS | https://github.com/AAChartModel/AAChartKit-Swift |
| Objective C | AAChartKit | iOS | https://github.com/AAChartModel/AAChartKit |
| Kotlin | AAInfographics | Android | https://github.com/AAChartModel/AAChartCore-Kotlin |
| Java | AAChartCore | Android | https://github.com/AAChartModel/AAChartCore |
Pro Versions
Pro Versions are more powerful data visualization frameworks that support more types beautiful chart like bellcurve, bullet, columnpyramid, cylinder, dependencywheel, heatmap, histogram, networkgraph, organization, packedbubble, pareto, sankey, series, solidgauge, streamgraph, sunburst, tilemap, timeline, treemap, variablepie, variwide, vector, venn, windbarb, wordcloud, xrange charts and so on.
| Language | Project Name | Target Platform | Source Code Link |
|---|---|---|---|
| Swift | AAInfographics-Pro | iOS | https://github.com/AAChartModel/AAChartKit-Swift-Pro |
| Objective C | AAChartKit-Pro | iOS | https://github.com/AAChartModel/AAChartKit-Pro |
| Kotlin | AAInfographics-Pro | Android | Coming Soon... |
| Java | AAChartCore-Pro | Android | Coming Soon... |
LICENSE
![]() AAChartKit is available under the MIT license. See the LICENSE file for more information.
AAChartKit is available under the MIT license. See the LICENSE file for more information.
Contact
- ð ð ð ð WARM TIPS!!! ð ð ð ð
- Please contact me on GitHub, if there are any problems encountered in use.
- GitHub Issues : https://github.com/AAChartModel/AAChartKit/issues
- And if you want to contribute for this project, please contact me as well
- GitHub : https://github.com/AAChartModel
- StackOverflow : https://stackoverflow.com/users/12302132
- JianShu : http://www.jianshu.com/u/f1e6753d4254
- SegmentFault : https://segmentfault.com/u/huanghunbieguan
To-Do list
- Support user to add delegate events after the graphics content loading was completed
- Support graphics to refresh global content dynamically
- Support graphics to refresh pure data (
series) content dynamically - Support graphics to refresh pure data in real time and scroll dynamically
- Support color layer gradient effects
- Support 3D graphics effects, valid only for partial graphics such as
column chartãbar chartãpie chartsãscatterplot chartãbubble chart, etc. - Support
CocoaPods - Support
Carthage - Support setting graphics rendering animation freely
- Support user to configure
AAOptionsmodel object properties freely - Support stacking the graphics
- Support reversing the graphics axis
- Support rendering scatter chart
- Support rendering column range map
- Support rendering area range graph
- Support rendering the polar chart
- Support rendering the step line chart
- Support rendering the step area chart
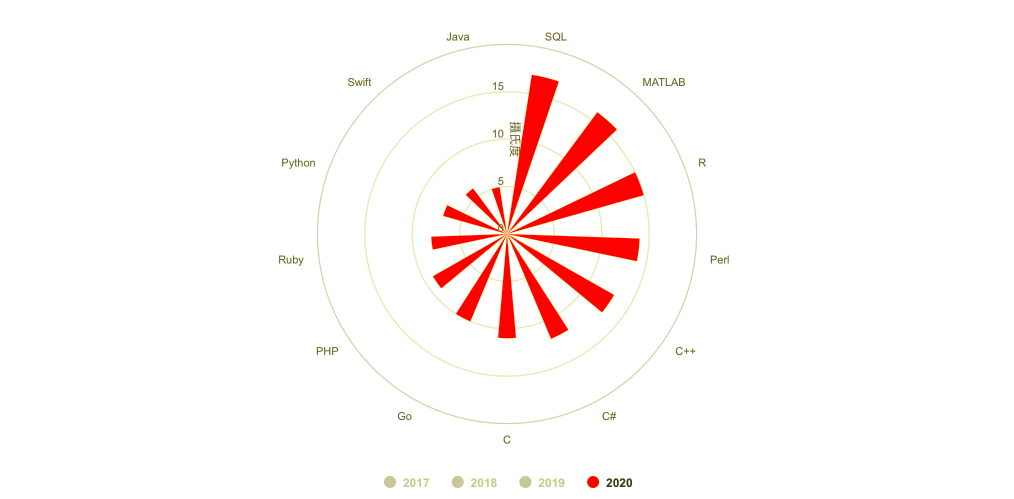
- Support rendering the Nightingale rose ð¹chart
- Support rendering the circular progress bar chart
- Support adding clicked event callbacks for graphics
- Support adding fingerâð» or mouseð± move over event callbacks for graphics
- Support code coverage test
Top Related Projects
Highcharts JS, the JavaScript charting framework
Beautiful charts for iOS/tvOS/OSX! The Apple side of the crossplatform MPAndroidChart.
A powerful 🚀 Android chart view / graph view library, supporting line- bar- pie- radar- bubble- and candlestick charts as well as scaling, panning and animations.
Promises for Swift & ObjC.
Elegant HTTP Networking in Swift
A delightful networking framework for iOS, macOS, watchOS, and tvOS.
Convert designs to code with AI
Introducing Visual Copilot: A new AI model to turn Figma designs to high quality code using your components.
Try Visual Copilot