 GraphView
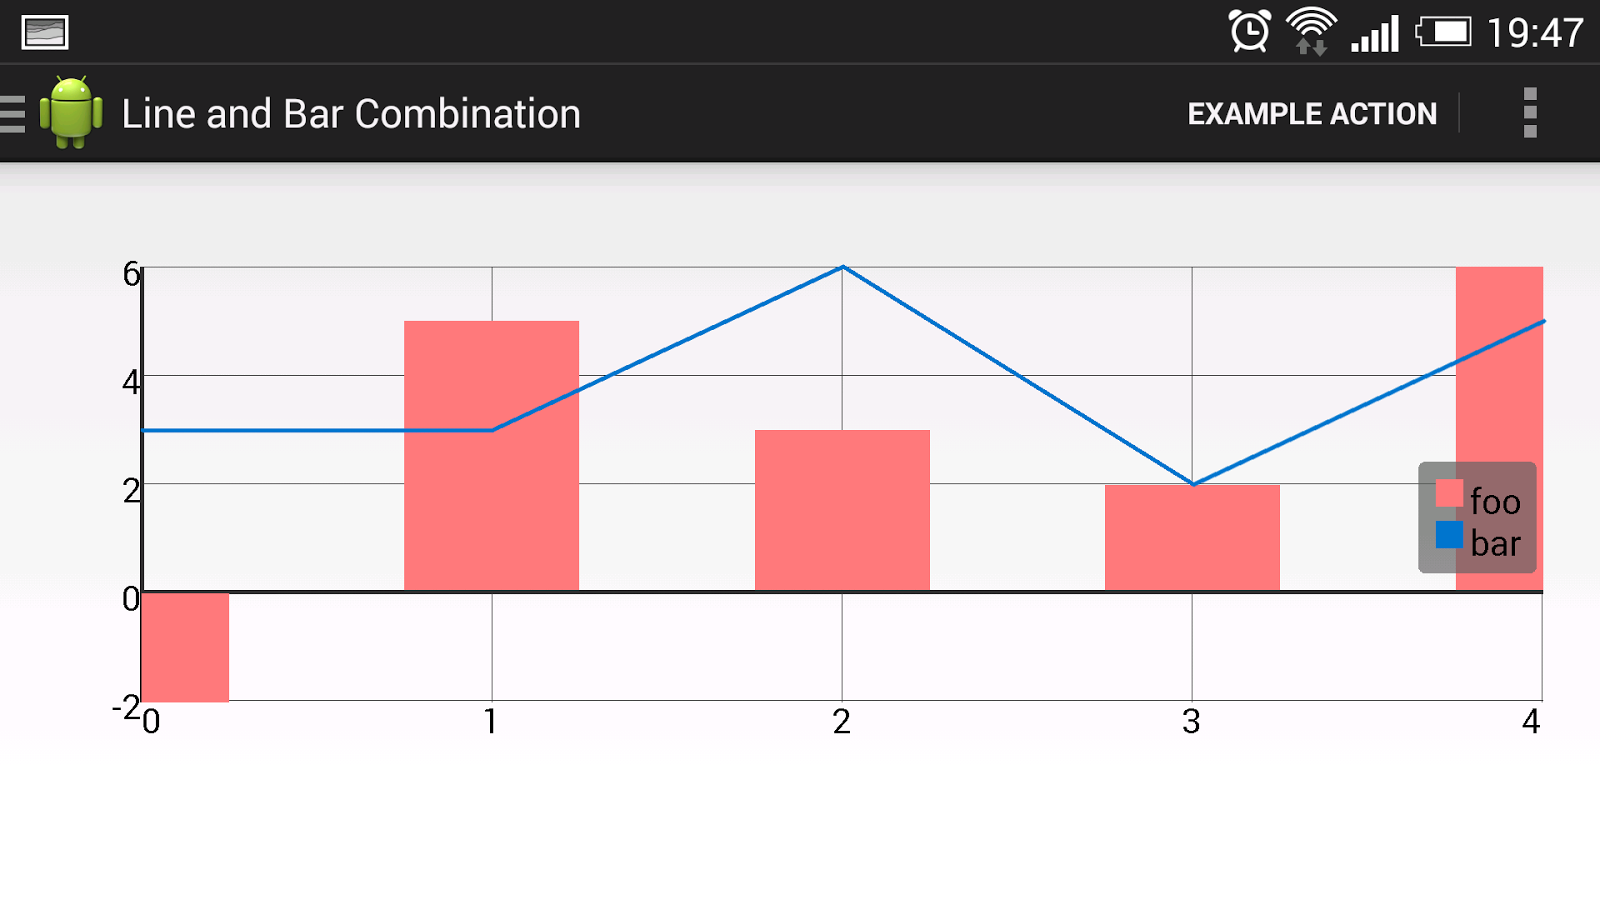
Android Graph Library for creating zoomable and scrollable line and bar graphs.
Top Related Projects

A powerful 🚀 Android chart view / graph view library, supporting line- bar- pie- radar- bubble- and candlestick charts as well as scaling, panning and animations.

AnyChart Android Chart is an amazing data visualization library for easily creating interactive charts in Android apps. It runs on API 19+ (Android 4.4) and features dozens of built-in chart types.

📈📊⛰⛰⛰An elegant modern declarative data visualization chart framework for Android . Extremely powerful, supports line, spline, area, areaspline, column, bar, pie, scatter, angular gauges, arearange, areasplinerange, columnrange, bubble, box plot, error bars, funnel, waterfall and polar chart types.极其精美而又强大的 Android 数据可视化图表框架,支持柱状图、条形图、折线图、曲线图、折线填充图、曲线填充图、气泡图、扇形图、环形图、散点图、雷达图、混合图等各种类型的多达几十种的信息图图表,完全满足工作所需.

Android Library to rapidly develop attractive and insightful charts in android applications.

Charts library for Android compatible with API 8+, several chart types with scaling, scrolling and animations 📊
Quick Overview
GraphView is an Android library for creating flexible and customizable graphs and charts. It supports various types of graphs, including line graphs, bar charts, and point graphs, making it a versatile tool for data visualization in Android applications.
Pros
- Easy to integrate and use in Android projects
- Supports multiple graph types and customization options
- Allows real-time data updates and animations
- Well-documented with numerous examples
Cons
- Limited to Android platform only
- May require additional customization for complex graph scenarios
- Performance may degrade with large datasets
- Some advanced features might require deeper understanding of the library
Code Examples
- Creating a simple line graph:
GraphView graph = findViewById(R.id.graph);
LineGraphSeries<DataPoint> series = new LineGraphSeries<>(new DataPoint[] {
    new DataPoint(0, 1),
    new DataPoint(1, 5),
    new DataPoint(2, 3),
    new DataPoint(3, 2),
    new DataPoint(4, 6)
});
graph.addSeries(series);
- Adding multiple series to a graph:
GraphView graph = findViewById(R.id.graph);
LineGraphSeries<DataPoint> series1 = new LineGraphSeries<>(getDataPoint1());
LineGraphSeries<DataPoint> series2 = new LineGraphSeries<>(getDataPoint2());
graph.addSeries(series1);
graph.addSeries(series2);
- Customizing graph appearance:
GraphView graph = findViewById(R.id.graph);
LineGraphSeries<DataPoint> series = new LineGraphSeries<>(getDataPoints());
series.setColor(Color.GREEN);
series.setDrawDataPoints(true);
series.setDataPointsRadius(10);
series.setThickness(8);
graph.addSeries(series);
graph.getViewport().setYAxisBoundsManual(true);
graph.getViewport().setMinY(0);
graph.getViewport().setMaxY(10);
Getting Started
To use GraphView in your Android project:
-
Add the dependency to your app's
build.gradlefile:dependencies { implementation 'com.jjoe64:graphview:4.2.2' } -
Add a GraphView to your layout XML:
<com.jjoe64.graphview.GraphView android:id="@+id/graph" android:layout_width="match_parent" android:layout_height="200dip" /> -
Create and customize your graph in your Activity or Fragment:
GraphView graph = findViewById(R.id.graph);
LineGraphSeries<DataPoint> series = new LineGraphSeries<>(new DataPoint[] {
    new DataPoint(0, 1),
    new DataPoint(1, 5),
    new DataPoint(2, 3)
});
graph.addSeries(series);
Competitor Comparisons
A powerful 🚀 Android chart view / graph view library, supporting line- bar- pie- radar- bubble- and candlestick charts as well as scaling, panning and animations.
Pros of MPAndroidChart
- More feature-rich with a wider variety of chart types and customization options
- Better performance for large datasets and real-time updates
- More active development and community support
Cons of MPAndroidChart
- Steeper learning curve due to its extensive API and features
- Larger library size, which may impact app size
Code Comparison
MPAndroidChart:
LineChart chart = findViewById(R.id.chart);
LineDataSet dataSet = new LineDataSet(entries, "Label");
LineData lineData = new LineData(dataSet);
chart.setData(lineData);
chart.invalidate();
GraphView:
GraphView graph = findViewById(R.id.graph);
LineGraphSeries<DataPoint> series = new LineGraphSeries<>(dataPoints);
graph.addSeries(series);
MPAndroidChart offers more customization options but requires more code for basic setup, while GraphView provides a simpler API for quick implementations. MPAndroidChart is better suited for complex visualizations and large datasets, whereas GraphView is ideal for simpler graphs with a focus on ease of use.
AnyChart Android Chart is an amazing data visualization library for easily creating interactive charts in Android apps. It runs on API 19+ (Android 4.4) and features dozens of built-in chart types.
Pros of AnyChart-Android
- More comprehensive charting library with a wider variety of chart types
- Better documentation and examples for complex visualizations
- Supports both SVG and HTML5 rendering for better performance and compatibility
Cons of AnyChart-Android
- Commercial product with licensing fees, unlike the open-source GraphView
- Steeper learning curve due to more complex API and features
- Larger file size and potential performance impact for simpler applications
Code Comparison
GraphView:
LineGraphSeries<DataPoint> series = new LineGraphSeries<>(new DataPoint[] {
    new DataPoint(0, 1),
    new DataPoint(1, 5),
    new DataPoint(2, 3)
});
graphView.addSeries(series);
AnyChart-Android:
Cartesian cartesian = AnyChart.line();
List<DataEntry> data = new ArrayList<>();
data.add(new ValueDataEntry("A", 1));
data.add(new ValueDataEntry("B", 5));
data.add(new ValueDataEntry("C", 3));
cartesian.data(data);
Both libraries offer straightforward ways to create basic charts, but AnyChart-Android provides more customization options and chart types at the cost of a slightly more verbose setup process.
📈📊⛰⛰⛰An elegant modern declarative data visualization chart framework for Android . Extremely powerful, supports line, spline, area, areaspline, column, bar, pie, scatter, angular gauges, arearange, areasplinerange, columnrange, bubble, box plot, error bars, funnel, waterfall and polar chart types.极其精美而又强大的 Android 数据可视化图表框架,支持柱状图、条形图、折线图、曲线图、折线填充图、曲线填充图、气泡图、扇形图、环形图、散点图、雷达图、混合图等各种类型的多达几十种的信息图图表,完全满足工作所需.
Pros of AAChartCore-Kotlin
- More extensive chart types and customization options
- Better support for animated and interactive charts
- Kotlin-specific implementation, leveraging language features
Cons of AAChartCore-Kotlin
- Steeper learning curve due to more complex API
- Larger library size, potentially impacting app size
- Less native Android look and feel compared to GraphView
Code Comparison
GraphView:
val graph = findViewById<GraphView>(R.id.graph)
val series = LineGraphSeries(arrayOf(
    DataPoint(0.0, 1.0),
    DataPoint(1.0, 5.0),
    DataPoint(2.0, 3.0)
))
graph.addSeries(series)
AAChartCore-Kotlin:
val aaChartModel = AAChartModel()
    .chartType(AAChartType.Line)
    .dataLabelsEnabled(true)
    .series(arrayOf(
        AASeriesElement()
            .name("Tokyo")
            .data(arrayOf(7.0, 6.9, 9.5, 14.5, 18.2, 21.5, 25.2, 26.5, 23.3, 18.3, 13.9, 9.6))
    ))
The code comparison shows that AAChartCore-Kotlin requires more setup but offers more detailed configuration options, while GraphView provides a simpler API for basic charts.
Android Library to rapidly develop attractive and insightful charts in android applications.
Pros of WilliamChart
- More visually appealing and customizable charts
- Smoother animations and transitions
- Supports both Kotlin and Java
Cons of WilliamChart
- Limited chart types compared to GraphView
- Less documentation and community support
- Steeper learning curve for complex customizations
Code Comparison
WilliamChart:
val chart = LineChartView(context).apply {
    gradientFillColors = intArrayOf(Color.WHITE, Color.BLUE)
    animation.duration = 1000L
    animate(entries)
}
GraphView:
GraphView graph = new GraphView(context);
LineGraphSeries<DataPoint> series = new LineGraphSeries<>(data);
graph.addSeries(series);
graph.getViewport().setScalable(true);
Both libraries offer easy-to-use chart creation, but WilliamChart provides more modern syntax and built-in styling options, while GraphView focuses on simplicity and extensive customization through method calls.
Charts library for Android compatible with API 8+, several chart types with scaling, scrolling and animations 📊
Pros of hellocharts-android
- More chart types available, including bubble charts and preview charts
- Smoother animations and transitions between data updates
- Better support for real-time data visualization
Cons of hellocharts-android
- Less customization options for individual chart elements
- Steeper learning curve due to more complex API
- Limited documentation compared to GraphView
Code Comparison
GraphView example:
LineGraphSeries<DataPoint> series = new LineGraphSeries<>(new DataPoint[] {
    new DataPoint(0, 1),
    new DataPoint(1, 5),
    new DataPoint(2, 3)
});
graph.addSeries(series);
hellocharts-android example:
List<PointValue> values = new ArrayList<>();
values.add(new PointValue(0, 1));
values.add(new PointValue(1, 5));
values.add(new PointValue(2, 3));
Line line = new Line(values).setColor(Color.BLUE).setCubic(true);
List<Line> lines = new ArrayList<>();
lines.add(line);
LineChartData data = new LineChartData();
data.setLines(lines);
Both libraries offer Android charting solutions, but hellocharts-android provides more chart types and smoother animations at the cost of a more complex API and less customization. GraphView is simpler to use and offers more fine-grained control over chart elements, making it suitable for basic charting needs. The choice between the two depends on the specific requirements of your project.
Convert  designs to code with AI

Introducing Visual Copilot: A new AI model to turn Figma designs to high quality code using your components.
Try Visual CopilotREADME
Chart and Graph Library for Android
Project maintainer wanted! For time reasons I can not continue to maintain GraphView. Contact me if you are interested and serious about this project. g.jjoe64@gmail.com
What is GraphView
GraphView is a library for Android to programmatically create flexible and nice-looking diagrams. It is easy to understand, to integrate and to customize.
Supported graph types:
- Line Graphs
- Bar Graphs
- Point Graphs
- or implement your own custom types.


Top Features
- Line Chart, Bar Chart, Points
- Combination of different graph types
- Scrolling vertical and horizontal . You can scroll with a finger touch move gesture.
- Scaling / Zooming vertical and horizontal . With two-fingers touch scale gesture (Multi-touch), the viewport can be changed.
- Realtime Graph (Live change of data)
- Second scale axis
- Draw multiple series of data . Let the diagram show more that one series in a graph. You can set a color and a description for every series.
- Show legend . A legend can be displayed inline the chart. You can set the width and the vertical align (top, middle, bottom).
- Custom labels . The labels for the x- and y-axis are generated automatically. But you can set your own labels, Strings are possible.
- Handle incomplete data . It's possible to give the data in different frequency.
- Viewport . You can limit the viewport so that only a part of the data will be displayed.
- Manual Y axis limits
- And much more... Check out the project page and/or the demo app
How to use
- Add gradle dependency:
implementation 'com.jjoe64:graphview:4.2.2'
- Add view to layout:
<com.jjoe64.graphview.GraphView
        android:layout_width="match_parent"
        android:layout_height="200dip"
        android:id="@+id/graph" />
- Add some data:
GraphView graph = (GraphView) findViewById(R.id.graph);
LineGraphSeries<DataPoint> series = new LineGraphSeries<DataPoint>(new DataPoint[] {
          new DataPoint(0, 1),
          new DataPoint(1, 5),
          new DataPoint(2, 3),
          new DataPoint(3, 2),
          new DataPoint(4, 6)
});
graph.addSeries(series);
Download Demo project at Google Play Store

More examples and documentation
Get started at project wiki homepage
To show you how to integrate the library into an existing project see the GraphView-Demos project!
See GraphView-Demos for examples.
https://github.com/jjoe64/GraphView-Demos
View GraphView wiki page https://github.com/jjoe64/GraphView/wiki
Top Related Projects
A powerful 🚀 Android chart view / graph view library, supporting line- bar- pie- radar- bubble- and candlestick charts as well as scaling, panning and animations.
AnyChart Android Chart is an amazing data visualization library for easily creating interactive charts in Android apps. It runs on API 19+ (Android 4.4) and features dozens of built-in chart types.
📈📊⛰⛰⛰An elegant modern declarative data visualization chart framework for Android . Extremely powerful, supports line, spline, area, areaspline, column, bar, pie, scatter, angular gauges, arearange, areasplinerange, columnrange, bubble, box plot, error bars, funnel, waterfall and polar chart types.极其精美而又强大的 Android 数据可视化图表框架,支持柱状图、条形图、折线图、曲线图、折线填充图、曲线填充图、气泡图、扇形图、环形图、散点图、雷达图、混合图等各种类型的多达几十种的信息图图表,完全满足工作所需.
Android Library to rapidly develop attractive and insightful charts in android applications.
Charts library for Android compatible with API 8+, several chart types with scaling, scrolling and animations 📊
Convert designs to code with AI
Introducing Visual Copilot: A new AI model to turn Figma designs to high quality code using your components.
Try Visual Copilot