 perspective
A data visualization and analytics component, especially well-suited for large and/or streaming datasets.
Top Related Projects

Apache Superset is a Data Visualization and Data Exploration Platform

Data Apps & Dashboards for Python. No JavaScript Required.

The easy-to-use open source Business Intelligence and Embedded Analytics tool that lets everyone work with data :bar_chart:

Streamlit — A faster way to build and share data apps.

Panel: The powerful data exploration & web app framework for Python

Visually explore, understand, and present your data.
Quick Overview
Perspective is an interactive analytics and data visualization component, designed to be embedded in web applications. It allows users to create and manipulate views of large datasets quickly and efficiently, using a combination of WebAssembly and WebGL for high-performance rendering.
Pros
- High-performance data handling and visualization capabilities
- Flexible and customizable, supporting various chart types and data transformations
- Cross-platform compatibility, working in browsers and Node.js environments
- Active development and maintenance by the FINOS community
Cons
- Steep learning curve for advanced features and customizations
- Limited documentation for some complex use cases
- Requires WebAssembly support, which may not be available in older browsers
- Large bundle size compared to simpler charting libraries
Code Examples
- Creating a simple table view:
const table = perspective.table(data);
const view = table.view();
const element = document.getElementById("my-perspective-viewer");
element.load(view);
- Applying a filter to the data:
const table = perspective.table(data);
const view = table.view({
    filter: [["Sales", ">", 1000]]
});
element.load(view);
- Creating a grouped bar chart:
const table = perspective.table(data);
const view = table.view({
    group_by: ["Category"],
    split_by: ["Region"],
    columns: ["Sales"]
});
element.setAttribute("view", "y_bar");
element.load(view);
Getting Started
To get started with Perspective, follow these steps:
- Install Perspective using npm:
npm install @finos/perspective
- Import Perspective in your JavaScript file:
import perspective from "@finos/perspective";
- Create a table and load data:
const table = perspective.table(data);
const view = table.view();
const element = document.getElementById("my-perspective-viewer");
element.load(view);
- Add the necessary HTML element to your page:
<perspective-viewer id="my-perspective-viewer"></perspective-viewer>
This basic setup will create a simple table view of your data. You can then customize the view and add interactivity as needed.
Competitor Comparisons
Apache Superset is a Data Visualization and Data Exploration Platform
Pros of Superset
- More comprehensive data exploration and visualization platform
- Supports a wider range of data sources and databases
- Offers a user-friendly interface for non-technical users
Cons of Superset
- Heavier and more resource-intensive
- Steeper learning curve for setup and configuration
- Less suitable for real-time data analysis
Code Comparison
Perspective:
const table = await perspective.table(data);
const view = await table.view();
const result = await view.to_json();
Superset:
from superset import db
from superset.models import Slice

slice = Slice(
    slice_name="My Chart",
    datasource_type="table",
    datasource_id=1,
    viz_type="bar"
)
db.session.add(slice)
db.session.commit()
The code snippets demonstrate the different approaches:
- Perspective focuses on creating and manipulating data tables directly in JavaScript
- Superset uses Python and involves working with database models and chart configurations
Data Apps & Dashboards for Python. No JavaScript Required.
Pros of Dash
- More comprehensive web application framework, allowing for full-stack development
- Extensive documentation and community support
- Wider range of chart types and visualization options out-of-the-box
Cons of Dash
- Steeper learning curve for beginners
- Potentially slower performance for large datasets compared to Perspective
- More complex setup and deployment process
Code Comparison
Perspective:
const table = perspective.table(data);
const viewer = document.getElementById('viewer');
table.view().to_json().then(json => {
    console.log(json);
});
Dash:
import dash
import dash_core_components as dcc
import dash_html_components as html

app = dash.Dash(__name__)
app.layout = html.Div([
    dcc.Graph(figure=fig)
])
Summary
Perspective focuses on high-performance data visualization and analysis, particularly for large datasets. It excels in real-time updates and streaming data scenarios. Dash, on the other hand, provides a more comprehensive framework for building full-stack web applications with a wide range of visualization options. While Perspective offers better performance for specific use cases, Dash provides greater flexibility and a broader set of features for general-purpose data visualization and application development.
The easy-to-use open source Business Intelligence and Embedded Analytics tool that lets everyone work with data :bar_chart:
Pros of Metabase
- More comprehensive business intelligence and analytics platform
- User-friendly interface with drag-and-drop query builder
- Supports a wide range of data sources and databases
Cons of Metabase
- Heavier resource requirements for deployment and maintenance
- Less suitable for real-time data analysis and streaming data
- Limited customization options for advanced users
Code Comparison
Perspective:
const table = perspective.table(data);
const view = table.view({
    columns: ['Sales', 'Profit'],
    aggregates: {'Sales': 'sum', 'Profit': 'avg'}
});
Metabase:
SELECT SUM("Sales") AS "Total Sales",
       AVG("Profit") AS "Average Profit"
FROM sales_data
GROUP BY date_trunc('month', "Date")
Perspective focuses on real-time data manipulation and visualization using JavaScript, while Metabase uses SQL queries for data analysis and reporting. Perspective is more suitable for interactive, client-side data exploration, whereas Metabase excels in creating comprehensive dashboards and reports for business intelligence purposes.
Both projects have their strengths, with Perspective offering high-performance data analysis for large datasets and Metabase providing a more accessible platform for non-technical users to create and share insights across an organization.
Streamlit — A faster way to build and share data apps.
Pros of Streamlit
- Easier to learn and use for beginners, with a more intuitive API
- Better suited for quickly creating data apps and dashboards
- More extensive documentation and community support
Cons of Streamlit
- Less performant for large-scale data processing compared to Perspective
- More limited in terms of customization and fine-grained control over UI elements
Code Comparison
Streamlit example:
import streamlit as st
import pandas as pd

df = pd.read_csv("data.csv")
st.dataframe(df)
st.line_chart(df)
Perspective example:
const perspective = require("@finos/perspective");
const data = await perspective.worker().table(csvString);
const viewer = document.getElementById("viewer");
const widget = perspective.viewer({columns: ["x", "y"]});
widget.load(data);
viewer.appendChild(widget);
While both libraries allow for data visualization, Streamlit's approach is more straightforward and Python-centric, making it easier for data scientists to quickly create interactive apps. Perspective, on the other hand, offers more powerful data processing capabilities and is better suited for complex, large-scale data applications, particularly in financial contexts.
Panel: The powerful data exploration & web app framework for Python
Pros of Panel
- More flexible and customizable for creating complex dashboards and applications
- Supports a wider range of data visualization libraries (Bokeh, Plotly, Matplotlib, etc.)
- Better integration with other HoloViz tools for data analysis and visualization
Cons of Panel
- Steeper learning curve for beginners compared to Perspective
- May require more code to achieve similar results for simple data exploration tasks
- Less optimized for handling large datasets in real-time
Code Comparison
Panel:
import panel as pn
import pandas as pd

df = pd.read_csv('data.csv')
table = pn.widgets.Tabulator(df)
pn.Column(table).servable()
Perspective:
const table = perspective.worker().table(data);
const viewer = document.getElementById('viewer');
perspective.viewer().load(table);
Visually explore, understand, and present your data.
Pros of SandDance
- More visually appealing and interactive data visualizations
- Easier to create complex, multi-dimensional visualizations
- Better integration with Microsoft Power BI and other Microsoft tools
Cons of SandDance
- Less performant with large datasets compared to Perspective
- More limited in terms of real-time data streaming capabilities
- Fewer options for customization and low-level control
Code Comparison
SandDance:
import * as vega from 'vega';
import { SandDance } from '@msrvida/sanddance-explorer';

const spec = {
  // Vega-lite specification
};

SandDance.renderChart(element, spec, data);
Perspective:
const worker = perspective.worker();
const table = worker.table(data);

const viewer = document.getElementById('viewer');
const widget = perspective.viewer(viewer);
widget.load(table);
Both libraries offer ways to create data visualizations, but SandDance focuses on more complex, interactive visualizations using Vega-Lite specifications, while Perspective provides a more streamlined approach for real-time data analysis and visualization. SandDance's code tends to be more declarative, specifying the desired visualization, while Perspective's code is more imperative, directly manipulating the data and viewer.
Convert  designs to code with AI

Introducing Visual Copilot: A new AI model to turn Figma designs to high quality code using your components.
Try Visual CopilotREADME
![]()
![]()
Perspective is an interactive analytics and data visualization component, which is especially well-suited for large and/or streaming datasets. Use it to create user-configurable reports, dashboards, notebooks and applications.
Features
-
A fast, memory efficient streaming query engine, written in C++ and compiled for WebAssembly, Python and Rust, with read/write/streaming for Apache Arrow, and a high-performance columnar expression language based on ExprTK.
-
A framework-agnostic User Interface packaged as a Custom Element, powered either in-browser via WebAssembly or virtually via WebSocket server (Python/Node/Rust).
-
A JupyterLab widget and Python client library, for interactive data analysis in a notebook, as well as scalable production applications.
Documentation
- Project Site
- User Guide
- Python API
- JavaScript API
- Rust API
Examples
| editable | file | fractal |
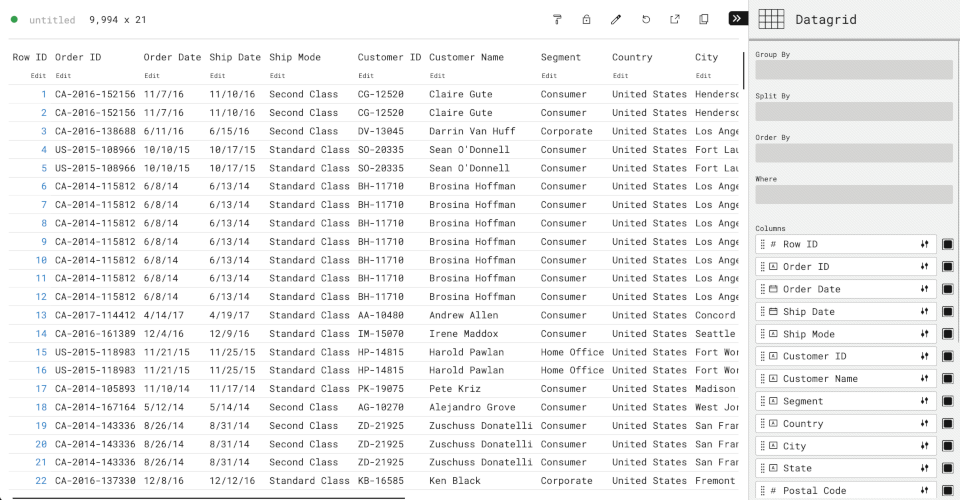 | 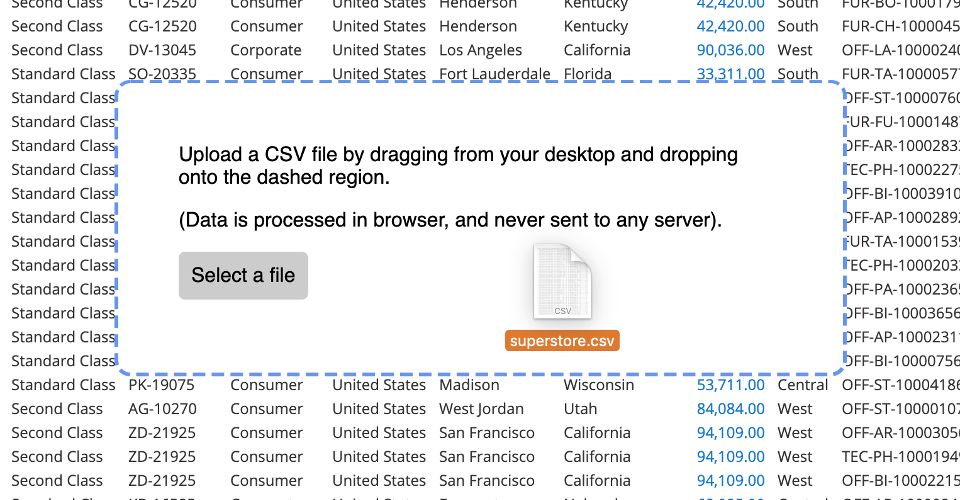 | 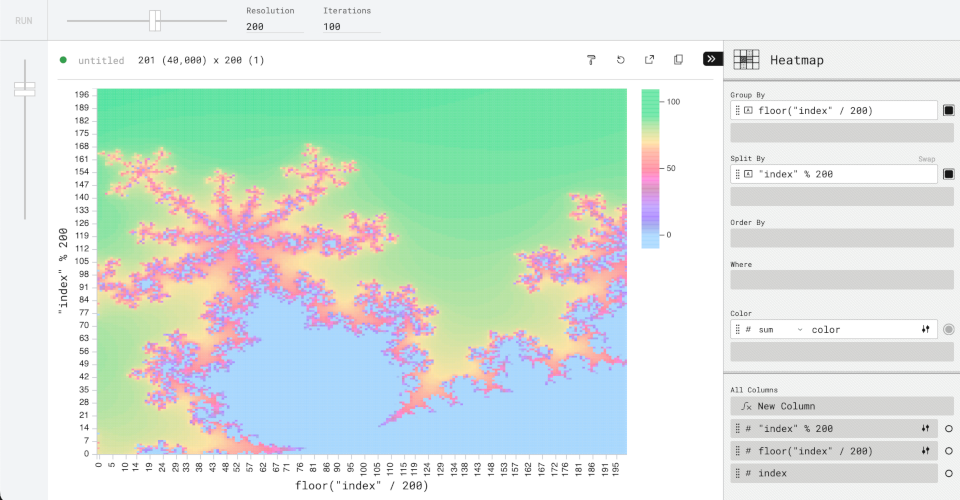 |
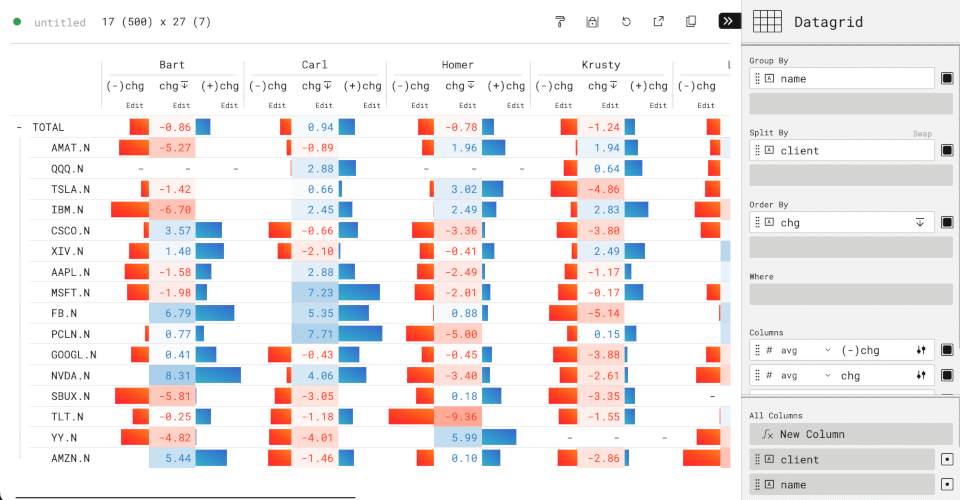
| market | raycasting | evictions |
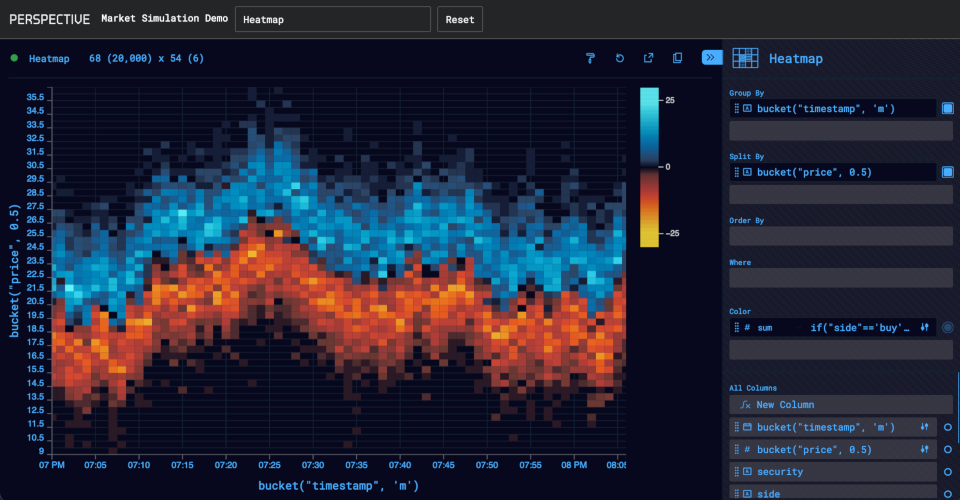 | 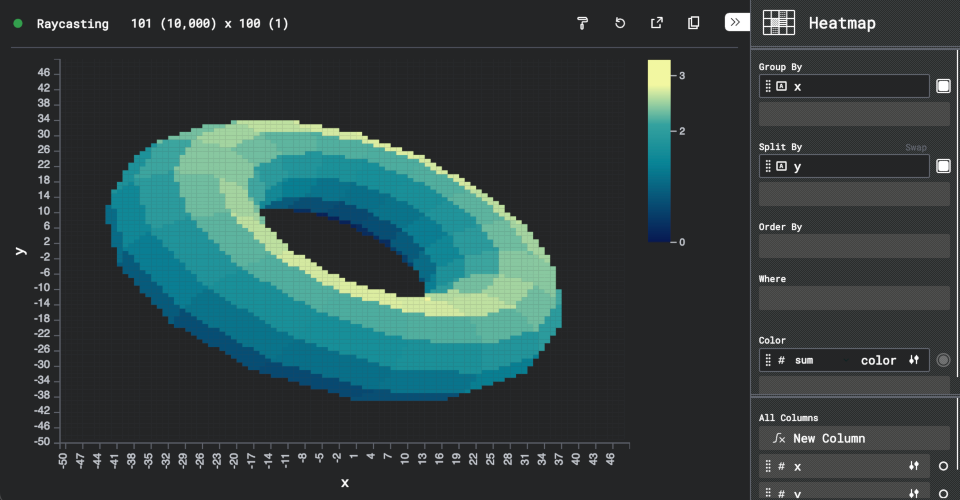 |  |
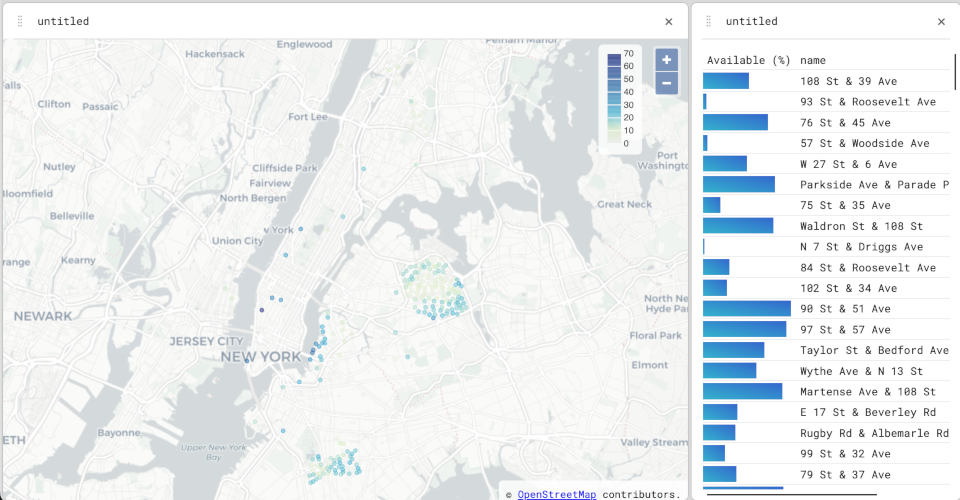
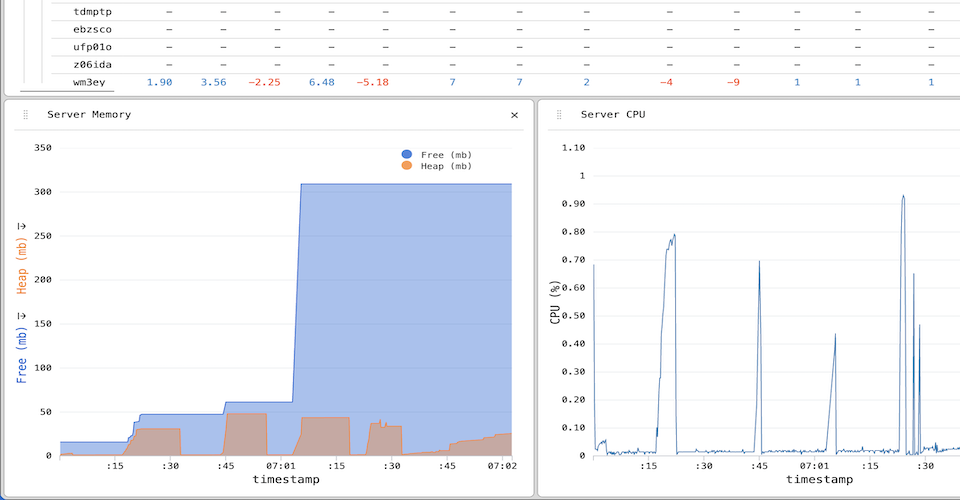
| nypd | streaming | covid |
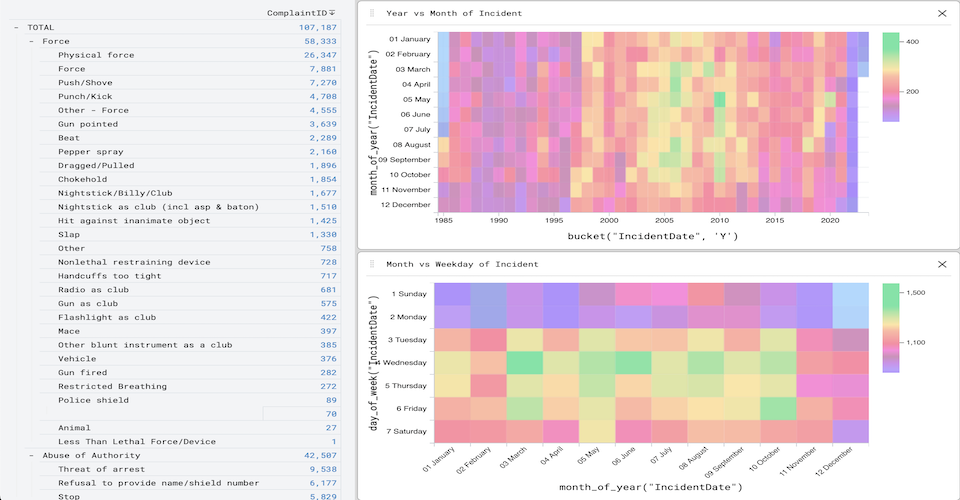 |  | 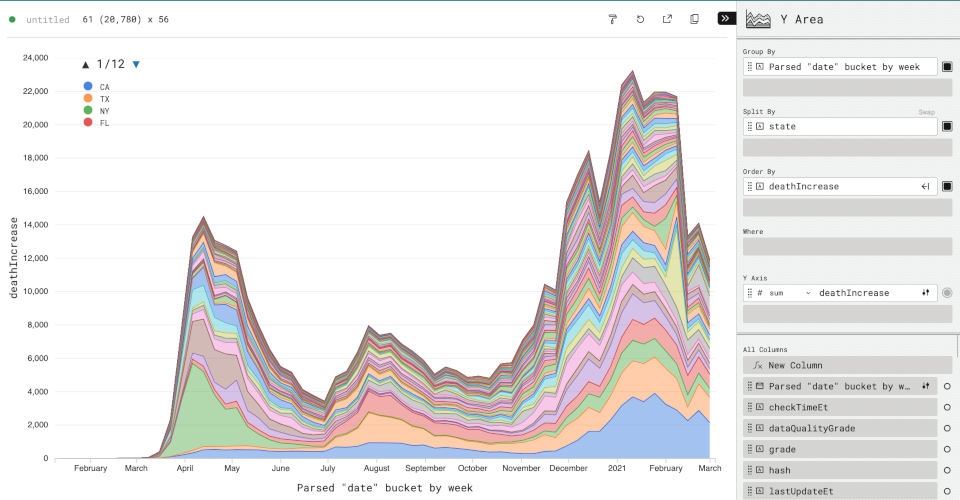 |
| webcam | movies | superstore |
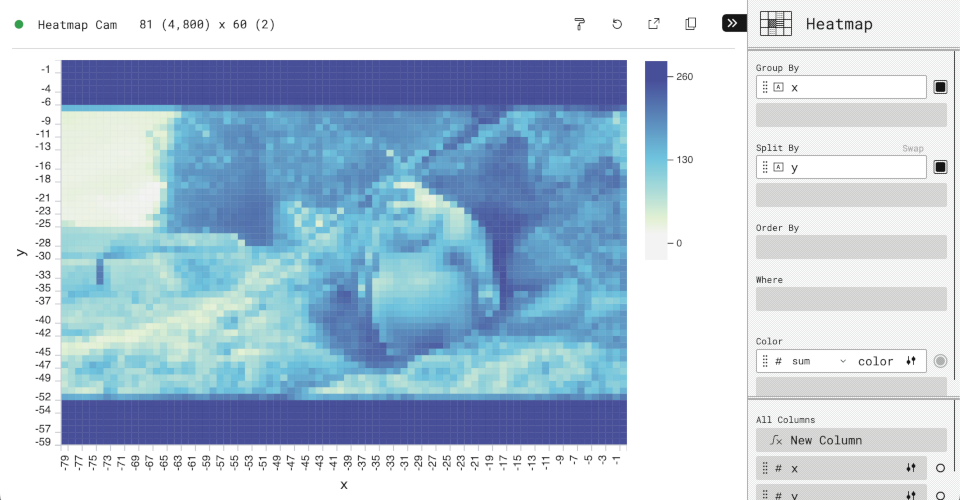 | 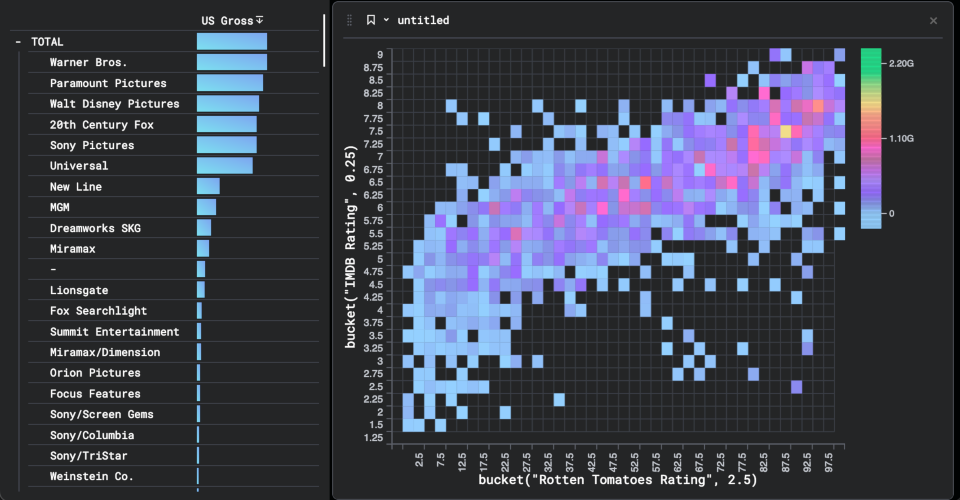 | 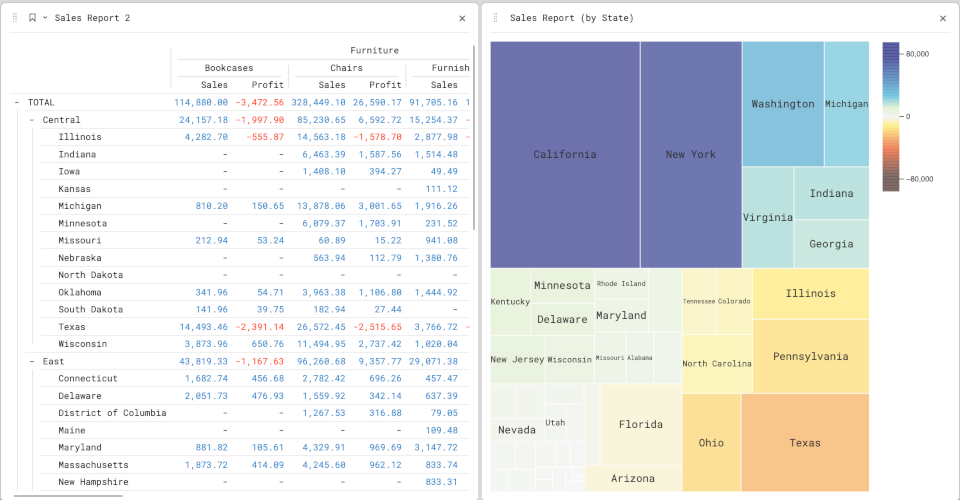 |
| citibike | olympics | dataset |
 | 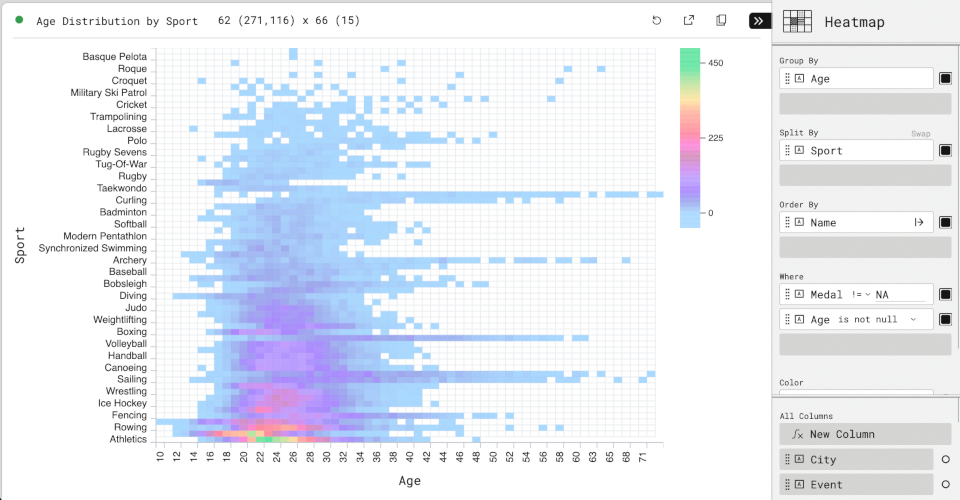 |  |
Media
@timkpaine |
@timbess |
@sc1f |
 |
 |
 |
@texodus |
@texodus |
|
 |
 |
Top Related Projects
Apache Superset is a Data Visualization and Data Exploration Platform
Data Apps & Dashboards for Python. No JavaScript Required.
The easy-to-use open source Business Intelligence and Embedded Analytics tool that lets everyone work with data :bar_chart:
Streamlit — A faster way to build and share data apps.
Panel: The powerful data exploration & web app framework for Python
Visually explore, understand, and present your data.
Convert designs to code with AI
Introducing Visual Copilot: A new AI model to turn Figma designs to high quality code using your components.
Try Visual Copilot