 dowhy
dowhy
DoWhy is a Python library for causal inference that supports explicit modeling and testing of causal assumptions. DoWhy is based on a unified language for causal inference, combining causal graphical models and potential outcomes frameworks.
Top Related Projects
ALICE (Automated Learning and Intelligence for Causation and Economics) is a Microsoft Research project aimed at applying Artificial Intelligence concepts to economic decision making. One of its goals is to build a toolkit that combines state-of-the-art machine learning techniques with econometrics in order to bring automation to complex causal inference problems. To date, the ALICE Python SDK (econml) implements orthogonal machine learning algorithms such as the double machine learning work of Chernozhukov et al. This toolkit is designed to measure the causal effect of some treatment variable(s) t on an outcome variable y, controlling for a set of features x.

Uplift modeling and causal inference with machine learning algorithms

Adaptive Experimentation Platform

Luigi is a Python module that helps you build complex pipelines of batch jobs. It handles dependency resolution, workflow management, visualization etc. It also comes with Hadoop support built in.

A Python library that helps data scientists to infer causation rather than observing correlation.
DoWhy is a Python library for causal inference that supports explicit modeling and testing of causal assumptions. DoWhy is based on a unified language for causal inference, combining causal graphical models and potential outcomes frameworks.
Quick Overview
DoWhy is a Python library for causal inference that provides a unified interface for causal modeling, identification, estimation, and refutation. It aims to make causal inference accessible to data scientists and researchers by implementing a principled approach based on Judea Pearl's do-calculus and potential outcomes framework.
Pros
- Provides a comprehensive framework for causal inference, covering all stages from modeling to refutation
- Implements multiple estimation methods, including backdoor adjustment, instrumental variables, and propensity score matching
- Offers a user-friendly API that abstracts away complex causal inference concepts
- Includes built-in visualization tools for causal graphs and effect estimates
Cons
- Requires a solid understanding of causal inference concepts for effective use
- May have a steeper learning curve compared to traditional statistical libraries
- Limited support for certain advanced causal inference techniques
- Documentation could be more extensive for some advanced features
Code Examples
- Creating a causal model and estimating the average treatment effect:
from dowhy import CausalModel
import pandas as pd

data = pd.read_csv("example_data.csv")
model = CausalModel(
    data=data,
    treatment='treatment',
    outcome='outcome',
    common_causes=['age', 'sex', 'bmi']
)
identified_estimand = model.identify_effect()
estimate = model.estimate_effect(identified_estimand, method_name="backdoor.linear_regression")
print(estimate)
- Refuting the estimated causal effect:
refutation_results = model.refute_estimate(identified_estimand, estimate,
                                           method_name="random_common_cause")
print(refutation_results)
- Visualizing the causal graph:
from dowhy import CausalModel
import networkx as nx
import matplotlib.pyplot as plt

model = CausalModel(
    data=data,
    treatment='treatment',
    outcome='outcome',
    graph=nx.DiGraph([('treatment', 'outcome'), ('confounding_var', 'treatment'), ('confounding_var', 'outcome')])
)
nx.draw(model._graph, with_labels=True)
plt.show()
Getting Started
To get started with DoWhy, first install the library:
pip install dowhy
Then, import the necessary modules and create a simple causal model:
from dowhy import CausalModel
import pandas as pd

# Load your data
data = pd.read_csv("your_data.csv")

# Create a causal model
model = CausalModel(
    data=data,
    treatment='treatment_variable',
    outcome='outcome_variable',
    common_causes=['confounder1', 'confounder2']
)

# Identify and estimate the causal effect
identified_estimand = model.identify_effect()
estimate = model.estimate_effect(identified_estimand, method_name="backdoor.propensity_score_matching")
print(estimate)
This basic example demonstrates how to create a causal model, identify the causal effect, and estimate it using propensity score matching.
Competitor Comparisons
ALICE (Automated Learning and Intelligence for Causation and Economics) is a Microsoft Research project aimed at applying Artificial Intelligence concepts to economic decision making. One of its goals is to build a toolkit that combines state-of-the-art machine learning techniques with econometrics in order to bring automation to complex causal inference problems. To date, the ALICE Python SDK (econml) implements orthogonal machine learning algorithms such as the double machine learning work of Chernozhukov et al. This toolkit is designed to measure the causal effect of some treatment variable(s) t on an outcome variable y, controlling for a set of features x.
Pros of EconML
- Focuses on econometric and machine learning methods for causal inference
- Provides advanced techniques like Double Machine Learning and Orthogonal Random Forests
- Offers more specialized tools for heterogeneous treatment effects
Cons of EconML
- Steeper learning curve due to more complex methods
- Less emphasis on causal graphs and structural causal models
- Narrower scope, primarily tailored for econometric applications
Code Comparison
DoWhy example:
from dowhy import CausalModel
model = CausalModel(data, treatment, outcome, graph)
identified_estimand = model.identify_effect()
estimate = model.estimate_effect(identified_estimand)
EconML example:
from econml.dml import LinearDML
model = LinearDML()
model.fit(Y, T, X, W)
treatment_effects = model.effect(X_test)
Both libraries aim to facilitate causal inference, but DoWhy provides a more general framework for causal analysis, while EconML focuses on econometric methods and machine learning techniques. DoWhy emphasizes causal graphs and offers a broader range of estimation methods, making it more accessible for users new to causal inference. EconML, on the other hand, provides more advanced econometric tools and is better suited for users with a strong background in econometrics and machine learning.
Uplift modeling and causal inference with machine learning algorithms
Pros of causalml
- More comprehensive suite of causal inference methods, including meta-learners and uplift modeling
- Better integration with machine learning workflows and popular ML libraries
- More active development and frequent updates
Cons of causalml
- Steeper learning curve due to its broader scope and more complex API
- Less focus on interpretability and visualization compared to DoWhy
- Requires more domain knowledge to choose appropriate methods
Code comparison
DoWhy:
from dowhy import CausalModel
model = CausalModel(data, treatment, outcome, graph)
estimate = model.estimate_effect(method="backdoor")
causalml:
from causalml.inference.meta import XLearner
xl = XLearner(random_state=42)
te, lb, ub = xl.estimate_ate(X, treatment, y)
DoWhy focuses on a more intuitive, step-by-step approach to causal inference, while causalml provides a wider range of advanced methods with a machine learning-oriented interface. DoWhy excels in interpretability and educational value, whereas causalml offers more powerful tools for practitioners dealing with complex causal inference scenarios in production environments.
Adaptive Experimentation Platform
Pros of Ax
- Focuses on Bayesian optimization and adaptive experimentation
- Integrates with PyTorch for machine learning experiments
- Provides a user-friendly interface for managing complex experiments
Cons of Ax
- Less focused on causal inference compared to DoWhy
- May have a steeper learning curve for users not familiar with Bayesian optimization
- Limited to experimental settings, while DoWhy can handle observational data
Code Comparison
DoWhy example:
from dowhy import CausalModel
model = CausalModel(data, treatment, outcome, graph)
identified_estimand = model.identify_effect()
estimate = model.estimate_effect(identified_estimand)
Ax example:
from ax import AxClient
ax_client = AxClient()
ax_client.create_experiment(parameters, objective_name)
for _ in range(num_iterations):
    parameters, trial_index = ax_client.get_next_trial()
Summary
DoWhy is primarily focused on causal inference and provides tools for estimating causal effects from both experimental and observational data. It offers a comprehensive framework for causal analysis, including identification, estimation, and refutation of causal effects.
Ax, on the other hand, is designed for adaptive experimentation and Bayesian optimization. It excels in managing complex experiments, particularly in machine learning contexts, and provides powerful tools for optimizing experimental designs and hyperparameters.
While both libraries can be used for experimentation, they serve different primary purposes and are best suited for different types of problems in the data science and machine learning domains.
Luigi is a Python module that helps you build complex pipelines of batch jobs. It handles dependency resolution, workflow management, visualization etc. It also comes with Hadoop support built in.
Pros of Luigi
- Robust workflow management system for complex data pipelines
- Extensive ecosystem with many built-in task types and integrations
- Visualization tools for monitoring and debugging workflows
Cons of Luigi
- Steeper learning curve due to its comprehensive feature set
- Less focused on causal inference and effect estimation
- May be overkill for simpler data processing tasks
Code Comparison
Luigi (workflow definition):
class MyTask(luigi.Task):
    def requires(self):
        return SomeOtherTask()

    def run(self):
        # Process data
        with self.output().open('w') as f:
            f.write(result)

    def output(self):
        return luigi.LocalTarget('output.txt')
DoWhy (causal inference):
model = CausalModel(
    data=data,
    treatment='treatment',
    outcome='outcome',
    common_causes=['X1', 'X2']
)
identified_estimand = model.identify_effect()
estimate = model.estimate_effect(identified_estimand)
Summary
Luigi excels in managing complex data workflows and pipelines, offering a wide range of features and integrations. It's particularly useful for large-scale data processing tasks. DoWhy, on the other hand, focuses specifically on causal inference and effect estimation, providing a more specialized toolkit for these types of analyses. While Luigi offers more general-purpose functionality, DoWhy is tailored for researchers and data scientists working on causal problems.
A Python library that helps data scientists to infer causation rather than observing correlation.
Pros of CausalNex
- Focuses on Bayesian Networks for causal inference
- Provides visualization tools for causal graphs
- Integrates well with other McKinsey analytics tools
Cons of CausalNex
- Less comprehensive in terms of causal inference methods
- Smaller community and fewer contributors
- More limited documentation compared to DoWhy
Code Comparison
CausalNex example:
from causalnex.structure import StructureModel
from causalnex.structure.notears import from_pandas

sm = StructureModel()
sm = from_pandas(df)
DoWhy example:
from dowhy import CausalModel
import pandas as pd

model = CausalModel(
    data=df,
    treatment='treatment',
    outcome='outcome',
    graph=gml_graph
)
Both libraries offer ways to create causal models, but DoWhy provides a more explicit framework for defining treatment and outcome variables. CausalNex focuses on structure learning from data, while DoWhy allows for more flexible model specification.
DoWhy is a Python library for causal inference that supports explicit modeling and testing of causal assumptions. DoWhy is based on a unified language for causal inference, combining causal graphical models and potential outcomes frameworks.
Pros of DoWhy
- More established project with longer development history
- Larger community and more contributors
- Comprehensive documentation and examples
Cons of DoWhy
- Potentially more complex API due to broader feature set
- May have more dependencies and overhead for simpler use cases
Code Comparison
DoWhy:
from dowhy import CausalModel
import pandas as pd

data = pd.read_csv("data.csv")
model = CausalModel(
    data=data,
    treatment='treatment',
    outcome='outcome',
    graph='treatment->outcome;confounding->treatment;confounding->outcome'
)
identified_estimand = model.identify_effect(proceed_when_unidentifiable=True)
estimate = model.estimate_effect(identified_estimand, method_name="backdoor.linear_regression")
Note: There is no code comparison available as the repository py-why/dowhy> does not exist or is not accessible. The comparison is based solely on the DoWhy repository.
Convert  designs to code with AI

Introducing Visual Copilot: A new AI model to turn Figma designs to high quality code using your components.
Try Visual CopilotREADME
|BuildStatus|_ |PyPiVersion|_ |PythonSupport|_ |Downloads|_ |discord|_ |gurubase|_
.. |PyPiVersion| image:: https://img.shields.io/pypi/v/dowhy.svg .. _PyPiVersion: https://pypi.org/project/dowhy/
.. |PythonSupport| image:: https://img.shields.io/pypi/pyversions/dowhy.svg .. _PythonSupport: https://pypi.org/project/dowhy/
.. |BuildStatus| image:: https://github.com/py-why/dowhy/actions/workflows/ci.yml/badge.svg .. _BuildStatus: https://github.com/py-why/dowhy/actions
.. |Downloads| image:: https://pepy.tech/badge/dowhy .. _Downloads: https://pepy.tech/project/dowhy
.. |discord| image:: https://img.shields.io/discord/818456847551168542 .. _discord: https://discord.gg/cSBGb3vsZb
.. |gurubase| image:: https://img.shields.io/badge/Gurubase-Ask%20DoWhy%20Guru-006BFF .. _gurubase: https://gurubase.io/g/dowhy
.. image:: dowhy-logo-large.png :width: 50% :align: center
Checkout the documentation <https://py-why.github.io/dowhy/>_
- The documentation, user guide, sample notebooks and other information are available at
https://py-why.github.io/dowhy <https://py-why.github.io/dowhy/>_ - DoWhy is part of the
PyWhy Ecosystem <https://www.pywhy.org/>. For more tools and libraries related to causality, checkout thePyWhy GitHub organization <https://github.com/py-why/>! - For any questions, comments, or discussions about specific use cases, join our community on
Discord <https://discord.gg/cSBGb3vsZb>_ (|discord|_) - Jump right into some case studies:
- Effect estimation:
Hotel booking cancellations <https://medium.com/data-science/beyond-predictive-models-the-causal-story-behind-hotel-booking-cancellations-d29e8558cbaf>_ |Effect of customer loyalty programs <https://www.pywhy.org/dowhy/main/example_notebooks/dowhy_example_effect_of_memberrewards_program.html>_ |Optimizing article headlines <https://medium.com/@akelleh/introducing-the-do-sampler-for-causal-inference-a3296ea9e78d>_ |Effect of home visits on infant health (IHDP) <https://medium.com/data-science/implementing-causal-inference-a-key-step-towards-agi-de2cde8ea599>_ |Causes of customer churn/attrition <https://medium.com/geekculture/a-quickstart-for-causal-analysis-decision-making-with-dowhy-2ce2d4d1efa9>_ - Root cause analysis and explanations:
Causal attribution and root-cause analysis of an online shop <https://www.pywhy.org/dowhy/main/example_notebooks/gcm_online_shop.html>_ |Finding the Root Cause of Elevated Latencies in a Microservice Architecture <https://www.pywhy.org/dowhy/main/example_notebooks/gcm_rca_microservice_architecture.html>_ |Finding Root Causes of Changes in a Supply Chain <https://www.pywhy.org/dowhy/main/example_notebooks/gcm_supply_chain_dist_change.html>_
- Effect estimation:
For more example notebooks, see here! <https://www.pywhy.org/dowhy/main/example_notebooks/nb_index.html>_
Introduction & Key Features
Decision-making involves understanding how different variables affect each other and predicting the outcome when some of them are changed to new values. For instance, given an outcome variable, one may be interested in determining how a potential action(s) may affect it, understanding what led to its current value, or simulate what would happen if some variables are changed. Answering such questions requires causal reasoning. DoWhy is a Python library that guides you through the various steps of causal reasoning and provides a unified interface for answering causal questions.
DoWhy provides a wide variety of algorithms for effect estimation, prediction, quantification of causal influences, diagnosis of causal structures, root cause analysis, interventions and counterfactuals. A key feature of DoWhy is its refutation and falsification API that can test causal assumptions for any estimation method, thus making inference more robust and accessible to non-experts.
Graphical Causal Models and Potential Outcomes: Best of both worlds
DoWhy builds on two of the most powerful frameworks for causal inference: graphical causal models and potential outcomes. For effect estimation, it uses graph-based criteria and do-calculus for modeling assumptions and identifying a non-parametric causal effect. For estimation, it switches to methods based primarily on potential outcomes.
For causal questions beyond effect estimation, it uses the power of graphical causal models by modeling the data generation process via explicit causal mechanisms at each node, which, for instance, unlocks capabilities to attribute observed effects to particular variables or estimate point-wise counterfactuals.
For a quick introduction to causal inference, check out amit-sharma/causal-inference-tutorial <https://github.com/amit-sharma/causal-inference-tutorial/>_
We also gave a more comprehensive tutorial at the ACM Knowledge Discovery and Data Mining (KDD 2018 <http://www.kdd.org/kdd2018/>) conference: causalinference.gitlab.io/kdd-tutorial <http://causalinference.gitlab.io/kdd-tutorial/>.
For an introduction to the four steps of causal inference and its implications for machine learning, you can access this video tutorial from Microsoft Research DoWhy Webinar <https://www.microsoft.com/en-us/research/video/foundations-of-causal-inference-and-its-impacts-on-machine-learning/>_ and for an introduction to the graphical causal model API, see the PyCon presentation on Root Cause Analysis with DoWhy <https://www.youtube.com/watch?v=icpHrbDlGaw>_.
Key Features
.. image:: https://raw.githubusercontent.com/py-why/dowhy/main/docs/images/dowhy-features.png

DoWhy supports the following causal tasks:

- Effect estimation (identification, average causal effect, conditional average causal effect, instrumental variables and more)
- Quantify causal influences (mediation analysis, direct arrow strength, intrinsic causal influence)
- What-if analysis (generate samples from interventional distribution, estimate counterfactuals)
- Root cause analysis and explanations (attribute anomalies to their causes, find causes for changes in distributions, estimate feature relevance and more)

For more details and how to use these methods in practice, checkout the documentation at `https://py-why.github.io/dowhy <https://py-why.github.io/dowhy/>`_

Quick Start
===========
DoWhy support Python 3.8+. To install, you can use pip, poetry, or conda.

**Latest Release**

Install the latest `release <https://pypi.org/project/dowhy/>`__ using pip.

.. code:: shell

   pip install dowhy

Install the latest `release <https://pypi.org/project/dowhy/>`__ using poetry.

.. code:: shell

   poetry add dowhy

Install the latest `release <https://anaconda.org/conda-forge/dowhy>`__ using conda.

.. code:: shell

   conda install -c conda-forge dowhy

If you face "Solving environment" problems with conda, then try :code:`conda update --all` and then install dowhy. If that does not work, then use :code:`conda config --set channel_priority false` and try to install again. If the problem persists, please `add your issue here <https://github.com/microsoft/dowhy/issues/197>`_.

**Development Version**

If you prefer to use the latest dev version, your dependency management tool will need to point at our GitHub repository.

.. code:: shell

    pip install git+https://github.com/py-why/dowhy@main


**Requirements**

DoWhy requires a few dependencies.
Details on specific versions can be found in `pyproject.toml <./pyproject.toml>`_, under the `tool.poetry.dependencies` section.

If you face any problems, try installing dependencies manually.

.. code:: shell

    pip install '<dependency-name>==<version>'

Optionally, if you wish to input graphs in the dot format, then install pydot (or pygraphviz).

For better-looking graphs, you can optionally install pygraphviz. To proceed,
first install graphviz and then pygraphviz (on Ubuntu and Ubuntu WSL).

.. note::
    Installing pygraphviz can cause problems on some platforms.
    One way that works for most Linux distributions is to
    first install graphviz and then pygraphviz as shown below.
    Otherwise, please consult the documentation of `pygraphviz <https://pygraphviz.github.io/documentation/stable/install.html>`_.

.. code:: shell

    sudo apt install graphviz libgraphviz-dev graphviz-dev pkg-config
    pip install --global-option=build_ext \
    --global-option="-I/usr/local/include/graphviz/" \
    --global-option="-L/usr/local/lib/graphviz" pygraphviz

Example: Effect identification and estimation
Most causal tasks in DoWhy only require a few lines of code to write. Here, we exemplarily estimate the causal effect of a treatment on an outcome variable:
.. code:: python
from dowhy import CausalModel
import dowhy.datasets

# Load some sample data
data = dowhy.datasets.linear_dataset(
    beta=10,
    num_common_causes=5,
    num_instruments=2,
    num_samples=10000,
    treatment_is_binary=True)
A causal graph can be defined in different way, but the most common way is via NetworkX <https://networkx.org/>_.
After loading in the data, we use the four main operations for effect estimation in DoWhy: model, identify,
estimate and refute:
.. code:: python
# I. Create a causal model from the data and given graph.
model = CausalModel(
    data=data["df"],
    treatment=data["treatment_name"],
    outcome=data["outcome_name"],
    graph=data["gml_graph"])  # Or alternatively, as nx.DiGraph

# II. Identify causal effect and return target estimands
identified_estimand = model.identify_effect()

# III. Estimate the target estimand using a statistical method.
estimate = model.estimate_effect(identified_estimand,
                                 method_name="backdoor.propensity_score_matching")

# IV. Refute the obtained estimate using multiple robustness checks.
refute_results = model.refute_estimate(identified_estimand, estimate,
                                       method_name="random_common_cause")
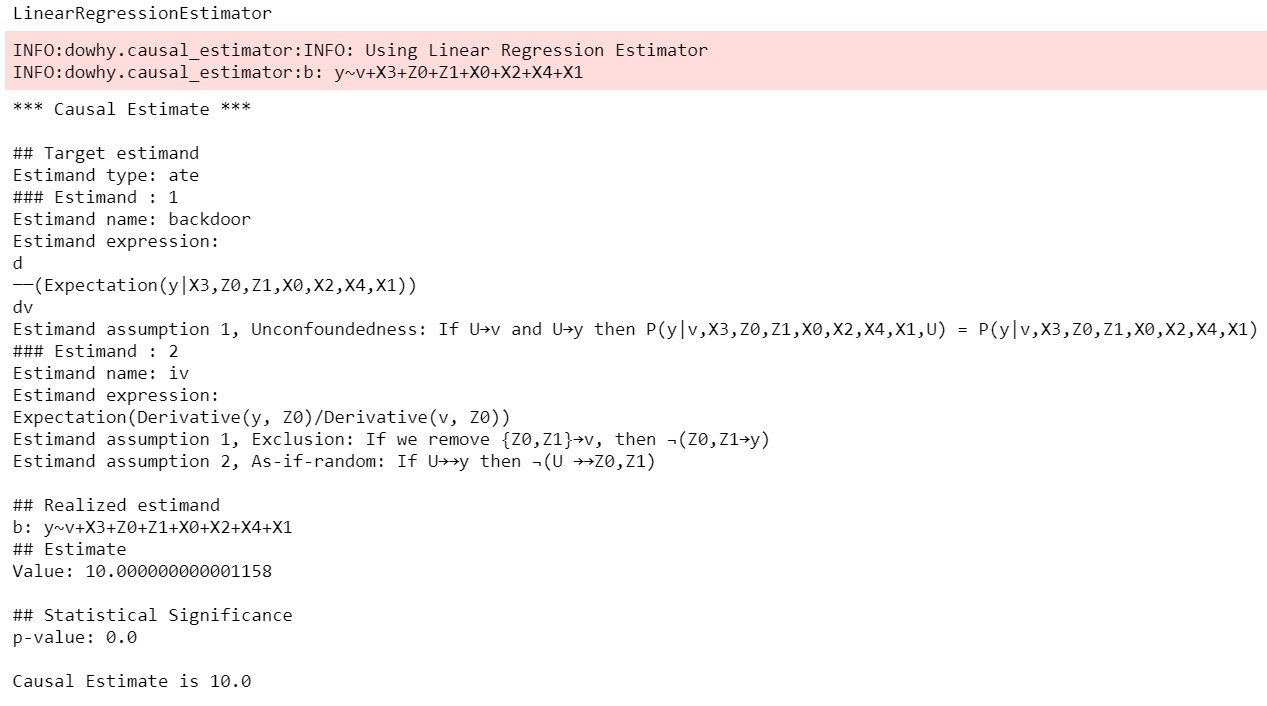
DoWhy stresses on the interpretability of its output. At any point in the analysis, you can inspect the untested assumptions, identified estimands (if any), and the estimate (if any). Here's a sample output of the linear regression estimator:
.. image:: https://raw.githubusercontent.com/py-why/dowhy/main/docs/images/regression_output.png :width: 80%
For a full code example, check out the Getting Started with DoWhy <https://www.pywhy.org/dowhy/main/example_notebooks/dowhy_simple_example.html>_ notebook.
You can also use Conditional Average Treatment Effect (CATE) estimation methods from EconML <https://github.com/py-why/econml>, as shown in the Conditional Treatment Effects <https://www.pywhy.org/dowhy/main/example_notebooks/dowhy-conditional-treatment-effects.html> notebook. Here's a code snippet.
.. code:: python
from sklearn.preprocessing import PolynomialFeatures
from sklearn.linear_model import LassoCV
from sklearn.ensemble import GradientBoostingRegressor
dml_estimate = model.estimate_effect(identified_estimand, method_name="backdoor.econml.dml.DML",
                    control_value = 0,
                    treatment_value = 1,
                    target_units = lambda df: df["X0"]>1,
                    confidence_intervals=False,
                    method_params={
                        "init_params":{'model_y':GradientBoostingRegressor(),
                                       'model_t': GradientBoostingRegressor(),
                                       'model_final':LassoCV(),
                                       'featurizer':PolynomialFeatures(degree=1, include_bias=True)},
                        "fit_params":{}})
Example: Graphical causal model (GCM) based inference
DoWhy's graphical causal model framework offers powerful tools to address causal questions beyond effect estimation.
It is based on Pearl's graphical causal model framework and models the causal data generation process of each variable
explicitly via *causal mechanisms* to support a wide range of causal algorithms. For more details, see the book
`Elements of Causal Inference <https://mitpress.mit.edu/9780262037310/elements-of-causal-inference/>`_.
Complex causal queries, such as attributing observed anomalies to nodes in the system, can be performed with just a few
lines of code:
.. code:: python
import networkx as nx, numpy as np, pandas as pd
from dowhy import gcm
# Let's generate some "normal" data we assume we're given from our problem domain:
X = np.random.normal(loc=0, scale=1, size=1000)
Y = 2 * X + np.random.normal(loc=0, scale=1, size=1000)
Z = 3 * Y + np.random.normal(loc=0, scale=1, size=1000)
data = pd.DataFrame(dict(X=X, Y=Y, Z=Z))
# 1. Modeling cause-effect relationships as a structural causal model
# (causal graph + functional causal models):
causal_model = gcm.StructuralCausalModel(nx.DiGraph([('X', 'Y'), ('Y', 'Z')])) # X -> Y -> Z
gcm.auto.assign_causal_mechanisms(causal_model, data)
# 2. Fitting the SCM to the data:
gcm.fit(causal_model, data)
# Optional: Evaluate causal model
print(gcm.evaluate_causal_model(causal_model, data))
# Step 3: Perform a causal analysis.
# results = gcm.<causal_query>(causal_model, ...)
# For instance, root cause analysis:
anomalous_sample = pd.DataFrame(dict(X=[0.1], Y=[6.2], Z=[19])) # Here, Y is the root cause.
# "Which node is the root cause of the anomaly in Z?":
anomaly_attribution = gcm.attribute_anomalies(causal_model, "Z", anomalous_sample)
# Or sampling from an interventional distribution. Here, under the intervention do(Y := 2).
samples = gcm.interventional_samples(causal_model, interventions={'Y': lambda y: 2}, num_samples_to_draw=100)
The GCM framework offers many more features beyond these examples. For a full code example, check out the `Online Shop example notebook <https://www.pywhy.org/dowhy/main/example_notebooks/gcm_online_shop.html>`_.
For more functionalities, example applications of DoWhy and details about the outputs, see the `User Guide <https://www.pywhy.org/dowhy/main/user_guide/intro.html>`_ or
checkout `Jupyter notebooks <https://www.pywhy.org/dowhy/main/example_notebooks/nb_index.html>`_.
More Information & Resources
============================
`Microsoft Research Blog <https://www.microsoft.com/en-us/research/blog/dowhy-a-library-for-causal-inference/>`_ | `Video Tutorial for Effect Estimation <https://www.youtube.com/watch?v=LALfQStONEc&t=114s>`_ | `Video Tutorial for Root Cause Analysis <https://www.youtube.com/watch?v=icpHrbDlGaw>`_ | `Arxiv Paper <https://arxiv.org/abs/2011.04216>`_ | `Arxiv Paper (Graphical Causal Model extension) <https://arxiv.org/abs/2206.06821>`_ | `Slides <https://www2.slideshare.net/AmitSharma315/dowhy-an-endtoend-library-for-causal-inference>`_
Citing this package
~~~~~~~~~~~~~~~~~~~
If you find DoWhy useful for your work, please cite **both** of the following two references:
- Amit Sharma, Emre Kiciman. DoWhy: An End-to-End Library for Causal Inference. 2020. https://arxiv.org/abs/2011.04216
- Patrick Blöbaum, Peter Götz, Kailash Budhathoki, Atalanti A. Mastakouri, Dominik Janzing. DoWhy-GCM: An extension of DoWhy for causal inference in graphical causal models. 2024. MLOSS 25(147):1â7. https://jmlr.org/papers/v25/22-1258.html
Bibtex::
@article{dowhy,
title={DoWhy: An End-to-End Library for Causal Inference},
author={Sharma, Amit and Kiciman, Emre},
journal={arXiv preprint arXiv:2011.04216},
year={2020}
}
@article{JMLR:v25:22-1258,
author = {Patrick Bl{{\"o}}baum and Peter G{{\"o}}tz and Kailash Budhathoki and Atalanti A. Mastakouri and Dominik Janzing},
title = {DoWhy-GCM: An Extension of DoWhy for Causal Inference in Graphical Causal Models},
journal = {Journal of Machine Learning Research},
year = {2024},
volume = {25},
number = {147},
pages = {1--7},
url = {http://jmlr.org/papers/v25/22-1258.html}
}
Issues
~~~~~~
If you encounter an issue or have a specific request for DoWhy, please `raise an issue <https://github.com/py-why/dowhy/issues>`_.
Contributing
~~~~~~~~~~~~
This project welcomes contributions and suggestions. For a guide to contributing and a list of all contributors, check out `CONTRIBUTING.md <https://github.com/py-why/dowhy/blob/main/CONTRIBUTING.md>`_ and our `docs for contributing code <https://github.com/py-why/dowhy/blob/main/docs/source/contributing/contributing-code.rst>`_. Our `contributor code of conduct is available here <https://github.com/py-why/governance/blob/main/CODE-OF-CONDUCT.md>`_.
Top Related Projects
ALICE (Automated Learning and Intelligence for Causation and Economics) is a Microsoft Research project aimed at applying Artificial Intelligence concepts to economic decision making. One of its goals is to build a toolkit that combines state-of-the-art machine learning techniques with econometrics in order to bring automation to complex causal inference problems. To date, the ALICE Python SDK (econml) implements orthogonal machine learning algorithms such as the double machine learning work of Chernozhukov et al. This toolkit is designed to measure the causal effect of some treatment variable(s) t on an outcome variable y, controlling for a set of features x.
Uplift modeling and causal inference with machine learning algorithms
Adaptive Experimentation Platform
Luigi is a Python module that helps you build complex pipelines of batch jobs. It handles dependency resolution, workflow management, visualization etc. It also comes with Hadoop support built in.
A Python library that helps data scientists to infer causation rather than observing correlation.
DoWhy is a Python library for causal inference that supports explicit modeling and testing of causal assumptions. DoWhy is based on a unified language for causal inference, combining causal graphical models and potential outcomes frameworks.
Convert designs to code with AI
Introducing Visual Copilot: A new AI model to turn Figma designs to high quality code using your components.
Try Visual Copilot