
Top Related Projects
Create and animate hand-drawn annotations on a web page

Reusable JavaScript library for creating sketchy/hand-drawn styled charts in the browser.
Quick Overview
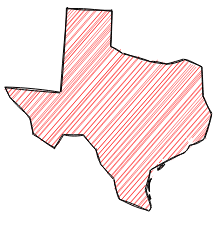
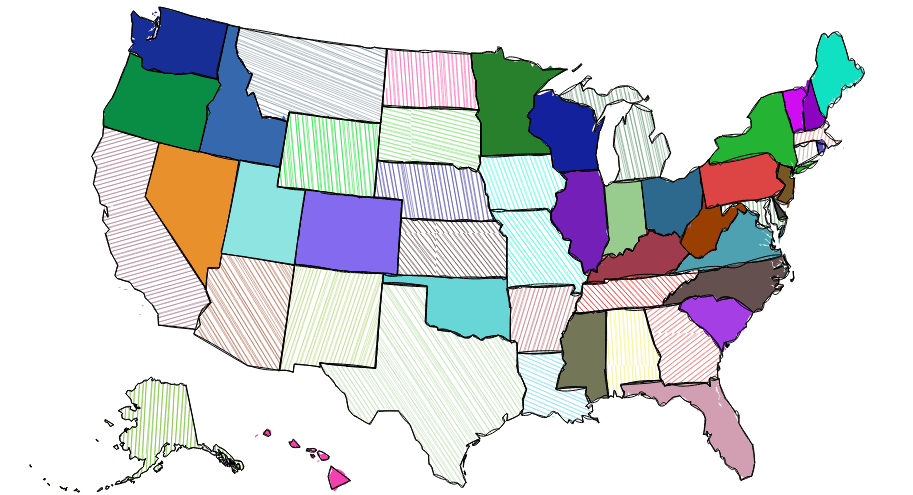
Rough.js is a small (<9kB gzipped) graphics library that lets you draw in a sketchy, hand-drawn-like style. It provides a lightweight and customizable way to create graphics with a rough, imperfect look, which can be used to add a unique aesthetic to web applications and visualizations.
Pros
- Easy to use with a simple API
- Lightweight and performant
- Works with both Canvas and SVG
- Highly customizable with various options for controlling the sketchy appearance
Cons
- Limited to 2D graphics
- May not be suitable for applications requiring precise rendering
- Performance can degrade with very complex shapes or large numbers of objects
Code Examples
Drawing a circle:
const rc = rough.canvas(document.getElementById('canvas'));
rc.circle(50, 50, 80, { roughness: 1.8, fill: 'red' });
Creating a line with custom options:
const rc = rough.canvas(document.getElementById('canvas'));
rc.line(60, 60, 190, 60, {
  bowing: 3,
  roughness: 2,
  strokeWidth: 3,
  stroke: 'blue'
});
Drawing a filled rectangle:
const rc = rough.canvas(document.getElementById('canvas'));
rc.rectangle(10, 10, 100, 100, {
  fill: 'green',
  fillStyle: 'cross-hatch',
  roughness: 2
});
Getting Started
To use Rough.js in your project, first include the library:
<script src="https://unpkg.com/roughjs@latest/bundled/rough.js"></script>
Then, create a canvas element in your HTML:
<canvas id="canvas" width="600" height="400"></canvas>
Finally, use Rough.js to draw on the canvas:
const rc = rough.canvas(document.getElementById('canvas'));
rc.circle(50, 50, 80);
rc.rectangle(120, 15, 80, 80);
rc.line(220, 15, 300, 95);
This will create a canvas with a rough-style circle, rectangle, and line.
Competitor Comparisons
Create and animate hand-drawn annotations on a web page
Pros of Rough Notation
- Focused on creating animated annotations and highlights
- Simpler API for quick implementation of specific annotation effects
- Lightweight and easy to integrate into existing projects
Cons of Rough Notation
- Limited to annotation-specific features
- Less flexibility in creating custom shapes and drawings
- Smaller community and fewer contributors
Code Comparison
Rough:
const rc = rough.canvas(document.getElementById('canvas'));
rc.rectangle(10, 10, 200, 200, {
  fill: 'red',
  hachureAngle: 60,
  hachureGap: 10
});
Rough Notation:
const annotation = RoughNotation.annotate(
  document.querySelector('h1'),
  { type: 'underline', color: 'red' }
);
annotation.show();
Summary
Rough is a more comprehensive library for creating hand-drawn-style graphics, offering a wide range of shapes and customization options. Rough Notation, on the other hand, is a specialized tool for adding animated annotations to web content. While Rough provides greater flexibility for general sketchy drawings, Rough Notation excels in quickly implementing specific annotation effects with minimal setup.
Reusable JavaScript library for creating sketchy/hand-drawn styled charts in the browser.
Pros of roughViz
- Specifically designed for data visualization, offering ready-to-use chart types
- Provides a higher-level API for creating charts with less code
- Includes additional features like animations and interactivity
Cons of roughViz
- More limited in scope, focusing only on chart creation
- Less flexible for general-purpose sketchy graphics
- Depends on D3.js, which may increase bundle size
Code Comparison
rough:
const rc = rough.canvas(document.getElementById('canvas'));
rc.circle(50, 50, 80, { fill: 'red' });
rc.rectangle(120, 15, 80, 80, { fill: 'blue' });
roughViz:
new roughViz.Bar({
  element: '#vis',
  data: 'https://raw.githubusercontent.com/jwilber/random_data/master/flavors.csv',
  labels: 'flavor',
  values: 'price'
});
Summary
rough is a more general-purpose library for creating hand-drawn style graphics, while roughViz is specifically tailored for creating sketchy data visualizations. rough offers more flexibility for various graphic elements, while roughViz provides a higher-level API for quickly creating charts with less code. The choice between the two depends on the specific needs of the project and whether the focus is on general graphics or data visualization.
Convert  designs to code with AI

Introducing Visual Copilot: A new AI model to turn Figma designs to high quality code using your components.
Try Visual CopilotREADME
Rough.js
Rough.js is a small (<9 kB) graphics library that lets you draw in a sketchy, hand-drawn-like, style. The library defines primitives to draw lines, curves, arcs, polygons, circles, and ellipses. It also supports drawing SVG paths.
Rough.js works with both Canvas and SVG.
@RoughLib on Twitter.
Install
from npm:
npm install --save roughjs
Or get the latest using unpkg: https://unpkg.com/roughjs@latest/bundled/rough.js
If you are looking for bundled version in different formats, the npm package will have these in the following locations:
CommonJS: roughjs/bundled/rough.cjs.js
ESM: roughjs/bundled/rough.esm.js
Browser IIFE: roughjs/bundled/rough.js
Usage
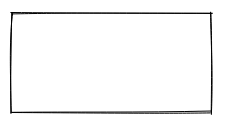
const rc = rough.canvas(document.getElementById('canvas'));
rc.rectangle(10, 10, 200, 200); // x, y, width, height
or SVG
const rc = rough.svg(svg);
let node = rc.rectangle(10, 10, 200, 200); // x, y, width, height
svg.appendChild(node);
Lines and Ellipses
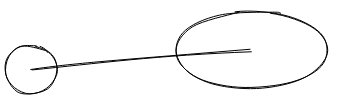
rc.circle(80, 120, 50); // centerX, centerY, diameter
rc.ellipse(300, 100, 150, 80); // centerX, centerY, width, height
rc.line(80, 120, 300, 100); // x1, y1, x2, y2
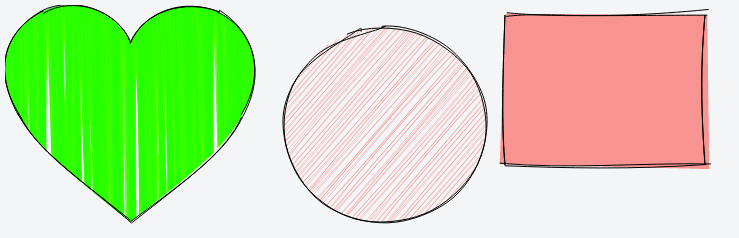
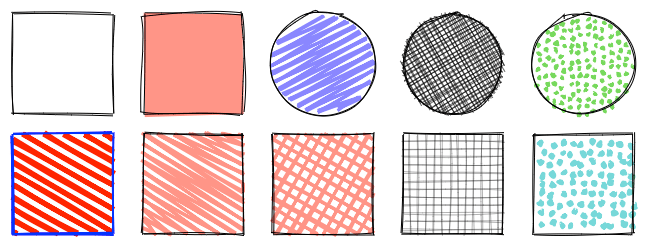
Filling
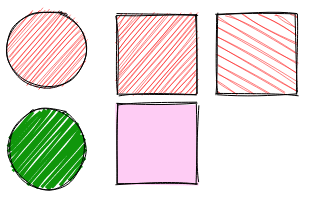
rc.circle(50, 50, 80, { fill: 'red' }); // fill with red hachure
rc.rectangle(120, 15, 80, 80, { fill: 'red' });
rc.circle(50, 150, 80, {
  fill: "rgb(10,150,10)",
  fillWeight: 3 // thicker lines for hachure
});
rc.rectangle(220, 15, 80, 80, {
  fill: 'red',
  hachureAngle: 60, // angle of hachure,
  hachureGap: 8
});
rc.rectangle(120, 105, 80, 80, {
  fill: 'rgba(255,0,200,0.2)',
  fillStyle: 'solid' // solid fill
});
Fill styles can be: hachure(default), solid, zigzag, cross-hatch, dots, dashed, or zigzag-line
Sketching style
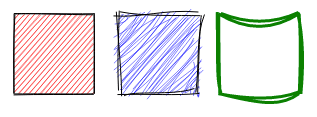
rc.rectangle(15, 15, 80, 80, { roughness: 0.5, fill: 'red' });
rc.rectangle(120, 15, 80, 80, { roughness: 2.8, fill: 'blue' });
rc.rectangle(220, 15, 80, 80, { bowing: 6, stroke: 'green', strokeWidth: 3 });
SVG Paths
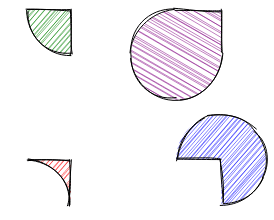
rc.path('M80 80 A 45 45, 0, 0, 0, 125 125 L 125 80 Z', { fill: 'green' });
rc.path('M230 80 A 45 45, 0, 1, 0, 275 125 L 275 80 Z', { fill: 'purple' });
rc.path('M80 230 A 45 45, 0, 0, 1, 125 275 L 125 230 Z', { fill: 'red' });
rc.path('M230 230 A 45 45, 0, 1, 1, 275 275 L 275 230 Z', { fill: 'blue' });
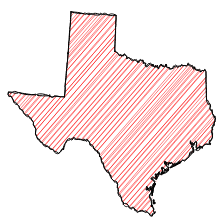
SVG Path with simplification:
Examples
API & Documentation
Credits
Some of the core algorithms were adapted from handy processing lib.
Algorithm to convert SVG arcs to Canvas described here was adapted from Mozilla codebase
Contributors
Financial Contributors
Become a financial contributor and help us sustain our community. [Contribute]
Individuals

Organizations
Support this project with your organization. Your logo will show up here with a link to your website. [Contribute]


![]()
![]()
![]()
![]()
![]()
![]()
![]()
![]()
![]()
![]()
License
Top Related Projects
Create and animate hand-drawn annotations on a web page
Reusable JavaScript library for creating sketchy/hand-drawn styled charts in the browser.
Convert designs to code with AI
Introducing Visual Copilot: A new AI model to turn Figma designs to high quality code using your components.
Try Visual Copilot