
Top Related Projects

Beautiful charts for iOS/tvOS/OSX! The Apple side of the crossplatform MPAndroidChart.

A powerful 🚀 Android chart view / graph view library, supporting line- bar- pie- radar- bubble- and candlestick charts as well as scaling, panning and animations.

📈📊🚀🚀🚀An elegant modern declarative data visualization chart framework for iOS, iPadOS and macOS. Extremely powerful, supports line, spline, area, areaspline, column, bar, pie, scatter, angular gauges, arearange, areasplinerange, columnrange, bubble, box plot, error bars, funnel, waterfall and polar chart types. 极其精美而又强大的现代化声明式数据可视化图表框架,支持柱状图、条形图、折线图、曲线图、折线填充图、曲线填充图、气泡图、扇形图、环形图、散点图、雷达图、混合图等各种类型的多达几十种的信息图图表,完全满足工作所需.

A simple and beautiful chart lib used in Piner and CoinsMan for iOS

Elegant Line Graphs for iOS. (Charting library)
Quick Overview
JBChartView is an iOS charting library for both line and bar graphs. It provides a simple and customizable way to create animated charts in iOS applications. The library is designed to be easy to use while offering a range of customization options for developers.
Pros
- Easy to implement with a simple API
- Supports both line and bar charts
- Highly customizable appearance and animations
- Lightweight and efficient
Cons
- Limited to line and bar charts only
- Not actively maintained (last update was in 2017)
- Lacks advanced features like zooming or multiple axes
- Documentation could be more comprehensive
Code Examples
Creating a basic line chart:
JBLineChartView *lineChartView = [[JBLineChartView alloc] init];
lineChartView.dataSource = self;
lineChartView.delegate = self;
[self.view addSubview:lineChartView];
[lineChartView reloadData];
Implementing the data source method for a line chart:
- (NSUInteger)numberOfLinesInLineChartView:(JBLineChartView *)lineChartView
{
    return 1;
}

- (NSUInteger)lineChartView:(JBLineChartView *)lineChartView numberOfVerticalValuesAtLineIndex:(NSUInteger)lineIndex
{
    return self.chartData.count;
}

- (CGFloat)lineChartView:(JBLineChartView *)lineChartView verticalValueForHorizontalIndex:(NSUInteger)horizontalIndex atLineIndex:(NSUInteger)lineIndex
{
    return [self.chartData[horizontalIndex] floatValue];
}
Customizing the appearance of a bar chart:
JBBarChartView *barChartView = [[JBBarChartView alloc] init];
barChartView.backgroundColor = [UIColor whiteColor];
barChartView.minimumValue = 0;
barChartView.maximumValue = 100;
barChartView.barPadding = 2.0f;
Getting Started
-
Add JBChartView to your project:
- CocoaPods: Add
pod 'JBChartView'to your Podfile - Manual: Copy the
Classesfolder into your project
- CocoaPods: Add
-
Import the header:
#import <JBChartView/JBChartView.h> -
Create and configure a chart view:
JBLineChartView *lineChartView = [[JBLineChartView alloc] initWithFrame:CGRectMake(0, 0, 320, 200)]; lineChartView.dataSource = self; lineChartView.delegate = self; [self.view addSubview:lineChartView]; -
Implement the required data source and delegate methods, then call
[lineChartView reloadData]to display the chart.
Competitor Comparisons
Beautiful charts for iOS/tvOS/OSX! The Apple side of the crossplatform MPAndroidChart.
Pros of Charts
- More comprehensive and feature-rich, offering a wider variety of chart types
- Actively maintained with regular updates and improvements
- Better documentation and community support
Cons of Charts
- Steeper learning curve due to its extensive feature set
- Larger library size, which may impact app performance
Code Comparison
JBChartView:
let barChart = JBBarChartView()
barChart.dataSource = self
barChart.delegate = self
view.addSubview(barChart)
Charts:
let barChart = BarChartView()
barChart.data = generateBarData()
barChart.delegate = self
view.addSubview(barChart)
Key Differences
- JBChartView uses a dataSource pattern, while Charts uses a more direct data assignment approach
- Charts offers more customization options and chart types out of the box
- JBChartView is simpler and easier to set up for basic use cases
Conclusion
Charts is a more powerful and versatile library, suitable for complex charting needs and actively maintained projects. JBChartView is simpler and may be preferable for basic charting requirements or projects with minimal chart complexity. The choice between the two depends on the specific needs of your project and the level of chart customization required.
A powerful 🚀 Android chart view / graph view library, supporting line- bar- pie- radar- bubble- and candlestick charts as well as scaling, panning and animations.
Pros of MPAndroidChart
- More comprehensive and feature-rich, offering a wider variety of chart types
- Active development and frequent updates
- Extensive documentation and community support
Cons of MPAndroidChart
- Steeper learning curve due to its complexity
- Larger library size, which may impact app size
Code Comparison
JBChartView (Objective-C):
JBLineChartView *lineChartView = [[JBLineChartView alloc] init];
lineChartView.dataSource = self;
lineChartView.delegate = self;
[self.view addSubview:lineChartView];
MPAndroidChart (Java):
LineChart lineChart = findViewById(R.id.chart);
LineDataSet dataSet = new LineDataSet(entries, "Label");
LineData lineData = new LineData(dataSet);
lineChart.setData(lineData);
lineChart.invalidate();
Summary
MPAndroidChart is a more robust and actively maintained library for Android, offering a wide range of chart types and customization options. It has a larger community and better documentation, but comes with a steeper learning curve and larger library size. JBChartView, on the other hand, is simpler and more lightweight, but limited to iOS and has fewer features. The code comparison shows that MPAndroidChart requires more setup but provides more flexibility in data handling and chart customization.
📈📊🚀🚀🚀An elegant modern declarative data visualization chart framework for iOS, iPadOS and macOS. Extremely powerful, supports line, spline, area, areaspline, column, bar, pie, scatter, angular gauges, arearange, areasplinerange, columnrange, bubble, box plot, error bars, funnel, waterfall and polar chart types. 极其精美而又强大的现代化声明式数据可视化图表框架,支持柱状图、条形图、折线图、曲线图、折线填充图、曲线填充图、气泡图、扇形图、环形图、散点图、雷达图、混合图等各种类型的多达几十种的信息图图表,完全满足工作所需.
Pros of AAChartKit
- More comprehensive charting options, including 3D charts and animations
- Active development with frequent updates and improvements
- Extensive documentation and examples available
Cons of AAChartKit
- Larger file size and potentially higher memory usage
- Steeper learning curve due to more complex API
Code Comparison
JBChartView:
JBBarChartView *barChartView = [[JBBarChartView alloc] init];
barChartView.dataSource = self;
barChartView.delegate = self;
[self.view addSubview:barChartView];
AAChartKit:
let aaChartView = AAChartView()
let aaChartModel = AAChartModel()
    .chartType(.column)
    .title("Chart Title")
    .series([
        AASeriesElement()
            .name("Tokyo")
            .data([7.0, 6.9, 9.5, 14.5, 18.2, 21.5, 25.2, 26.5, 23.3, 18.3, 13.9, 9.6])
    ])
aaChartView.aa_drawChartWithChartModel(aaChartModel)
AAChartKit offers more customization options and a more declarative syntax, while JBChartView provides a simpler API for basic chart types. AAChartKit is better suited for complex visualizations, while JBChartView may be preferable for simpler use cases or projects with limited resources.
A simple and beautiful chart lib used in Piner and CoinsMan for iOS
Pros of PNChart
- More chart types: Includes line, bar, circle, pie, and scatter charts
- Animated transitions: Smooth animations when updating chart data
- Customizable appearance: Offers more options for colors, fonts, and styles
Cons of PNChart
- Less performant: May struggle with large datasets compared to JBChartView
- More complex API: Steeper learning curve for basic implementations
- Less actively maintained: Fewer recent updates and contributions
Code Comparison
PNChart:
PNLineChart *lineChart = [[PNLineChart alloc] initWithFrame:CGRectMake(0, 135.0, SCREEN_WIDTH, 200.0)];
[lineChart setXLabels:@[@"SEP 1",@"SEP 2",@"SEP 3",@"SEP 4",@"SEP 5"]];
lineChart.yLabelFormat = @"%1.1f";
[lineChart setYValues:@[@60.1, @25.0, @52.3, @40.5, @70.2]];
[lineChart strokeChart];
JBChartView:
JBLineChartView *lineChartView = [[JBLineChartView alloc] init];
lineChartView.dataSource = self;
lineChartView.delegate = self;
[lineChartView reloadData];
Both libraries offer easy-to-use APIs for creating charts, but PNChart provides more built-in customization options out of the box, while JBChartView relies more on delegate methods for customization. PNChart's implementation is more declarative, while JBChartView follows a more traditional iOS pattern with data sources and delegates.
Elegant Line Graphs for iOS. (Charting library)
Pros of BEMSimpleLineGraph
- More customization options for graph appearance and behavior
- Built-in support for animations and interactive features
- Easier to implement and integrate into existing projects
Cons of BEMSimpleLineGraph
- Less comprehensive documentation compared to JBChartView
- Fewer chart types available (primarily focused on line graphs)
- May have performance issues with very large datasets
Code Comparison
BEMSimpleLineGraph:
BEMSimpleLineGraphView *myGraph = [[BEMSimpleLineGraphView alloc] initWithFrame:CGRectMake(0, 0, 320, 200)];
myGraph.dataSource = self;
myGraph.delegate = self;
[self.view addSubview:myGraph];
JBChartView:
JBLineChartView *lineChartView = [[JBLineChartView alloc] init];
lineChartView.dataSource = self;
lineChartView.delegate = self;
[self.view addSubview:lineChartView];
[lineChartView reloadData];
Both libraries offer similar basic setup, but BEMSimpleLineGraph provides more built-in customization options out of the box. JBChartView requires additional configuration for similar features. BEMSimpleLineGraph focuses on simplicity and ease of use, while JBChartView offers a wider range of chart types and more granular control over chart elements.
Convert  designs to code with AI

Introducing Visual Copilot: A new AI model to turn Figma designs to high quality code using your components.
Try Visual CopilotREADME
JBChartView
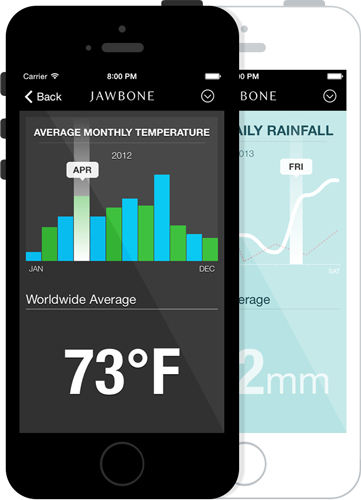
Introducing JBChartView - Jawbone's iOS-based charting library for both line and bar graphs. It is easy to set-up, and highly customizable.
Features
- Drop-in UIView subclass supported across all devices.
- Line and bar graph support.
- Simple to use protocols modeled after a UITableView.
- Highly customizable.
- Expand & collapse animation support.
Refer to the <a href="https://github.com/Jawbone/JBChartView/blob/master/CHANGELOG.md"">changelog for an overview of JBChartView's feature history.
Requirements
- Requires iOS 6 or later
- Requires Automatic Reference Counting (ARC)
Demo Project
Build and run the JBChartViewDemo project in Xcode. The demo demonstrates the use of both the line and bar charts. It also outlines how a chart's appearance can be customized.
More Demos
- Amsombe's Quartet: project showcasing the use of JBChartView in the classic data visualization example known as Anscombe's Quartet.
- Spark Friends: project showcasing the use of JBChartView in the context of sparklines and (fake) user step data.
Installation
CocoaPods is the recommended method of installing JBChartView.
The Pod Way
Simply add the following line to your Podfile:
platform :ios, '6.0'
pod 'JBChartView'
The Old School Way
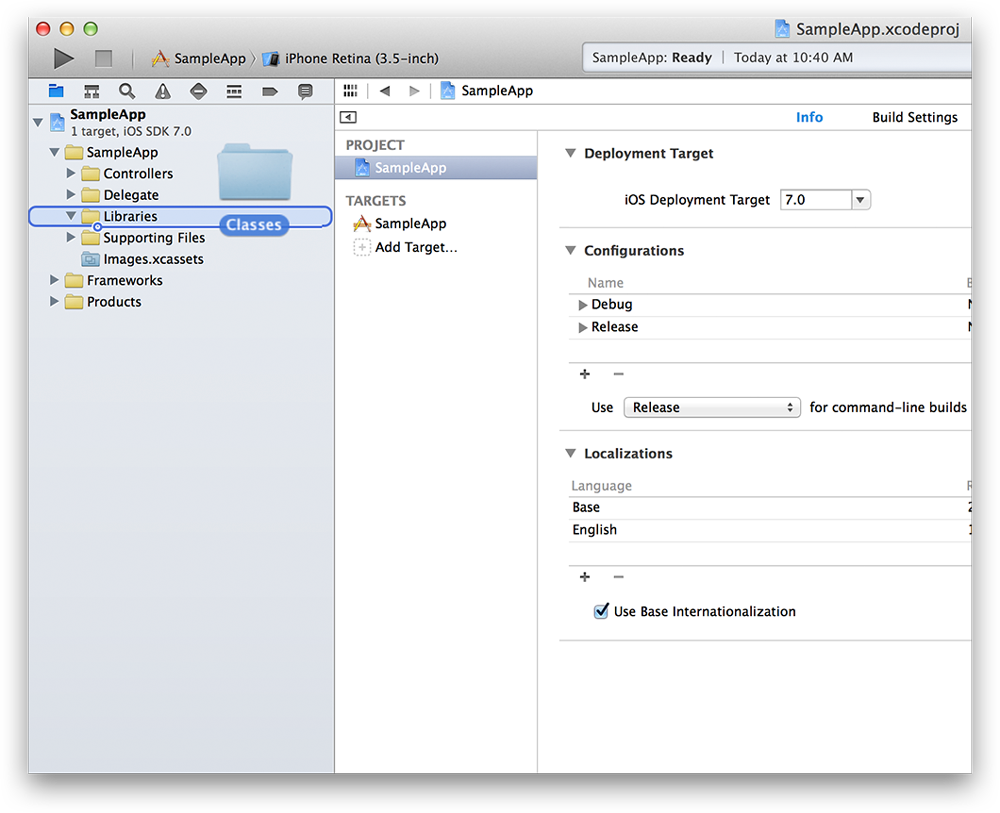
The simplest way to use JBChartView with your application is to drag and drop the /Classes folder into you're Xcode 5 project. It's also recommended you rename the /Classes folder to something more descriptive (ie. "Jawbone - JBChartView").
Usage
All JBChartView implementations have a similiar data source and delgate pattern to UITableView. If you're familiar with using a UITableView or UITableViewController, using a JBChartView subclass should be a breeze!
Swift Projects
To use JBCartView in a Swift project add the following to your bridging header (JBChartView-Bridging-Header.h):
#import <UIKit/UIKit.h>
#import "JBChartView.h"
#import "JBBarChartView.h"
#import "JBLineChartView.h"
For more information about adding bridging headers see Swift and Objective-C in the Same Project.
JBBarChartView
To initialize a JBBarChartView, you only need a few lines of code (see below). Bar charts can also be initialized via a nib or with a frame.
JBBarChartView *barChartView = [[JBBarChartView alloc] init];
barChartView.dataSource = self;
barChartView.delegate = self;
[self addSubview:barChartView];
Just like you would for a UITableView, ensure you clear these properties in your dealloc:
- (void)dealloc
{
	JBBarChartView *barChartView = ...; // i.e. _barChartView
	barChartView.delegate = nil;
	barChartView.dataSource = nil;
}
At a minimum, you need to inform the data source how many bars are in the chart:
- (NSUInteger)numberOfBarsInBarChartView:(JBBarChartView *)barChartView
{
	return ...; // number of bars in chart
}
Secondly, you need to inform the delegate the height of each bar (automatically normalized across the entire chart):
- (CGFloat)barChartView:(JBBarChartView *)barChartView heightForBarViewAtIndex:(NSUInteger)index
{
	return ...; // height of bar at index
}
Lastly, ensure you have set the frame of your barChartView & call reloadData at least once:
barChartView.frame = CGRectMake( ... );
[barChartView reloadData];
Subsequent changes to the chart's frame will not invoke reloadData; it must be called directly afterwards for any changes to take effect.
Animated Reload
Both line and bar charts support animated reloads. The delta between the old data model and new data model is calculated and animated appropriately (ie. bars or lines will shrink, expand or morph in size). Due to techinical limitations in Apple's Quartz Core Framework, line fills (both solid and gradient) can not be animated - they will simply 'snap' into place while the rest of the chart continues to animate.
- (void)reloadDataAnimated:(BOOL)animated;
State changes during a reload will be ignored. As well, subsequent calls to reloadData: or reloadDataAnimated: before any previous reloads are complete, will also be ignored. Lastly, all touch events will be ignored until a reload has completed. You can always check on the state of the animation via the exposed read-only property:
@property (nonatomic, readonly) BOOL reloading;
By default, the animation will complete in approximately 0.25 seconds. The animation duration is independent from the data model size.
Note: the above restrictions apply only to animated reloads, as non-animated reloads are synchronous.
JBLineChartView
Similiarily, to initialize a JBLineChartView, you only need a few lines of code (see below). Line charts can also be initialized via a nib or with a frame.
JBLineChartView *lineChartView = [[JBLineChartView alloc] init];
lineChartView.dataSource = self;
lineChartView.delegate = self;
[self addSubview:lineChartView];
Just like you would for a UITableView, ensure you clear these properties in your dealloc:
- (void)dealloc
{
	JBLineChartView *lineChartView = ...; // i.e. _lineChartView
	lineChartView.delegate = nil;
	lineChartView.dataSource = nil;
}
At a minimum, you need to inform the data source how many lines and vertical data points (for each line) are in the chart:
- (NSUInteger)numberOfLinesInLineChartView:(JBLineChartView *)lineChartView
{
	return ...; // number of lines in chart
}

- (NSUInteger)lineChartView:(JBLineChartView *)lineChartView numberOfVerticalValuesAtLineIndex:(NSUInteger)lineIndex
{
	return ...; // number of values for a line
}
Secondly, you need to inform the delegate of the y-position of each point (automatically normalized across the entire chart) for each line in the chart:
- (CGFloat)lineChartView:(JBLineChartView *)lineChartView verticalValueForHorizontalIndex:(NSUInteger)horizontalIndex atLineIndex:(NSUInteger)lineIndex
{
	return ...; // y-position (y-axis) of point at horizontalIndex (x-axis)
}
Note: you can return NAN instead of CGFloat to indicate missing values. The chart's line will begin at the first non-NAN value and end at the last non-NAN value. The line will interopolate any NAN values in between (ie. the line will not be interrupted).
return [[NSNumber numberWithFloat:NAN] floatValue];
Lastly, ensure you have set the frame of your lineChartView & call reloadData at least once:
lineChartView.frame = CGRectMake( ... );
[lineChartView reloadData];
Note: subsequent changes to the chart's frame will not invoke reloadData; it must be called directly afterwards for any changes to take effect.
Customization
Both the line and bar charts support a robust set of customization options. Read more about them here.
Minimum & Maximum Values
By default, a chart's minimum and maximum values are equal to the min and max supplied by the dataSource. You can override either value via:
- (void)setMinimumValue:(CGFloat)minimumValue;
- (void)setMaximumValue:(CGFloat)maximumValue;
If value(s) are supplied, they must be >= 0, otherwise an assertion will be thrown. To reset the values back to their original defaults:
- (void)resetMinimumValue;
- (void)resetMaximumValue;
The min/max values are clamped to the ceiling and floor of the actual min/max values of the chart's data source; for example, if a maximumValue of 20 is supplied & the chart's actual max is 100, then 100 will be used. For min/max modifications to take effect, reloadData must be called.
Performance
The nature of charting is to display all available information, unlike a UITableView, which can cache rows that are offscreen. JBChartView's performance will suffer if the number of data points exceed the resolution of the device. The same issue exists with MKMapView, when hundreds of pins are supplied within a certain geographic area. It's why Apple recommends clustering to avoid performance issues. As such, for large datasets, we recommend that your dataSource to supply a subset of points; clustering those that are close to one another.
License
Usage is provided under the Apache License (v2.0). See LICENSE for full details.
Top Related Projects
Beautiful charts for iOS/tvOS/OSX! The Apple side of the crossplatform MPAndroidChart.
A powerful 🚀 Android chart view / graph view library, supporting line- bar- pie- radar- bubble- and candlestick charts as well as scaling, panning and animations.
📈📊🚀🚀🚀An elegant modern declarative data visualization chart framework for iOS, iPadOS and macOS. Extremely powerful, supports line, spline, area, areaspline, column, bar, pie, scatter, angular gauges, arearange, areasplinerange, columnrange, bubble, box plot, error bars, funnel, waterfall and polar chart types. 极其精美而又强大的现代化声明式数据可视化图表框架,支持柱状图、条形图、折线图、曲线图、折线填充图、曲线填充图、气泡图、扇形图、环形图、散点图、雷达图、混合图等各种类型的多达几十种的信息图图表,完全满足工作所需.
A simple and beautiful chart lib used in Piner and CoinsMan for iOS
Elegant Line Graphs for iOS. (Charting library)
Convert designs to code with AI
Introducing Visual Copilot: A new AI model to turn Figma designs to high quality code using your components.
Try Visual Copilot