
Top Related Projects

The interactive graphing library for Python :sparkles:

Declarative visualization library for Python

Interactive Data Visualization in the browser, from Python

Statistical data visualization in Python

matplotlib: plotting with Python

With Holoviews, your data visualizes itself.
Quick Overview
Chartify is a Python library developed by Spotify that makes it easy to create charts. It provides a high-level interface for data visualization, built on top of Bokeh, which allows users to create complex, interactive charts with minimal code. Chartify aims to make it simple for data scientists and analysts to create consistent, professional-looking charts.
Pros
- Easy to use with a consistent API across different chart types
- Produces visually appealing charts with sensible defaults
- Supports a wide range of chart types and customization options
- Built on top of Bokeh, allowing for interactive charts
Cons
- Less flexible than lower-level libraries like Matplotlib for highly custom visualizations
- Requires Bokeh as a dependency, which can be heavy for some projects
- Limited documentation compared to more established visualization libraries
- May have a steeper learning curve for users already familiar with other plotting libraries
Code Examples
Creating a simple bar chart:
import chartify

# Create the chart object
ch = chartify.Chart(blank_labels=True, x_axis_type='categorical')

# Plot the data
ch.plot.bar(
    data_frame=df,
    categorical_columns='category',
    numeric_column='value'
)

# Show the chart
ch.show()
Creating a scatter plot with custom colors:
import chartify

# Create the chart object
ch = chartify.Chart(blank_labels=True)

# Plot the data
ch.plot.scatter(
    data_frame=df,
    x_column='x',
    y_column='y',
    color_column='group'
)

# Customize the chart
ch.set_title("Scatter Plot Example")
ch.axes.set_xaxis_label("X Axis")
ch.axes.set_yaxis_label("Y Axis")

# Show the chart
ch.show()
Creating a line chart with multiple series:
import chartify

# Create the chart object
ch = chartify.Chart(blank_labels=True)

# Plot the data
ch.plot.line(
    data_frame=df,
    x_column='date',
    y_column='value',
    color_column='series'
)

# Add a legend
ch.set_legend_location('right')

# Show the chart
ch.show()
Getting Started
To get started with Chartify, follow these steps:
-
Install Chartify using pip:
pip install chartify -
Import Chartify in your Python script:
import chartify -
Create a chart object and start plotting:
ch = chartify.Chart()
ch.plot.bar(data_frame=your_data, categorical_columns='category', numeric_column='value')
ch.show()
For more detailed instructions and examples, refer to the Chartify documentation on GitHub.
Competitor Comparisons
The interactive graphing library for Python :sparkles:
Pros of Plotly
- More extensive and diverse chart types available
- Interactive visualizations with zooming, panning, and hover tooltips
- Supports both Python and JavaScript, enabling web-based visualizations
Cons of Plotly
- Steeper learning curve due to more complex API
- Larger file sizes and potential performance issues with large datasets
- May require additional setup for certain chart types or features
Code Comparison
Plotly example:
import plotly.graph_objects as go

fig = go.Figure(data=go.Bar(y=[2, 3, 1]))
fig.show()
Chartify example:
import chartify

ch = chartify.Chart(blank_labels=True)
ch.plot.bar(
    data_frame=df,
    categorical_columns='category',
    numeric_column='value'
)
ch.show()
Chartify provides a more streamlined API for common chart types, while Plotly offers more granular control over chart elements and interactivity. Plotly's syntax is generally more verbose but allows for greater customization. Chartify aims to simplify the process of creating charts with sensible defaults and a consistent API across different chart types.
Declarative visualization library for Python
Pros of Altair
- More flexible and expressive grammar of graphics
- Better integration with Jupyter notebooks and web-based environments
- Larger community and more frequent updates
Cons of Altair
- Steeper learning curve for beginners
- Less built-in chart types compared to Chartify
Code Comparison
Altair:
import altair as alt
from vega_datasets import data

chart = alt.Chart(data.cars()).mark_point().encode(
    x='Horsepower',
    y='Miles_per_Gallon',
    color='Origin'
)
Chartify:
import chartify

ch = chartify.Chart(blank_labels=True)
ch.plot.scatter(
    data_frame=df,
    x_column='Horsepower',
    y_column='Miles_per_Gallon',
    color_column='Origin'
)
Both Altair and Chartify are powerful data visualization libraries for Python. Altair offers a more flexible and expressive grammar of graphics, making it easier to create complex visualizations. It also integrates well with Jupyter notebooks and web-based environments. However, Altair has a steeper learning curve for beginners compared to Chartify.
Chartify, developed by Spotify, provides a higher-level API with more built-in chart types, making it easier for users to quickly create common visualizations. It's particularly useful for those who prefer a more straightforward approach to plotting.
The code comparison shows that both libraries can create similar scatter plots, but with different syntax and approaches. Altair uses a declarative style, while Chartify employs a more imperative method.
Interactive Data Visualization in the browser, from Python
Pros of Bokeh
- More flexible and customizable, allowing for complex interactive visualizations
- Larger community and ecosystem, with extensive documentation and examples
- Supports server-side rendering for large datasets and real-time updates
Cons of Bokeh
- Steeper learning curve, especially for beginners
- Requires more code to create basic charts compared to Chartify
- Less integrated with data manipulation libraries like Pandas
Code Comparison
Bokeh:
from bokeh.plotting import figure, show

p = figure(title="Simple Line Chart")
p.line([1, 2, 3, 4, 5], [6, 7, 2, 4, 5])
show(p)
Chartify:
import chartify

ch = chartify.Chart(blank_labels=True)
ch.plot.line(
    data_frame=df,
    x_column='x',
    y_column='y'
)
ch.show()
Bokeh offers more granular control over chart elements but requires more code for basic charts. Chartify provides a higher-level API, making it easier to create common chart types with less code. However, Chartify's simplicity comes at the cost of reduced flexibility compared to Bokeh's extensive customization options.
Statistical data visualization in Python
Pros of Seaborn
- More extensive and mature library with a wider range of statistical visualizations
- Better integration with pandas DataFrames and numpy arrays
- Larger community and more extensive documentation
Cons of Seaborn
- Steeper learning curve for beginners
- Less focus on interactive and dynamic visualizations
- May require more code for customization compared to Chartify
Code Comparison
Seaborn:
import seaborn as sns
import matplotlib.pyplot as plt

sns.scatterplot(x='x', y='y', data=df)
plt.show()
Chartify:
import chartify

ch = chartify.Chart(blank_labels=True)
ch.plot.scatter(
    data_frame=df,
    x_column='x',
    y_column='y'
)
ch.show()
Summary
Seaborn is a more comprehensive statistical visualization library with a wider range of plot types and better integration with pandas and numpy. It has a larger community and more extensive documentation but may have a steeper learning curve for beginners.
Chartify, developed by Spotify, focuses on creating consistent and visually appealing charts with less code. It offers a more streamlined API for common chart types but may have fewer options for advanced statistical visualizations compared to Seaborn.
The choice between the two libraries depends on the specific needs of the project, the user's familiarity with data visualization concepts, and the desired level of customization and interactivity.
matplotlib: plotting with Python
Pros of matplotlib
- Extremely flexible and customizable, allowing for fine-grained control over plot elements
- Extensive documentation and large community support
- Wide range of plot types and styles available
Cons of matplotlib
- Steeper learning curve, especially for complex visualizations
- More verbose code required for common plotting tasks
- Default styles may require additional customization for modern, polished looks
Code Comparison
matplotlib:
import matplotlib.pyplot as plt

x = [1, 2, 3, 4, 5]
y = [2, 4, 6, 8, 10]

plt.plot(x, y)
plt.xlabel('X-axis')
plt.ylabel('Y-axis')
plt.title('Simple Line Plot')
plt.show()
Chartify:
import chartify

ch = chartify.Chart(blank_labels=True)
ch.plot.line(
    data_frame=df,
    x_column='x',
    y_column='y'
)
ch.show()
Matplotlib offers more granular control but requires more code for basic plots. Chartify provides a higher-level API, resulting in more concise code for common chart types. Matplotlib's flexibility comes at the cost of verbosity, while Chartify sacrifices some customization options for ease of use.
With Holoviews, your data visualizes itself.
Pros of HoloViews
- More flexible and powerful, supporting a wider range of plot types and data structures
- Better integration with other HoloViz tools like Panel and Bokeh
- More active development and larger community support
Cons of HoloViews
- Steeper learning curve due to its more complex API
- Less focus on specific chart types, requiring more customization for common plots
- May be overkill for simple charting needs
Code Comparison
HoloViews:
import holoviews as hv
import pandas as pd

df = pd.DataFrame({'x': range(10), 'y': range(10)})
curve = hv.Curve(df, 'x', 'y')
hv.render(curve)
Chartify:
import chartify

ch = chartify.Chart(blank_labels=True)
ch.plot.line(
    data_frame=df,
    x_column='x',
    y_column='y'
)
ch.show()
Both libraries offer ways to create line charts, but HoloViews uses a more declarative approach, while Chartify provides a more method-chaining style API. HoloViews generally requires less code for complex visualizations, while Chartify aims for simplicity in common chart types.
Convert  designs to code with AI

Introducing Visual Copilot: A new AI model to turn Figma designs to high quality code using your components.
Try Visual CopilotREADME
Chartify
![]()
![]()
![]()
![]()
![]()
![]()
Chartify is a Python library that makes it easy for data scientists to create charts.
Why use Chartify?
- Consistent input data format: Spend less time transforming data to get your charts to work. All plotting functions use a consistent tidy input data format.
- Smart default styles: Create pretty charts with very little customization required.
- Simple API: We've attempted to make the API as intuitive and easy to learn as possible.
- Flexibility: Chartify is built on top of Bokeh, so if you do need more control you can always fall back on Bokeh's API.
Examples
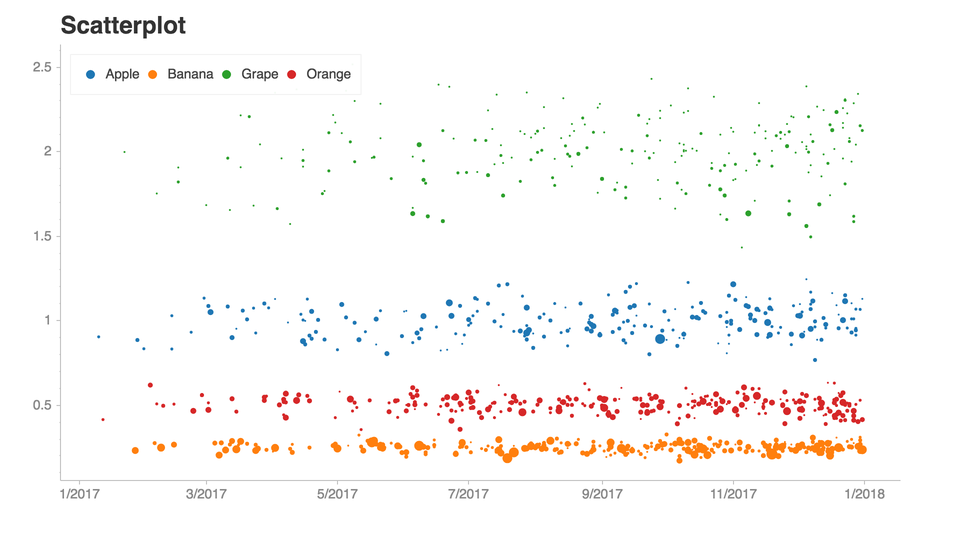
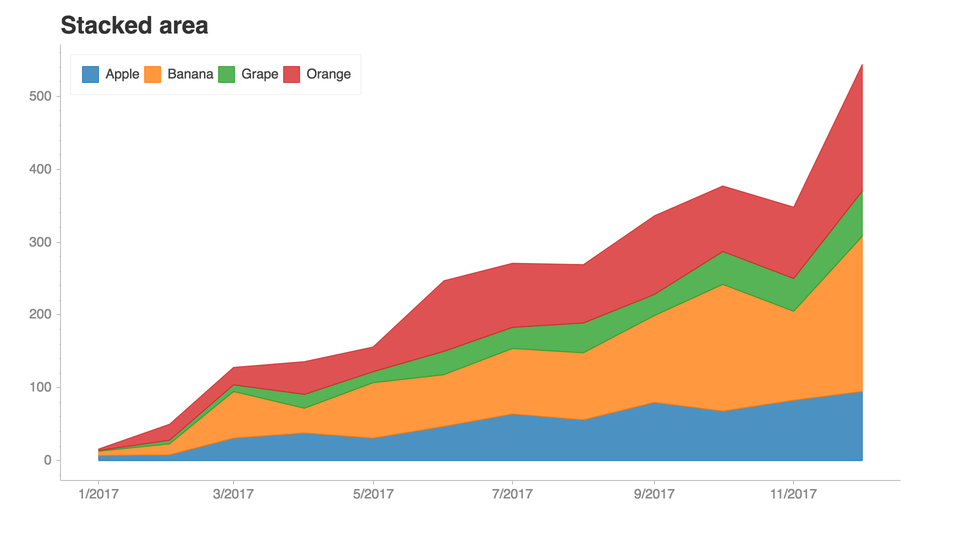
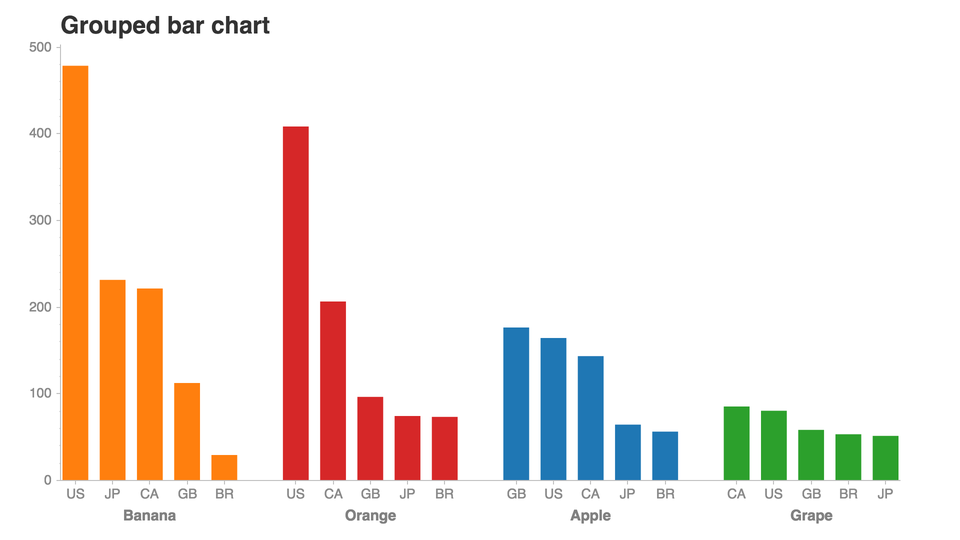
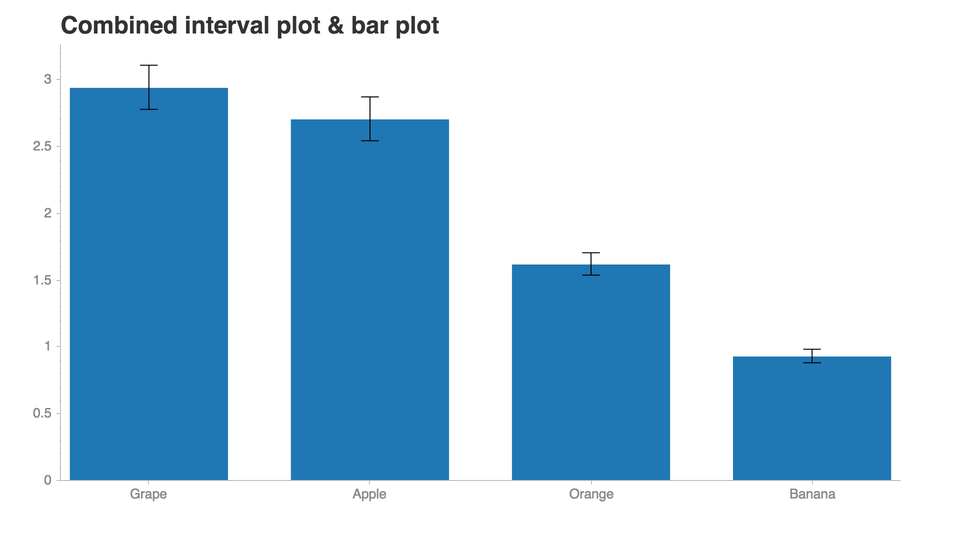
See this notebook for more examples!.
Installation
- Chartify can be installed via pip:
pip3 install chartify
- Install chromedriver requirement (Optional. Needed for PNG output):
- Install google chrome.
- Download the appropriate version of chromedriver for your OS here.
- Copy the executable file to a directory within your PATH.
- View directorys in your PATH variable:
echo $PATH - Copy chromedriver to the appropriate directory, e.g.:
cp chromedriver /usr/local/bin
Getting started
This tutorial notebook is the best place to get started with a guided tour of the core concepts of Chartify.
From there, check out the example notebook for a list of all the available plots.
Docs
Documentation available on chartify.readthedocs.io.
Getting support
Use the chartify tag on StackOverflow.
Code of Conduct
This project adheres to the Open Code of Conduct. By participating, you are expected to honor this code.
Contributing
Top Related Projects
The interactive graphing library for Python :sparkles:
Declarative visualization library for Python
Interactive Data Visualization in the browser, from Python
Statistical data visualization in Python
matplotlib: plotting with Python
With Holoviews, your data visualizes itself.
Convert designs to code with AI
Introducing Visual Copilot: A new AI model to turn Figma designs to high quality code using your components.
Try Visual Copilot