Top Related Projects
Beautiful charts for iOS/tvOS/OSX! The Apple side of the crossplatform MPAndroidChart.
A powerful 🚀 Android chart view / graph view library, supporting line- bar- pie- radar- bubble- and candlestick charts as well as scaling, panning and animations.
📈📊🚀🚀🚀An elegant modern declarative data visualization chart framework for iOS, iPadOS and macOS. Extremely powerful, supports line, spline, area, areaspline, column, bar, pie, scatter, angular gauges, arearange, areasplinerange, columnrange, bubble, box plot, error bars, funnel, waterfall and polar chart types. 极其精美而又强大的现代化声明式数据可视化图表框架,支持柱状图、条形图、折线图、曲线图、折线填充图、曲线填充图、气泡图、扇形图、环形图、散点图、雷达图、混合图等各种类型的多达几十种的信息图图表,完全满足工作所需.
Quick Overview
The react-native-charts-wrapper is a comprehensive charting library for React Native, providing a wide range of chart types and customization options. It is built on top of popular native charting libraries, such as Android's MPAndroidChart and iOS's Charts, to deliver a seamless and performant charting experience within React Native applications.
Pros
- Extensive Chart Types: The library supports a variety of chart types, including line charts, bar charts, pie charts, scatter plots, and more, allowing developers to choose the most appropriate visualization for their data.
- Customization Options: The library offers a rich set of customization options, enabling developers to fine-tune the appearance and behavior of the charts to match their application's design and requirements.
- Cross-Platform Compatibility: The library works seamlessly across both iOS and Android platforms, providing a consistent charting experience for users.
- Active Development and Community: The project has an active community of contributors and maintainers, ensuring regular updates, bug fixes, and feature enhancements.
Cons
- Learning Curve: The library has a relatively steep learning curve, especially for developers who are new to React Native or charting libraries in general.
- Performance Concerns: While the library aims to provide a performant charting experience, some users have reported performance issues, particularly with large datasets or complex chart types.
- Limited Documentation: The project's documentation, while generally helpful, could be more comprehensive and provide more detailed examples and use cases.
- Dependency on Native Libraries: The library relies on native charting libraries, which can introduce additional complexity and potential compatibility issues when upgrading or integrating with other React Native components.
Code Examples
Line Chart
import { LineChart } from 'react-native-charts-wrapper';

<LineChart
  style={{ flex: 1 }}
  data={{
    dataSets: [
      {
        values: [
          { x: 0, y: 5 },
          { x: 1, y: 10 },
          { x: 2, y: 15 },
          { x: 3, y: 20 },
        ],
        label: 'Line Dataset',
      },
    ],
  }}
  chartDescription={{ text: 'Line Chart' }}
  legend={{
    enabled: true,
    textSize: 14,
    form: 'SQUARE',
    formSize: 14,
    xEntrySpace: 10,
    yEntrySpace: 5,
    wordWrapEnabled: true,
  }}
  marker={{
    enabled: true,
    markerColor: '#36A2EB',
    textSize: 14,
  }}
  xAxis={{
    valueFormatter: ['Jan', 'Feb', 'Mar', 'Apr'],
  }}
  yAxis={{
    left: {
      axisMinimum: 0,
    },
    right: {
      enabled: false,
    },
  }}
/>
This code example demonstrates how to create a simple line chart using the LineChart component from the react-native-charts-wrapper library.
Bar Chart
import { BarChart } from 'react-native-charts-wrapper';

<BarChart
  style={{ flex: 1 }}
  data={{
    dataSets: [
      {
        values: [
          { x: 0, y: 10 },
          { x: 1, y: 20 },
          { x: 2, y: 15 },
          { x: 3, y: 30 },
        ],
        label: 'Bar Dataset',
      },
    ],
  }}
  chartDescription={{ text: 'Bar Chart' }}
  legend={{
    enabled: true,
    textSize: 14,
    form: 'SQUARE',
    formSize: 14,
    xEntrySpace: 10,
    yEntrySpace: 5,
    wordWrapEnabled: true,
  }}
  xAxis={{
    valueFormatter: ['Jan', 'Feb', 'Mar', 'Apr'],
  }}
  yAxis={{
    left: {
      axisMinimum: 0,
    },
Competitor Comparisons
Beautiful charts for iOS/tvOS/OSX! The Apple side of the crossplatform MPAndroidChart.
Pros of Charts
- Native iOS performance and integration
- Extensive chart types and customization options
- Strong community support and regular updates
Cons of Charts
- Limited to iOS platform
- Steeper learning curve for non-Swift developers
- Requires separate implementation for Android
Code Comparison
Charts (Swift):
let chartView = LineChartView(frame: CGRect(x: 0, y: 0, width: 300, height: 200))
let dataSet = LineChartDataSet(entries: entries, label: "Sales")
let data = LineChartData(dataSet: dataSet)
chartView.data = data
react-native-charts-wrapper (JavaScript):
<LineChart
  data={{
    dataSets: [{
      values: entries,
      label: 'Sales'
    }]
  }}
  style={{height: 200}}
/>
Summary
Charts offers native iOS performance and extensive customization but is limited to the iOS platform. react-native-charts-wrapper provides cross-platform support for React Native but may have performance trade-offs. The choice depends on the project requirements, target platforms, and development team expertise.
A powerful 🚀 Android chart view / graph view library, supporting line- bar- pie- radar- bubble- and candlestick charts as well as scaling, panning and animations.
Pros of MPAndroidChart
- Native Android performance and optimizations
- Extensive customization options and chart types
- Large community and frequent updates
Cons of MPAndroidChart
- Limited to Android platform only
- Steeper learning curve for non-native Android developers
- Requires Java/Kotlin knowledge for implementation
Code Comparison
MPAndroidChart (Java):
LineChart chart = findViewById(R.id.chart);
ArrayList<Entry> entries = new ArrayList<>();
entries.add(new Entry(0, 4));
entries.add(new Entry(1, 8));
LineDataSet dataSet = new LineDataSet(entries, "Label");
react-native-charts-wrapper (JavaScript):
import { LineChart } from 'react-native-charts-wrapper';

<LineChart
  data={{
    dataSets: [{
      values: [{x: 0, y: 4}, {x: 1, y: 8}],
      label: 'Label'
    }]
  }}
/>
MPAndroidChart offers native Android performance and extensive customization options, but is limited to the Android platform. It requires Java/Kotlin knowledge and has a steeper learning curve for non-native Android developers. react-native-charts-wrapper provides cross-platform support and easier integration for React Native developers, but may have performance trade-offs compared to native solutions. The code comparison shows the difference in syntax and implementation between the two libraries.
📈📊🚀🚀🚀An elegant modern declarative data visualization chart framework for iOS, iPadOS and macOS. Extremely powerful, supports line, spline, area, areaspline, column, bar, pie, scatter, angular gauges, arearange, areasplinerange, columnrange, bubble, box plot, error bars, funnel, waterfall and polar chart types. 极其精美而又强大的现代化声明式数据可视化图表框架,支持柱状图、条形图、折线图、曲线图、折线填充图、曲线填充图、气泡图、扇形图、环形图、散点图、雷达图、混合图等各种类型的多达几十种的信息图图表,完全满足工作所需.
Pros of AAChartKit
- Native iOS support with Swift and Objective-C compatibility
- Extensive customization options for chart appearance and animations
- Lightweight and easy to integrate into iOS projects
Cons of AAChartKit
- Limited to iOS platform, not cross-platform like react-native-charts-wrapper
- May require more native iOS development knowledge compared to React Native
Code Comparison
AAChartKit (Swift):
let aaChartView = AAChartView()
let aaChartModel = AAChartModel()
    .chartType(.area)
    .title("Chart Title")
    .series([
        AASeriesElement()
            .name("Tokyo")
            .data([7.0, 6.9, 9.5, 14.5, 18.2, 21.5, 25.2, 26.5, 23.3, 18.3, 13.9, 9.6])
    ])
aaChartView.aa_drawChartWithChartModel(aaChartModel)
react-native-charts-wrapper (JavaScript):
<LineChart
  data={{
    datasets: [{
      data: [7.0, 6.9, 9.5, 14.5, 18.2, 21.5, 25.2, 26.5, 23.3, 18.3, 13.9, 9.6]
    }]
  }}
  width={Dimensions.get('window').width}
  height={220}
/>
AAChartKit is more suitable for native iOS development with extensive customization options, while react-native-charts-wrapper offers cross-platform support for React Native projects. The choice between the two depends on the specific project requirements and target platforms.
Convert  designs to code with AI

Introducing Visual Copilot: A new AI model to turn Figma designs to high quality code using your components.
Try Visual CopilotREADME
React Native Charts Wrapper
This library is React Native wrapper of popular Native charting library MPAndroidChart and Charts
Introduction
Inspired by react-native-mp-android-chart and react-native-ios-charts
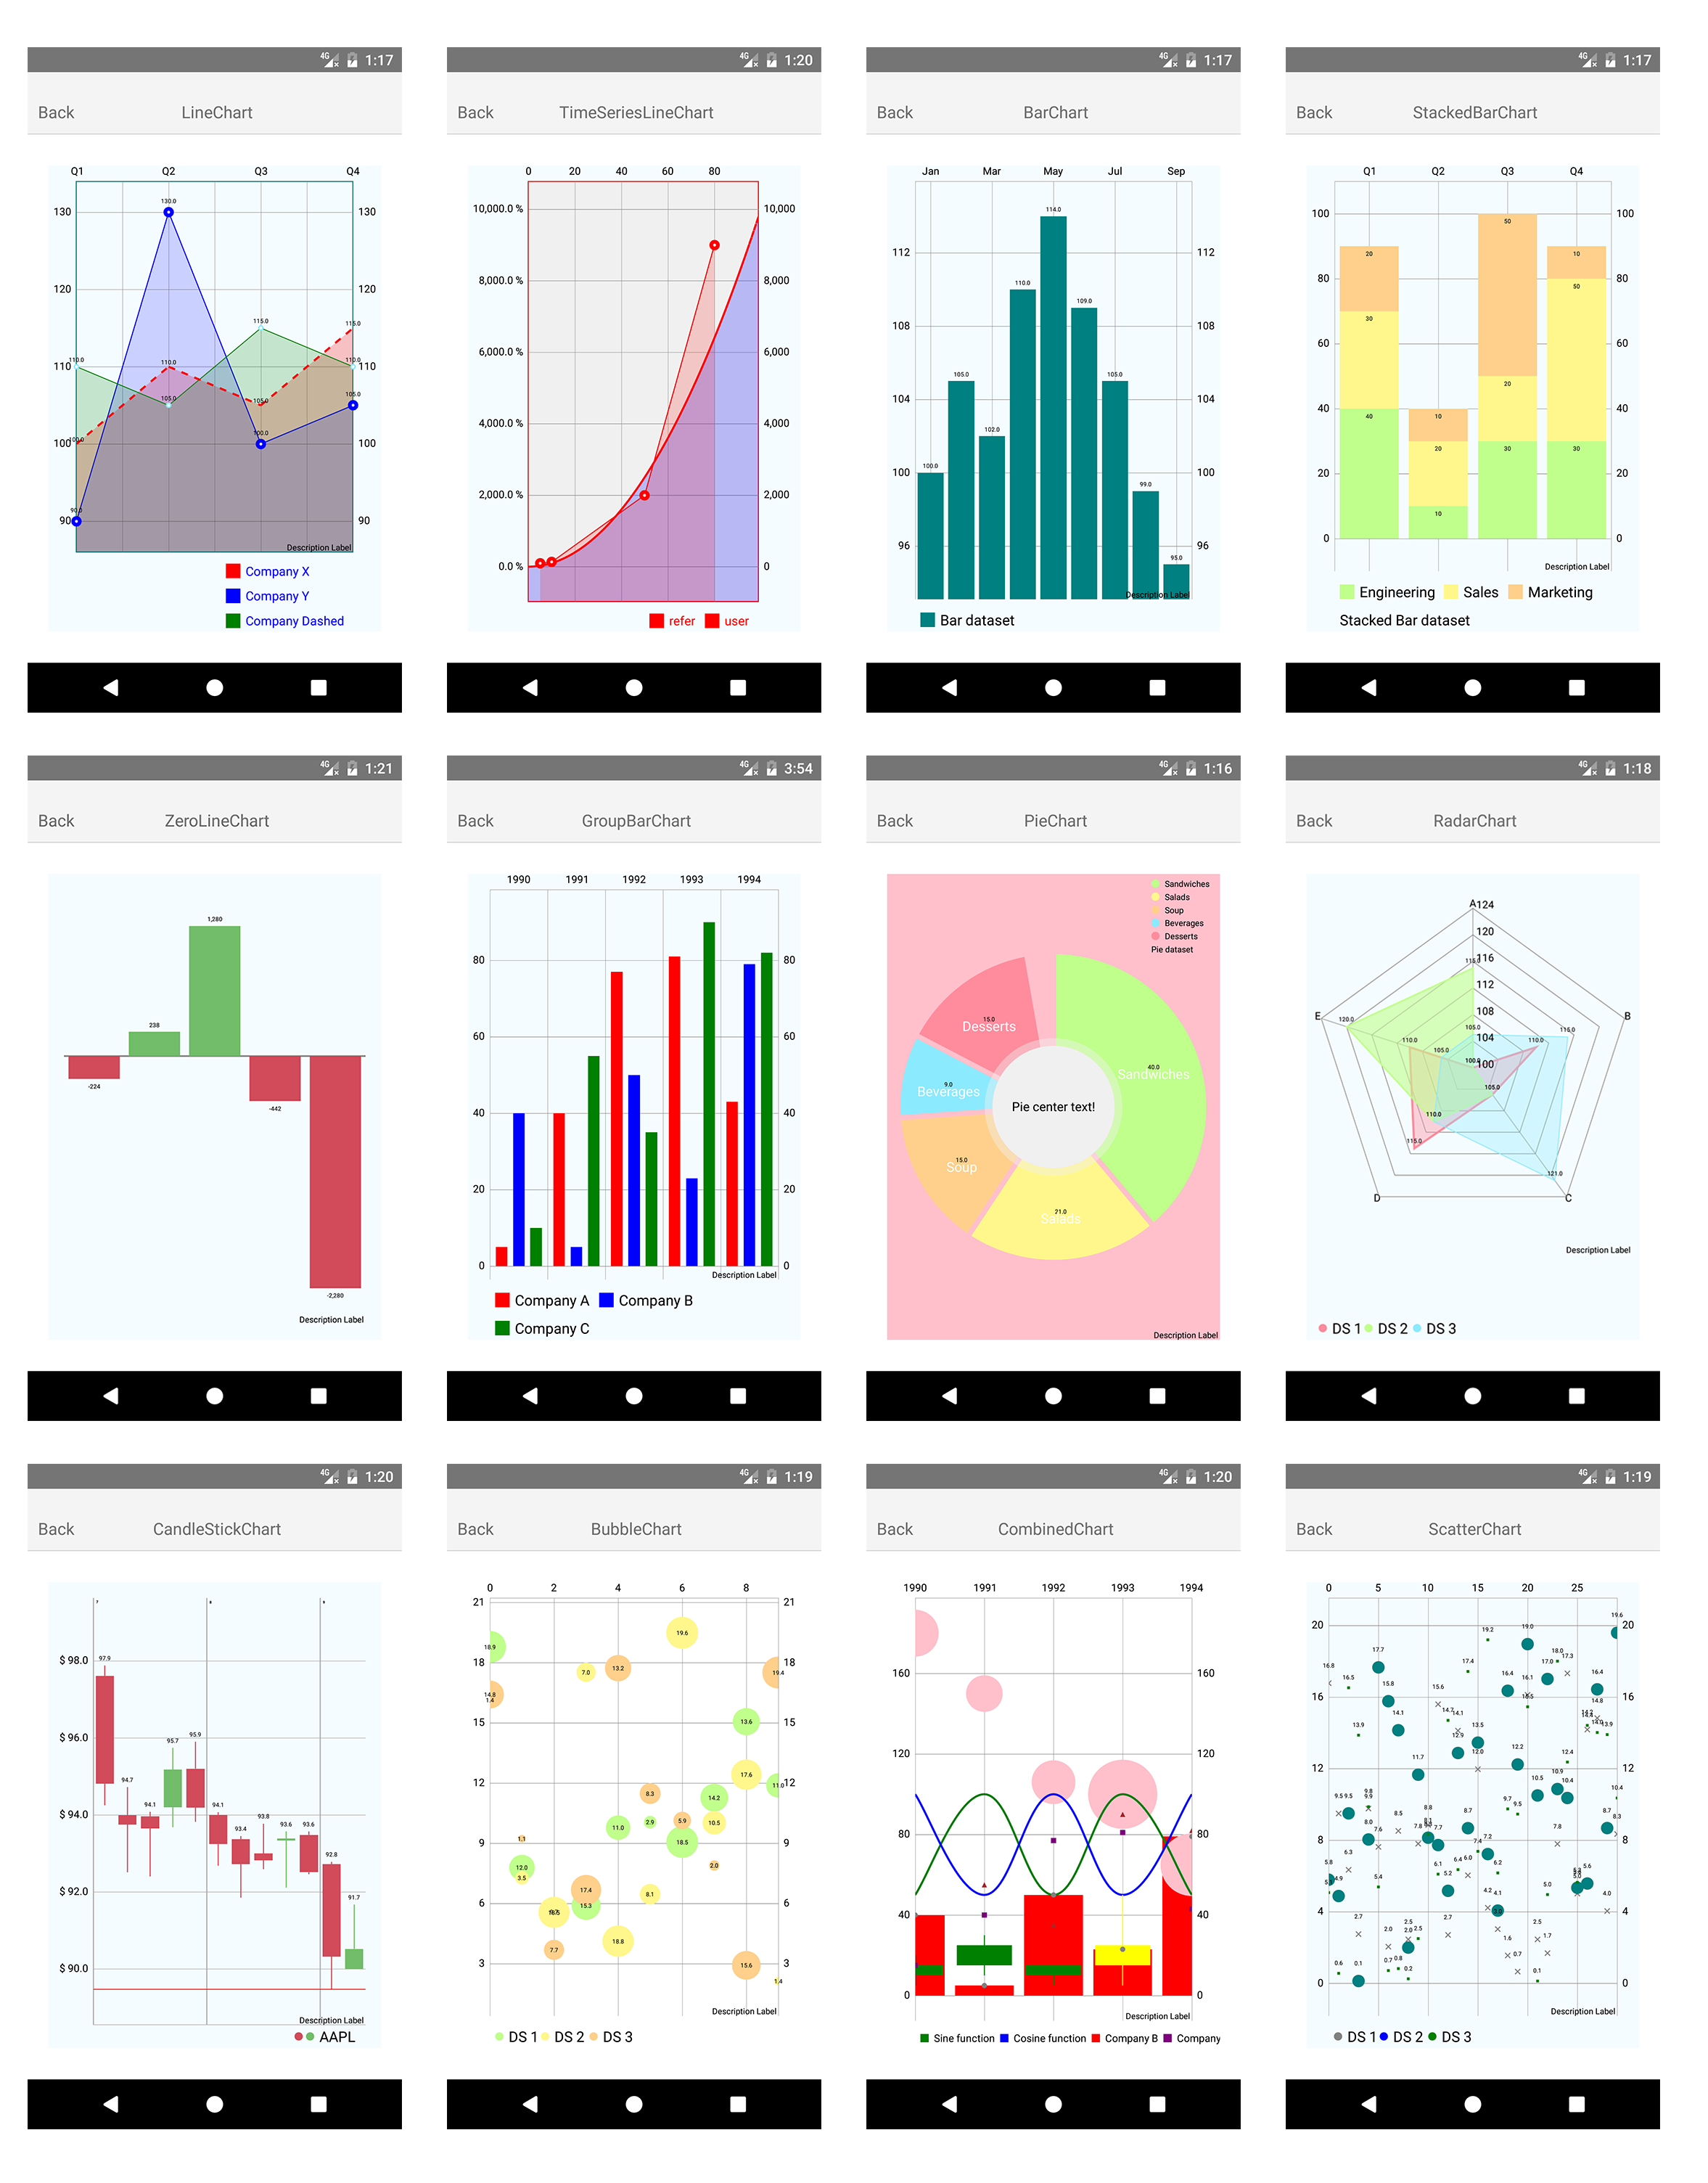
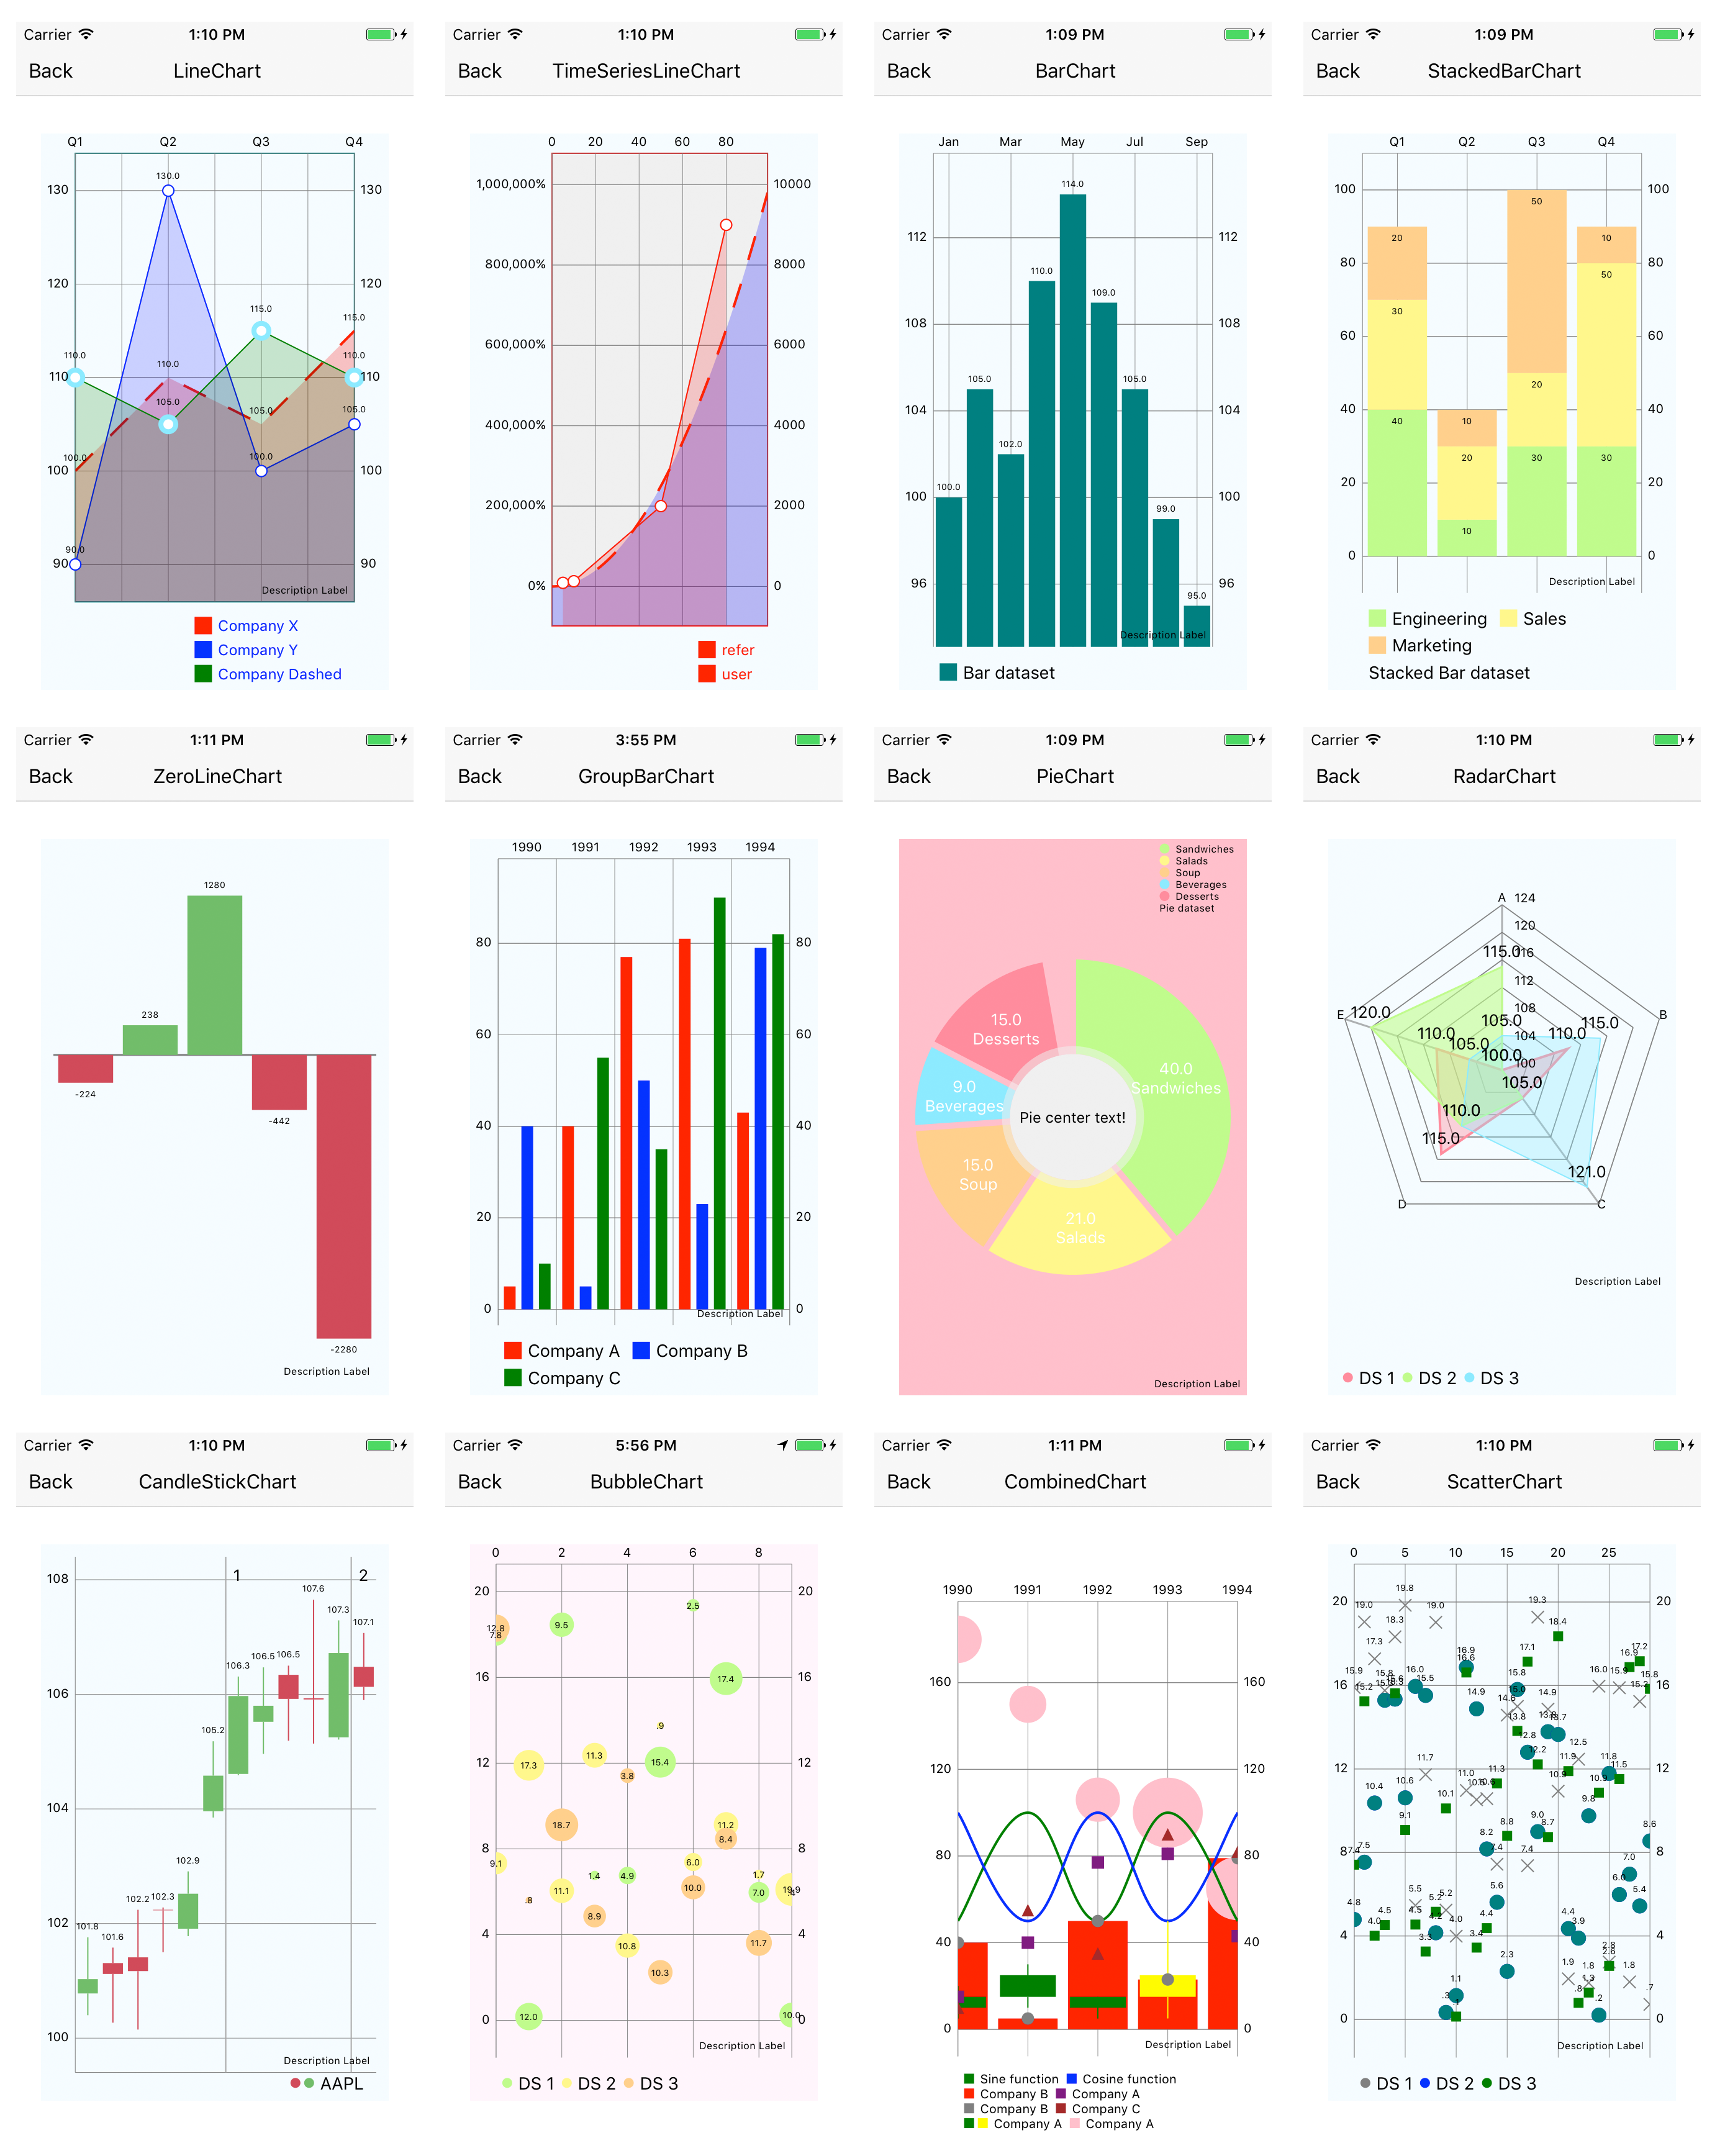
React Native Charts Wrapper is built on MPAndroidChart(v3.1.0) & Charts(v3.3.0), support both android & iOS.
ANDROID

IOS

Supported Chart Type
- Bar(Stack,Group)
- Line
- Scatter
- Bubble
- Pie
- Radar
- Combined
- CandleStick
Setup
expo
- expo init demo
- cd demo
- expo install react-native-charts-wrapper
- eas build
react-native
- npx react-native init demo
- cd demo
- npm install --save react-native-charts-wrapper
- cd ios && pod install
- npx react-native run-ios/run-android
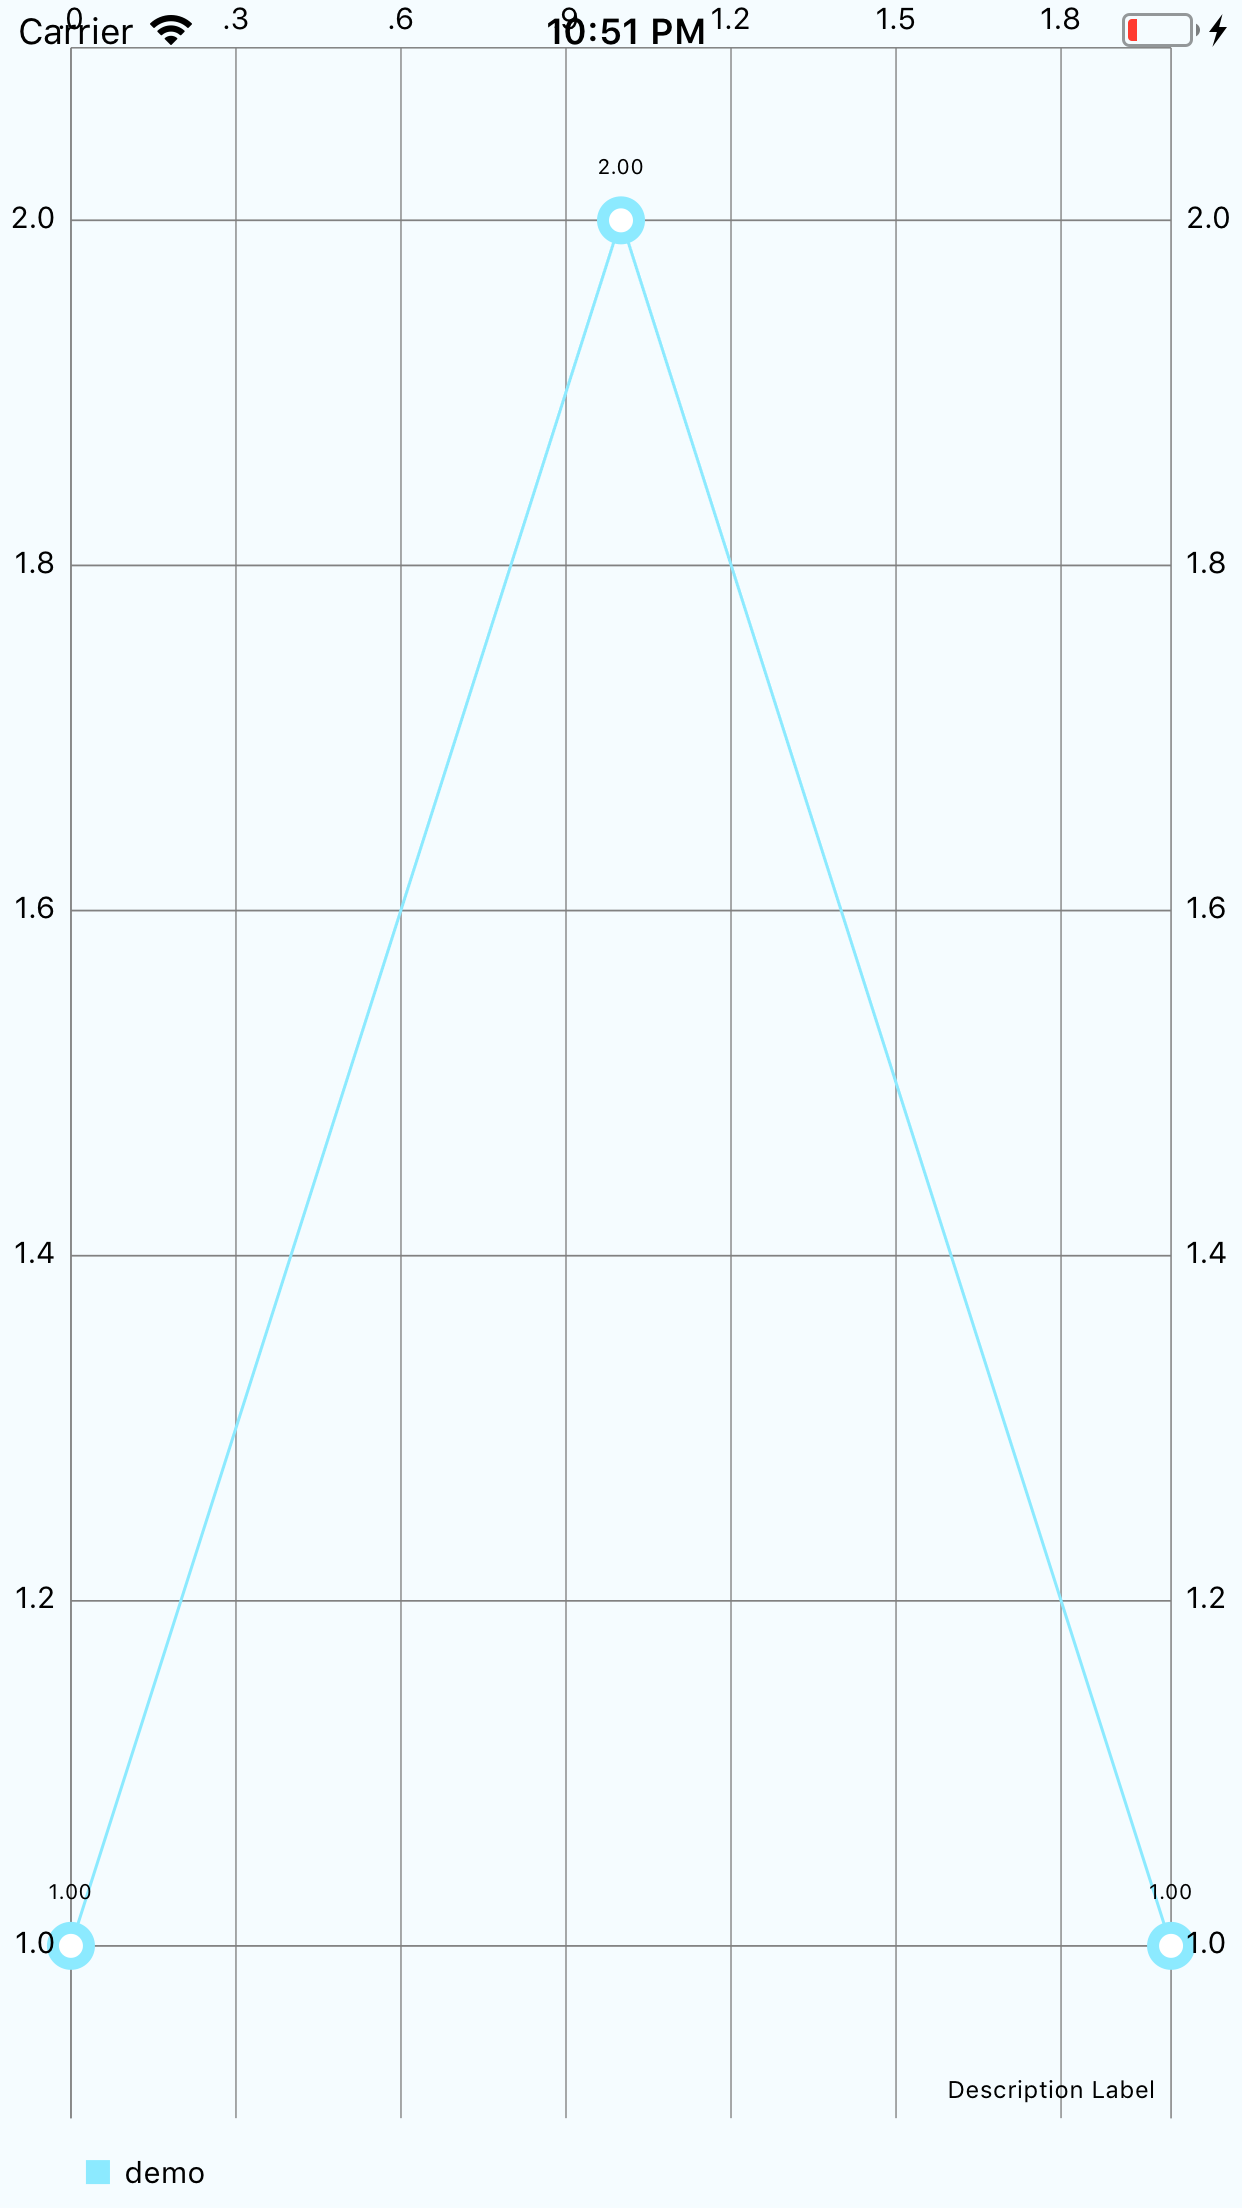
update App.js
import React from 'react';
import {
  AppRegistry,
  StyleSheet,
  Text,
  View, processColor
} from 'react-native';

import {LineChart} from 'react-native-charts-wrapper';

export default class App extends React.Component {

  render() {
    return (
      <View style={{flex: 1}}>
        <View style={styles.container}>
          <LineChart style={styles.chart}
            data={{dataSets:[{label: "demo", values: [{y: 1}, {y: 2}, {y: 1}]}]}}
          />
        </View>
      </View>
    );
  }
}

const styles = StyleSheet.create({
  container: {
    flex: 1,
    backgroundColor: '#F5FCFF'
  },
  chart: {
    flex: 1
  }
});

Usage
There are 8 supported charts with many configuration options. Almost all configuration available in base MPAndroidChart library are available through this wrapper. More details on available configuration can be found on their wiki.
Example of how charts are used and how to apply configuration can be found in example.
Convention
Android and IOS have different convention:
- color's alpha in android is 0-255, in ios is 0-1
- percent in android is 0-100, in ios is 0-1
- animation.duration in MpAndroidChart is milliseconds, in Charts is seconds.
- their enum case name is always different, for example XAxisPosition, in MpAndroidChart is BOTH_SIDED, in Charts is bothSided.
Here we use android Convention
Always use processColor to set color
Data Format
-
Complete Form
data : { ... dataSets: [ { values: [ {x: 5, y: 90}, {x: 10, y: 130}, {x: 50, y: 2000, marker: "eat more"}, {x: 80, y: 9000, marker: "eat less"} ] }, ... ] }Ã
marker is optional, if x is omitted, index will be used.
-
Simplified Form
  data: {
      ...
      dataSets: [
          {
              values: [5, 40, 77, 81, 43]
          },
          ....
      ]
  }
index will used as x.
check Example->TimeSeriesLineChart for details
Supported Callbacks
onSelect
Triggered when a chart value is selected. The event passed back will include the coordinates of the touch as well as the data (including marker label) selected.
onChange
Triggered for various supported events on each platform. Due to the different nature of gesture handling on each platform as well as the different implementations of the underlying chart libraries, the same events are not supported on every platform. For full details on the supported events, see the table below:
| Event Name | Description | iOS | Android |
|---|---|---|---|
chartScaled | When a chart is scaled/zoomed via a pinch zoom gesture. | â | â |
chartTranslated | When a chart is moved/translated via a drag gesture. | â | â |
chartPanEnd | When a chart pan gesture ends. | â | â |
chartGestureStart | When a chart gesture starts. | â | â |
chartGestureEnd | When a chart gesture ends. | â | â |
chartLongPress | When a chart is long pressed. | â | â |
chartSingleTap | When a chart is single tapped. | â | â |
chartFling | When a chart recieves a fling gesture. | â | â |
doubleTapped | When a chart is double tapped | â | â |
check Example->MultipleChart for details.
Direct Function Call
Support direct function call.
You can use chart.moveViewToX(...) or other functions directly.
check Example->MovingWindowChart for details.
supported functions:
-
highlights([...])
it can be used to highlight entries programmatically, or clear already highlighted entries if you pass empty array to it: highlights([])
-
moveViewTo/moveViewToX/moveViewToAnimated/centerViewTo/centerViewToAnimated
-
fitScreen
-
setDataAndLockIndex
It will rescale and move to the begining of your data when new data is set by default, this is not expected when you want to load more data when user scrolls.
setDataAndLockIndex will remain x/y/zoom when you load more data.
Because of the implementation of MpAndroidChart, if the action of setDataAndLockIndex is triggered by user dragging,
then the range of new data (xMax - xMin) should be equal to original data(this basicly means size of new data equals to old one), otherwise the calculation of position transition won't be accurate,
use may find the chart suddenly blink to another position.
This restriction only exists in android, in iOS, we have no such problem.You can check the example InfiniteScrollLineChartScreen.
Special properties
Several extra properties are introduced:
-
group&identifier&syncX&syncY
They are useful when you want to implement linkage charts.
Charts will sync its operation to other charts in the same group. All these sync jobs are done at native side.
You can check the example LinkageChartScreen.
Another way of syncing charts is to use onChange, but the performace is poor. You can check the example MultipleChartScreen.
There is a stock kLine chart in example, it combines group&identifier and setDataAndLockIndex together.
Custom Marker Content
Support custom marker content.
check Example->TimeSeriesLineChart for details.
Notice
size of chart
you can set chart to fixed width & height, or flex:1
License
The MIT License
Copyright (c) 2017 wuxudong
Copyright (c) 2016 Martin Skec
Copyright (c) 2016 Jose E. Padilla
Permission is hereby granted, free of charge, to any person obtaining a copy of this software and associated documentation files (the "Software"), to deal in the Software without restriction, including without limitation the rights to use, copy, modify, merge, publish, distribute, sublicense, and/or sell copies of the Software, and to permit persons to whom the Software is furnished to do so, subject to the following conditions:
The above copyright notice and this permission notice shall be included in all copies or substantial portions of the Software.
THE SOFTWARE IS PROVIDED "AS IS", WITHOUT WARRANTY OF ANY KIND, EXPRESS OR IMPLIED, INCLUDING BUT NOT LIMITED TO THE WARRANTIES OF MERCHANTABILITY, FITNESS FOR A PARTICULAR PURPOSE AND NONINFRINGEMENT. IN NO EVENT SHALL THE AUTHORS OR COPYRIGHT HOLDERS BE LIABLE FOR ANY CLAIM, DAMAGES OR OTHER LIABILITY, WHETHER IN AN ACTION OF CONTRACT, TORT OR OTHERWISE, ARISING FROM, OUT OF OR IN CONNECTION WITH THE SOFTWARE OR THE USE OR OTHER DEALINGS IN THE SOFTWARE.
Top Related Projects
Beautiful charts for iOS/tvOS/OSX! The Apple side of the crossplatform MPAndroidChart.
A powerful 🚀 Android chart view / graph view library, supporting line- bar- pie- radar- bubble- and candlestick charts as well as scaling, panning and animations.
📈📊🚀🚀🚀An elegant modern declarative data visualization chart framework for iOS, iPadOS and macOS. Extremely powerful, supports line, spline, area, areaspline, column, bar, pie, scatter, angular gauges, arearange, areasplinerange, columnrange, bubble, box plot, error bars, funnel, waterfall and polar chart types. 极其精美而又强大的现代化声明式数据可视化图表框架,支持柱状图、条形图、折线图、曲线图、折线填充图、曲线填充图、气泡图、扇形图、环形图、散点图、雷达图、混合图等各种类型的多达几十种的信息图图表,完全满足工作所需.
Convert  designs to code with AI

Introducing Visual Copilot: A new AI model to turn Figma designs to high quality code using your components.
Try Visual Copilot